A study on financial performance of restructured or revived slp es in kerala
A time series analysis of the determinants of savings in namibia
1. Journal of Economics and Sustainable Development www.iiste.org
ISSN 2222-1700 (Paper) ISSN 2222-2855 (Online)
Vol.5, No.8, 2014
52
A Time Series Analysis of the determinants of Savings in Namibia
Dr. Cyril Ayetuoma Ogbokor
Associate Professor of Economics, Department of Economics, Namibia University of
Science and Technology, Windhoek, Namibia
Tel: +264-61-2072449; E-mail address: ayetuoma@hotmail.com (Corresponding author)
Mr. Obrein Muine Samahiya
Lecturer, Department of Economics, Namibia University of Science and Technology,
Windhoek, Namibia
Tel: +264-61-2072889; E-mail address: samahiya@yahoo.com
Abstract
The driving objective of this article was to empirically establish the determinants of savings in Namibia through
the use of co-integration and error correction mechanisms for the period running from 1991 to 2012. We made
use of quarterly and annual macroeconomic data sets. The quarterly data used were derived from the annual data
set that we used in this study. The article relied heavily on unit root tests, co-integration and error correction
procedures as ways of investigating the research issue under consideration. First, the time series characteristics
of the variables used were ascertained with the help of the augmented Dickey-Fuller unit root procedure. Second,
the long-run relationship between savings and its determinants was examined using the procedure suggested in
the literature by Johansen and Juselius.
The results of the co-integration tests suggest that there is a long-run relationship between savings and the
explanatory variables used in the study. The results suggest that inflation and income have positive impact on
savings, whilst population growth rate has negative effects on savings. Further, deposit rate and financial
deepening have no significant effect on savings. Additionally, the results re-enforces the work of Iipumbu et al
(1999). Finally, the need to achieve a higher rate of savings in Namibia by improving upon income levels cannot
be overstretched.
Key Words: Macroeconomic time series data, Co-integration, Namibia, Savings, Income
INTRODUCTION
Economists have long recognized the fundamental role of savings in the promotion of economic growth and
development in both primitive and modern economies of today. Saving is necessary to fund investment in a
primitive subsistence economy. Indeed, in the absence of either money or monetary assets, saving and
investment will tend to be simultaneous acts. This is so, since saving and investment are likely to be undertaken
by the same people. Additionally, saving is also likely to be invested in the sector in which saving takes place.
However, in an economy that is highly monetized, modern and sophisticated like those of the advanced capitalist
economies such as Germany, France, The United States of America and Japan just to mention a few of them, we
have observed an increasing separation of those who want to save from those who are in dire need of investment
outlets for their money. The literature also distinguishes between three forms of savings, namely, voluntary
savings, involuntary savings and forced saving (Thirlwall, 2011:387-388). Voluntary savings are savings that do
arise as a result of a deliberate and voluntary reduction in ones disposal income. Households and the business
sector could be a good source of voluntary savings. Involuntary savings are savings arising from involuntary
reductions in consumption. Taxes, social insurance contributions and schemes are measures involving
involuntary reductions in consumption. Forced saving occur when people save in order to reduce or control the
damaging effect of inflation on their consumption.
With respect to Namibia, studies relating to savings, be it at the micro or macro level are very few and mainly
qualitative. Additionally, domestic savings mobilization remains one of key challenges undermining the
development agenda of the government of Namibia. Accordingly, this paper investigates the determinants of
savings in Namibia. More specifically, this study compliments the previous literature on saving determinants in
Namibia in the following ways: Firstly, it uses the longest time series data available so far from 1991 to 2012.
Secondly, it uses modern time series procedures. Finally, it makes use of macroeconomic variables that have not
been used in previous studies. The rest of the article is structured as follows: In section two, we made use of a
graph to show the trend in respect of selected macroeconomic variables, including savings in Namibia. In section
three, we reviewed related empirical studies. In section four, we presented the data and the procedures used in
carrying out this study; while in section five, we discussed the various econometric results obtained through the
2. Journal of Economics and Sustainable Development www.iiste.org
ISSN 2222-1700 (Paper) ISSN 2222-2855 (Online)
Vol.5, No.8, 2014
53
application of the procedures developed in section four. Finally, we presented concluding remarks, as well as,
the policy implications arising from this study in section six.
SELECTED MACROECONOMIC VARIABLES’ TRENDS IN NAMIBIA
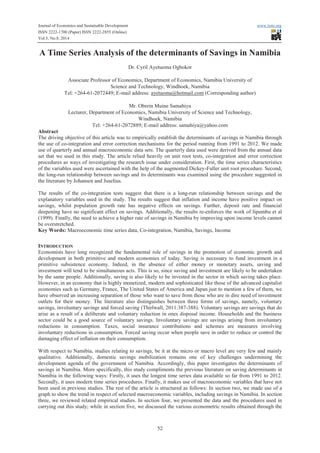
Figure 2.1, which is appearing below depicts the trend in savings, interest rate and inflation rate in Namibia for
the period running from 1991 to 2012.
Figure 2.1: Savings, Interest rate and Inflation rate in Namibia: 1991 – 2012
Source: Author’s compilation, 2013
As evident from Figure 2.1 above, savings as a percentage of GDP reached a peak of 14.71 percent in 2008,
whilst the lowest savings rate was recorded in 1991 at 4.02 percent, but averaged at 14.71 during the past two
decades. Similarly, the deposit rate on the average was 8.55 percent during the same period, with the highest and
lowest rates recorded at 4.21 percent and 12.94 percent in 1998 and 2012, respectively. Inflation rate was highest
and lowest at 26.72 percent and 1.01 percent in 2000 and 2003, respectively.
LITERATURE REVIEW
Lots of empirical studies concerning the determinants of saving are available in the literature. In this section, we
reviewed some of them, bearing in mind the driving objective of this study.
(Giancarlo et. al., 1992:529-547) using a sample of ten developing countries estimated their respective household
saving functions by combining time-series and cross-country observations. These researchers tested households’
responses to income and growth, rates of return, monetary wealth, foreign saving, and demographic variables.
Their results indicate that income and wealth variables affect saving positively, while foreign saving and
monetary assets have the opposite effects on saving. It was also observed that Inflation and the interest rate
variables did not show clear effects on saving. These results could be different if other techniques are invoked
and applied in carrying out this study.
Using Pakistan as a laboratory test ground, (Husain, 1996:49-70) in his empirical analysis of the long-run
behaviour of saving in Pakistan observed that financial deepening accounted for much of the rise in private
saving. This result contrasted with the experience of the South-East Asia countries, where the demographic
structure of the population changed significantly over the past two decades or so. For Pakistan, its high rates of
population growth have kept the country’s population age structure virtually the same. This could be the main
reason why there is a rather wide disparity in saving rates between Pakistan and South-East Asia. The use of
both economic and demographic factors by Husain, as well as, Giancarlo et. al. In their investigations is highly
commendable.
(Loayza, et al., 2000:393-414) investigated the determinants of saving rates in developing countries by paying
special attention to the relationship between growth and saving as well as the impact of specific policies on
3. Journal of Economics and Sustainable Development www.iiste.org
ISSN 2222-1700 (Paper) ISSN 2222-2855 (Online)
Vol.5, No.8, 2014
54
saving rates. T hey relied mainly upon both qualitative and quantitative approaches in carrying out their study.
They observed while economies such as China, India, including the East Asian miracle economies have
generally experienced an increase in their saving rates, countries such as South Africa, countries of the former
Soviet Union as well as the Baltic states have experienced the reverse. The study went further to implicate the
main drivers of savings. The study concluded that growth prima facie causes saving and not the reverse.
Using panel data based on China (Horioka, et. al., 2007) analysed the determinants of the household saving rate
for the period 1995 to 2004. Lagged saving rate, income growth rate, real interest rate and inflation rate are
important factors responsible for the rising saving rates in China for the period under consideration. The
variables relating to the age structure of the population did not have a significant impact on the household saving
rate. These results, thus, do provide a kind of mixed support for the life cycle hypothesis, as well as, the
permanent income hypothesis.
(Kibet, et. al., 2009:137) by using smallholder farmers, entrepreneurs and teachers in rural areas of Kenya
investigated the determinants of household saving through the use of the Ordinary Least Squares Regression
method (OLS). Their main finding was that household saving is determined by the level of education,
dependency ratio, service charge, transport costs, credit access, and type of occupation, household income, age
and gender of household head. Policy makers would need to use the results arising from this study with caution
since the method utilised in the study could lead to spurious results. We recommended further investigations in
respect of this study that uses more robust time series techniques like those that have been used by (Horioka, et.
al., 2006:214); (Loayza, et al., 2000:393) and (Giancarlo et. al., 1992:529).
(Agrawal, et. al., 2010:273-295) investigated the determinants of savings behaviour in India for the period 1962
to 2004 by invoking and applying co-integration procedures. On one hand, the study found that higher income
per capita, as well as, greater access to banking facilities significantly improved savings in India during the
period under consideration. On the other hand, the study found foreign savings and public savings to have
negative impacts on both private and household savings. Additionally, the study found that income per capita
granger causes saving and not the reverse. One apparent policy implication arising from this study is that, we
need higher rates of growth in order to encourage and mobilise greater domestic savings in the economy.
Policies should, therefore, be targeted at stimulating growth, if we are indeed, serious about promoting higher
saving rates in the national economy.
(Gedela, 2012:108-114) assessed the determinants of saving behaviour in rural and tribal households in India.
Using a combination of simple and multiple regression models, the results ultimately reveals that the age of the
head of the household, sex, dependency ratio, income and medical expenditure are significant factors influencing
the saving behaviour in both areas that were chosen for the study. In particular, it was found that in the tribal
area, dependency ratio and medical expenditure had greater dampening effect on household savings. These
results are not surprising, if one takes into consideration the economic characteristics of rural cum tribal areas.
The outcome of this study also reinforces the results obtained by (Kibet, et. al., 2009:137) in some ways.
(Nwachukwu, 2012) by employing time series data for Nigeria for the period covering 1970 to 2010 examined
the determinants of private saving in Nigeria. He relied upon co-integration procedures to estimate a saving rate
function for Nigeria within the framework of the Life Cycle Hypothesis. The results of the analysis show that the
saving rate rises with both the growth rate of disposable income and the real interest rate on bank deposits. The
degree of financial debt was also observed to have a negative impact on saving behaviour in Nigeria. Public
saving seems not to crowd-out private savings; an indication that government policies that are aimed at
improving the fiscal balance has the potential of bringing about a substantial increase in the national saving rate.
(Sandri et. al., 2012) in a study based on a panel of advanced economies, and with the following title
“Precautionary Savings in the Great Recession” found that greater labour income uncertainty was significantly
associated with higher household savings. The study also maintained that heightened uncertainty since the onset
of the Great Recession has materially increased saving rates, contributing to lower consumption and GDP
growth. Further, the estimates arising from the study suggests that at least sixty six percent of the sharp increase
in household saving rates between 2007 and 2009 can be attributed to the precautionary savings motive. These
results also reinforce the concept of “forced saving” in the literature.
(Iipumbu et. al., 1999:1-10) reviews the developments in saving and investment in Namibia over a period of
seventeen years. The study employed co-integration and error correction techniques to assess the determinants of
saving and investment in Namibia. The study found that private saving in Namibia is significantly influenced by
real income, while it is very doubtful if bank deposit rates have any influence on saving in Namibia. In
4. Journal of Economics and Sustainable Development www.iiste.org
ISSN 2222-1700 (Paper) ISSN 2222-2855 (Online)
Vol.5, No.8, 2014
55
particular, real lending rates, inflation, real income and government investments were found to be important
determinants of investments in Namibia. The study recommended the need for Namibia to address critical
challenges in its economy, especially the shortages of skilled labour in order to achieve higher growth targets in
future.
(Uanguta, et al., 2004:1-12) analysed the structure and nature of savings in Namibia with the use of qualitative
techniques. The study reveals that contractual savings which consist of pension fund contributions and life
insurance premiums dominate the structure of savings in Namibia, and indeed do account for about 60 percent of
the total private domestic savings. This is closely followed by commercial banks savings, which account for
approximately 38 percent of the total private domestic savings in Namibia. This high degree of domestic savings
does not seem to have been utilised sufficiently to propel domestic investment. The study, therefore,
recommends pro-investment policies for Namibia.
In summary, all the literature reviewed regarding the determinants of saving are pointing to the fact that a
combination of economic, social and demographic factors do come into play in terms of explaining saving
behaviour, be it at the micro or macro level. Besides, we also observed that differences in the choice of
techniques did make some impacts on the final results that the researchers obtained from their various studies.
Additionally, the research techniques and procedures used in this study are influenced in some ways by the
literature reviewed in section three.
DATA, EMPIRICAL MODEL AND METHODOLOGY
Data
The study relied upon quarterly macroeconomic time series data for the period running from 1991 to 2012. The
variables used in this study include domestic savings, inflation rate, deposit interest rate, broad money (M2),
population growth rate and gross domestic income. All the macroeconomic data used in this study were sourced
from the World Bank World Wide Web. These data sets were in turn converted into quarterly data, using the
quadratic-match average frequency conversion method. The dependent variable, savings, is measured in terms of
domestic savings as a percentage of GDP. The inflation rate is computed as a percentage change in the Namibian
GDP deflator. Gross domestic income is measured in millions of Namibia dollars, while broad money supply
(M2) is measured as a percentage of GDP. The deposit interest rate measures the average interest rate offered by
commercial banks on savings’ accounts.
Empirical Model
A review of the literature provided the basis for the empirical model for savings, which is specified in the
following way:
…(1)
where: and denote the constant term and numerical coefficients, respectively; t refers to time factor, while
L represents natural logarithm.
Additionally, , which represents savings is the dependent variable. Further, Gross domestic income (denoted by
GDI) has a positive relationship with savings. Therefore, it is expected to have a positive sign. Inflation rate is
denoted by and its coefficient is expected to either be positively or negatively signed, depending on the
situation at hand. On one hand, high inflation rate could erode consumer income and subsequently discourage
savings. On the other hand, households could cushion themselves from the adverse effects of inflation by saving
more. In consideration of the permanent income hypothesis, lagged variable for gross domestic income was
included in the model. DI denotes deposit interest rate. Theoretical knowledge tells us that, there should be a
positive relationship between savings and deposit interest rate. , which stands for broad money supply is also
expected to be positively signed. Further, population growth rate (POP), which is a proxy variable for age
dependency ratio is expected to be negatively signed.
Methodology
In most cases, time series data are characterised by non-stationarity. Regression involving non-stationary data
often leads to spurious regression results. In such a case, regression results will appear to be statistically
significant, when indeed, all that is obtained is evidence of accidental correlations rather than meaningful causal
relationships (Harris and Sollis, 2003:32). Spurious regression could lead to invalid inferences. Therefore, the
5. Journal of Economics and Sustainable Development www.iiste.org
ISSN 2222-1700 (Paper) ISSN 2222-2855 (Online)
Vol.5, No.8, 2014
56
standard hypothesis testing procedures, such as, t tests and F tests may give misleading results. Therefore, in
order to eliminate the problem of spurious regression, the variables included in a regression model must first be
differenced to make them stationary.
If a variable must be differenced d times to make it stationary, then such a variable is said to have d unit roots or
integrated of order d or I(d). If two variables are integrated of order d and b or I(d, b), then the two series are
said to be co-integrated, that is, if their linear combination is stationary (Harris and Sollis, 2003:34). Thus, co-
integration between variables would imply that, there is a long-run equilibrium relationship among the concerned
variables, such that, they will converge over time. In order to model the stationarity properties of the data used in
this study, we invoked and applied the Johansen-Juselius Co-integration Methodology, which involves two
fundamental steps. Firstly, we test for unit roots in order to establish the order of integration of each variable.
Secondly, we test for the presence of a long-run equilibrium among the variables used in the study. The
Johansen-Juselius approach is often preferred in time series studies, when it comes to the estimation of a
multivariate system, since it prevents the biasedness often associated with OLS estimations.
Unit root tests
Several ways of testing for unit roots are available in the literature. Examples of such techniques are the Dickey-
Fuller (DF) test, Augmented Dickey-Fuller (ADF) test, co-integration regression Durbin-Watson (CRDW) test,
Phillips-Perron (PP) test, Kahn and Ogaki test, Leyborne-McCabetest test, as well as, the Kwiatkowski, Phillips,
Schmidt and Shin (KPSS) test. The DF, ADF and PP tests are the most popular types of unit root tests applied in
empirical work. This is mainly due to their simplicity and general nature (Harris and Sollis, 2003:42). Therefore,
this study applies the ADF test.
The ADF test is preferred to the DF test because of its technical superiority over the DF test. More specifically, it
corrects for the weaknesses of the DF test by assuming that y follows an rather than an process.
The ADF test involves estimating the following equation:
where
If , then y contains a unit root. The null hypothesis of a unit root is not rejected, if the DF t-statistic is
greater than the DF critical value. It should be noted that the appropriate lag length should be used in
implementing this test, since too few lags may result in rejecting the null hypothesis, when in fact, it is true.
Further, too many lags might reduce the potency of the test.
The Johansen-Juselius Cointegration Approach
The vector is defined using an unrestricted vector autoregression (VAR):
where; is ( vector of variables; is an ( matrix of parameters, denotes residuals or (
vector of innovations.
The vector, , consists of ( potentially endogenous variables. Each variable in the model is regressed on both
its lagged values and the lagged values of other variables in the system. Equation (4) is estimated using OLS
technique. The VAR model can be reformulated into a Vector Error Correction model (VECM) form in the
following way:
where: ; and
Harris and Sollis (2003) states that the estimates of and describes the short-run and long-run adjustment to
changes in , respectively. The vector denotes a matrix of long-run coefficients, defined as a multiple of two
( vectors, ( and ( and they, indeed, signify the speed of adjustment to disequilibrium, and a matrix of
long-run coefficients, respectively. Equation (5) encompasses , which represents up to (
6. Journal of Economics and Sustainable Development www.iiste.org
ISSN 2222-1700 (Paper) ISSN 2222-2855 (Online)
Vol.5, No.8, 2014
57
cointegration relationships in the multivariate model. If the rank of is equal to zero, it indicates that there are
no cointegration relationships, that is, , where is the number of cointegration relationships in the
system. In a case where has a full rank, that is, ( , it implies that all the variables in the VAR are
stationary. In most cases, has a reduced rank, that is, , which points to the fact that, there are
cointegration vectors or stationary relationships. In this study, co-integration is tested using trace statistics. The
results obtained from our estimations through the application of the procedures developed in this section are
presented, and subsequently discussed in the next section.
Empirical Results
Unit Root Tests
The results in respect of the unit root tests are presented in Table 1 below. In general terms, it indicates that all
the variables have unit roots, that is, non-stationary, in levels. However, there were found to be stationary in first
difference.
Table 1: Unit Root Test Results
Level First Difference
Variable ADF ADF
Sav -3.699** -4.041***
Pop -2.549 -3.860**
M2 -2.271 -4.529***
Infr -3.784** -4.343***
GDI -3.332* -4.506***
DI -3.230* -4.079***
***/**/* indicate rejection of the null hypothesis of nonstationarity (there is unit root) at 1%/5%/10%
significance level
Co-integration Results
Co-integration was determined using Johansen’s trace statistics and the results are presented in Table 2 below.
The results show that, there are at least two co-integrating vectors. Since, there is co-integration relationships
among the variables, there is a prima facie case (econometric justification) for specifying a vector error
correction model (VECM).
Table 2: Co-integration Test Results
H0 Ha Trace Statistic 5% Critical Value Probability
r = 0 r ≥ 0 122.7316* 95.75366 0.0002
r ≤ 1 r ≥ 1 83.5108* 69.81889 0.0027
r ≤ 2 r ≥ 2 48.7651* 47.85613 0.0410
r ≤ 3 r ≥ 3 24.74964 29.79707 0.1706
r ≤ 4 r ≥ 4 6.149031 15.49471 0.6779
r ≤ 5 r ≥ 5 0.011700 3.841466 0.9136
Note: * Denotes rejection of the null hypothesis of no cointegration at 5% significance level
Results for the Long-run and short-run Models
The Table 3 appearing below shows the results of the long-run and short-run models estimations.
7. Journal of Economics and Sustainable Development www.iiste.org
ISSN 2222-1700 (Paper) ISSN 2222-2855 (Online)
Vol.5, No.8, 2014
58
Table 3: Results for the long-run and short-run models estimations
Long run Model
Variable Coefficient t-statistic
Constant 3.0786 1.140
GDI 2.6531 1.515
INFR 0.2935 7.146
DI 0.6687 3.649
M2 0.5936 2.583
POP -2.1531 -5.168
GDI(-1) -2.9353 -1.657
Error Correction Model
Constant DGDI DINFR DDI DM2 DPOP DGDI(-1) ECM(-1)
-0.01491 2.701701 0.111597 -0.0708 -0.09649 -1.64306 0.042413 0.56293
(-2.43741) (4.4494) (4.0224) (-0.4285) (-0.3094) (-2.578) (0.0815) (5.7487)
Adj. R2
= 0.62 F = 20.123 BPG = 7.292(0.399) BG=2.441(0.295) RR = 3.33(0.072)
Note: BPG = Breusch-Pagan-Godfrey (Heteroskedasticity test), BG = Breusch-Godfrey (Serial Correlation test),
RR = Ramsey Reset Test. Numbers in parentheses are t-statistics.
The error correction model results indicate that the model is heteroscedasticity and serial correlation free; and
that, it is, also stable. Additionally, the results revealed that the major determinants of savings in Namibia are
income, inflation rate, and population growth rate. Similarly, variables like interest rate, broad money supply and
past income were found to be insignificant, when it comes to the determinants of savings in Namibia.
Further, the results show that a 1 percent increase in gross domestic income would lead to a 2.7 percent rise in
savings. This result re-enforces consumption and savings theories, which postulate a positive relationship
between savings and income. The fact that the coefficient of past income was insignificant suggests that the
permanent income hypothesis is not applicable to Namibia. This also implies that past income does not influence
household decisions to save in Namibia.
The coefficient of inflation rate was found to be significant and positive, implying that in times of high inflation,
households could cushion themselves against the loss of purchasing power by saving more. Thus, a 1 percent
increase in inflation rate would result in an increase in savings to the tune of 0.1 percent. As expected,
population growth rate negatively influenced savings decisions. A 1 percent rise in population growth rate led to
a decrease in savings to the tune of 1.6 percent; suggesting that any increase in dependence ratio would have a
dampening effect on savings. The error correction term was observed to be significant and positive; implying
that whenever saving is below its equilibrium value, there will be a self-correcting mechanism in place that
would eventually enable the model to revert to its equilibrium value on the long-run.
CONCLUSION AND POLICY IMPLICATIONS
This study investigated the determinants of savings in Namibia using quarterly time series macroeconomic data
running from the period 1991 to 2012 through the application of co-integration procedures and Vector Error
Correction Mechanism (VECM). The analysis found that gross domestic income, inflation rate and population
growth are major determinants of savings in Namibia. Similarly, low, alternatively, mild inflation, as well as,
income can promote savings in various ways in the economy of Namibia. Further, population growth was found
to have negative effects on savings. As the dependency ratio of a country increases the tendency is for savings to
be discouraged for apparent reasons. However, factors such as deposit interest rate, financial deepening
(measured by broad money supply as a ratio of GDP), as well as, past income were not helpful in explaining
savings behaviour and decisions in Namibia. Given the above discussions, it is advisable for the government of
Namibia to implement macroeconomic policies in its economy that would lead to a general improvement in
8. Journal of Economics and Sustainable Development www.iiste.org
ISSN 2222-1700 (Paper) ISSN 2222-2855 (Online)
Vol.5, No.8, 2014
59
income levels; while concomitantly discouraging high population growth through appropriate and feasible anti-
population policies, if Namibia is really enthusiastic about promoting savings. Policies that would reduce
inflation rate would impact savings in terms of reduction in savings. Therefore, moderate inflation levels would
encourage savings without significantly eroding its present value. We recommend that forthcoming and
additional research concerning the issue under consideration should pay particular attention to the following
fundamental issues: The choice of the research technique, the length of the time series data to be used, as well as,
the nature of the macroeconomic data to be used, including the selection of the explanatory variables to be used.
Finally, we believe that, if for nothing else, this study has contributed significantly in several ways in shedding
light on the determinants of savings in Namibia.
REFERENCES
Agrawal, P., Sahoo, P. And Dash, K. 2010. Saving Behaviour in India: Co-integration and Causality Evidence.
The Singapore Economic Review. 55 (2). 273-295.
Gedela, S. P. R. 2012. Determinants of Saving Behaviour in Rural and Tribal Households: An Empirical
Analysis of Visakhapatnam District. International Journal of Research in Social Sciences. 2(3). 108-114.
Giancarlo, C., Webb, B. and Schmidt-Hebbel. 1992. Household Saving in Developing Countries: First Cross-
Country Evidence. The World Bank Economic Review. 6 (3). 529-547.
Harris, R. and Sollis, R. 2003. Applied Time Series Modelling and Forecasting, West Sussex: John Wileys &
Sons Ltd.
Horioka, C. Y. and Wan, J. 2007. The determinants of Household Savings In China: A Dynamic Panel Analysis
of Provincial Data. Journal of Money, Credit and Banking. 39 (8).
Husain, A. M. 1996. Private Saving and its Determinants: The Case of Pakistan. The Pakistan Development
Review. 35 (1). 49-70.
Ipumbu, W. and Kadhikwa, G. 1999. Savings and Investment in Namibia. Bank of Namibia occasional Paper
No. 2.
Kibet, L., Mutai, B., Ouma, E., Ouma S. And Owuor, G. 2009. Determinants of Household Saving: Case Study
of smallholder farmers, entrepreneurs and teachers in rural areas of Kenya. Journal of Development and
Agricultural Economics. 1 (7). 137-143.
Loayza, N., Schmidt-Hebbel, K. and Serven, Luis. 2000. Saving in Developing Countries: An Overview. The
World Bank Economic Review. 14 (3). 393-414.
Nwachukwu, T. 2012. Determinants of Private Saving in Nigeria. Unpublished article, Africa Development
Bank, Tunis. Tunisia.
Sandri, D., Ashoka, M. And Ohnsorge, F. 2012. Precautionary Savings in the Great Depression. IMF Economic
Review. 60 (1).
Uanguta, B., Haiyambo, E., Kadhikwa, G. And Chimana, S. 2004. The Structure and Nature of Savings in
Namibia. Bank of Namibia occasional paper No. 8.
12. Journal of Economics and Sustainable Development www.iiste.org
ISSN 2222-1700 (Paper) ISSN 2222-2855 (Online)
Vol.5, No.8, 2014
63
2012Q2 14.57245 4.157929687 64167041242 10.24546702 59.61302688 1.804556133
2012Q3 15.48188 4.219544271 64802810052 10.94347431 57.45585363 1.831528405
2012Q4 16.57684 4.321184896 65407613541 11.53479313 54.88692406 1.865242807
Sources: Bank of Namibia Annual Reports and Namibia Statistics Agency
13. The IISTE is a pioneer in the Open-Access hosting service and academic event
management. The aim of the firm is Accelerating Global Knowledge Sharing.
More information about the firm can be found on the homepage:
http://www.iiste.org
CALL FOR JOURNAL PAPERS
There are more than 30 peer-reviewed academic journals hosted under the hosting
platform.
Prospective authors of journals can find the submission instruction on the
following page: http://www.iiste.org/journals/ All the journals articles are available
online to the readers all over the world without financial, legal, or technical barriers
other than those inseparable from gaining access to the internet itself. Paper version
of the journals is also available upon request of readers and authors.
MORE RESOURCES
Book publication information: http://www.iiste.org/book/
Recent conferences: http://www.iiste.org/conference/
IISTE Knowledge Sharing Partners
EBSCO, Index Copernicus, Ulrich's Periodicals Directory, JournalTOCS, PKP Open
Archives Harvester, Bielefeld Academic Search Engine, Elektronische
Zeitschriftenbibliothek EZB, Open J-Gate, OCLC WorldCat, Universe Digtial
Library , NewJour, Google Scholar