Evaluation of some properties of soils affected by diesel oil pollution in uyo, niger delta area, nigeria
•
1 like•510 views

International peer-reviewed academic journals call for papers, http://www.iiste.org/Journals

Recommended
Recommended
More Related Content
What's hot
What's hot (20)
Viewers also liked
Similar to Evaluation of some properties of soils affected by diesel oil pollution in uyo, niger delta area, nigeria
Similar to Evaluation of some properties of soils affected by diesel oil pollution in uyo, niger delta area, nigeria (20)
More from Alexander Decker
More from Alexander Decker (20)
Recently uploaded
Recently uploaded (20)
Evaluation of some properties of soils affected by diesel oil pollution in uyo, niger delta area, nigeria
- 1. Journal of Biology, Agriculture and Healthcare www.iiste.org ISSN 2224-3208 (Paper) ISSN 2225-093X (Online) Vol.3, No.8, 2013 33 Evaluation of Some Properties of Soils Affected by Diesel Oil Pollution in Uyo, Niger Delta Area, Nigeria Godwin U. Akpan and Bassey T. Udoh Department of Soil Science and Land Resources Management, University of Uyo, P.M.B. 1017, Uyo E-mail: godwinuakpan@uniuyo.edu.ng Abstract Soil pollution due to oil spill is a common problem in the Niger Delta region of Nigeria. This necessitated the experiment to determine the effect of diesel oil pollution on some soil properties in Uyo within the Niger Delta region of Nigeria. The experiment was conducted at the University of Uyo Teaching and Research Farm in 2009. It was laid out in a completely randomized design (CRD) in triplicates. The size of the experimental plot was 60.7m2 , sub-divided into three sub-plots each measuring 20.24m2 . Each sub-plot was divided into five experimental units receiving the following treatments: 0 (control), 8, 11.5, 14.5 and 22.0 litres of diesel oil, which was converted into 0.0%, 1.39%, 2.50%, 3.45% and 5.06%. The results at two weeks after oil application (2WAOA) showed significant decrease in soil pH from 4.90 in the control to 4.35 in 5.06% pollution levels resulting in soil reaction being rated as extremely acid in oil polluted soils compared to the control with soil/reaction being rated as very strongly acid. There was depletion in total nitrogen and basic cations such as Ca2+ , Mg2+ , Na+ and K+ . at 2WAOA. Carbon/nitrogen ratio increased in all the treatments, with the highest pollution level (5.06%) having 114.33±1.41. Percent base saturation increased inconsistently across the treatments with the highest being 56.96±0.003% (for 2.50% pollution) and the lowest being 44.24±0.008% (for 5.06% pollution level). The results at 18WAOA showed varying degrees of increase in the soil pH. The control plot had the pH of 6.39±0.002 and the highest pollution level of 5.06% had the pH of 6.05±0.2. The soil reaction at 18 WAOA was rated slightly acid compared to extremely acid in 2WAOA. There were varying degrees of increase in organic carbon in all the treatments. Total nitrogen also increased at 18WAOA, the increase ranged from 50-80%. Carbon/Nitrogen ratio was significantly reduced (Ρ < 0.05) across the treatments. Basic cations and percent base saturation increased across the treatments at 18WAOA. Correlation between concentrations of diesel oil in the soil and some soil properties at 2WAOA and 18 WAOA showed that at 2 WAOA soil pH, total N and percent base saturation showed negative correlation, while organic carbon and carbon/nitrogen ratio showed positive correlation. At 18 WAOA, organic carbon and total N, showed positive correlation, while soil pH, carbon/nitrogen ratio and percent base saturation showed negative correlation. Keywords: Evaluation, Soil Properties, Oil polluted, Niger Delta Area, Nigeria 1. Introduction Soils and water represent the first lines of recipients of pollution with petroleum and petrochemical products. Pollution has been one of the most serious problems, especially when associated with accidental spills on a large scale. Large scale contamination has been reported in both marine and subsurface environments due to accidents involving motorized vehicles, leaves and spills from underground storage tanks, pipelines and illegal disposal (Mukheriji et al., 2004; Plohl and Briceji 2002; Saddoun 2002; Ziad et al., 2005). Soil pollution by petroleum products is also a widespread problem, and mineral oil hydrocarbons are the most frequently occurring environmental contaminants (Riffaldi et al., 2006). Contamination of land is of paramount importance to man because it is on this portion that man’s activities lie (Pathak et al., 2011). The damaging effects are due to suffocation and toxicity of the crude oil. Apart from this it has been reported that nitrate formation was reduced, even at 0.1% (v/w) of oil in and this is inimical to soil fertility (Pathak et al., 2011). Diesel fuel is a complex mixture of normal, branched, and cyclic alkanes (parafins) (60 to > 90%) by volume, having hydrocarbon chain length, usually between C9 and C30, aromatic compounds, especially alkyl benzene 5-40% by volume and polycyclic aromatic hydrocarbons (PAHs) obtained from the middle-distillate, gas-oil fraction during petroleum separation. They are produced by refining crude oils and are widely used as transportation fuels. Diesel fuel is also used in stationary engines and in boilers, reciprocating engines, gas turbines, pipeline pumps, gas compressors, steam processing units in electric power plants and water heating facilities (Shrivastava and Gupta, 2008). The various types of hazards posed by the diesel constituents include short-term hazards of water- soluble compound (such as toluene, ethyle benzene and xylene); show acute toxicity to aquatic life in the water column and long-term potential hazards including contamination of ground water. Chronic effects include changes in the liver and harmful effects on the kidneys, heart, lungs and nervous system. Increase rate of cancer, immunological, reproductive, fetotoxic and genotoxic effects have also been associated with some of the
- 2. Journal of Biology, Agriculture and Healthcare www.iiste.org ISSN 2224-3208 (Paper) ISSN 2225-093X (Online) Vol.3, No.8, 2013 34 compounds found in diesel fuels (Irwin, 1997). Oil products, including petrol not only modify physico-chemical and biological properties of the soil, but also contribute to limitations of the productive ability of arable crops (Wyszkowskwa, et al., 2002). Petroleum pollution of soil generally has strong negative effects on the plants community. The mode in which petroleum acts on plants is complex and involves both contact toxicity exhibited by low boiling components and indirect deleterious effects mediated by interactions of the petroleum with the abiotic and microbial components of soil. Polycyclic aromatic hydrocarbons (PAHs) can affect all stages of plants growth from germination to reproduction. The germination of the seed is the essential condition of the further development of the plant. Diesel oil in the soil inhibits germination by physically impeding water and oxygen transfer between the seed and the surrounding soil environment; thus, hindering the germination response. This stage of development is crucial, since the plant has not yet got sufficient detoxicative ability within this relatively short period (Adam and Duncan, 1999, Siddiqui and Adams 2002; Ziad et al., 2005). Microorganisms possess mechanisms by which they degrade diesel compounds by utilizing them as carbon or nitrogen sources. Aerobic bacterial within background soils represent about 50-70% of the total microbial abundance while anaerobic bacteria, actinomycetes and micromycetes represent about 10%, 20-30% and 1-2%, respectively (Shrivastava and Gupta, 2008). In this present investigation, the main aim was to assess the effect of diesel oil pollution on some soil properties in the Niger Delta area of Nigeria. This is with a view to developing appropriate soil management technique to ameliorate the adverse effects of oil pollution and ensure optimum and sustainable agricultural productivity of soils in the area of study. 2.0 Materials and Methods Study Area: The Niger Delta is located within latitudes 5o 45’ and 6o 35’ and longitudes 4o 50’ and 5o 15’ in the central part of southern Nigeria and has a landmass covering 70,000 square kilometers which accounts for about 8 percent of Nigeria’s landmass (NDES, 2003). The Niger Delta is one of the world’s largest Wetlands and the largest in Africa. It is a vast flood plain build up by the accumulation of centuries of silt washed down the Niger and Benue Rivers, composed of four main ecological zones-coastal barrier islands, mangroves, fresh water swamp forest, and low land rainforests whose boundaries vary according to the patterns of seasonal flooding (Moffat and Lindien, 1995). The mangrove forest of Nigeria the third largest in Africa, over 60 per cent of this mangrove or 6,000 square kilometers is found in the Niger Delta. The fresh water swamp forest of the Delta reach 11,7000 square kilometers and are the most extensive in West and Central Africa (Moffat and Lindein, 1995). The Niger Delta region has the highest biodiversity characteristics of extensive swamp and forest areas with many unique species of plants and animals. The meteorological study of the area reveals an average atmospheric temperature of 25.5o C in the rainy season and 30o C in the dry season. The daily relative humidity values ranged from 55.5 per cent in the dry season to 96 per cent in the rainy season (Gobo, 1998). The area is characterized by two distinct seasons, wet and the dry seasons. The wet season starts from March to October, while the dry season starts from November to March. A short dry spell is normally noticed in August, and it is traditionally referred to as “August Break”. The rainfall ranges from 2000-3000 mm per annum. 2.1 Field Study An experiment to evaluate soil properties in diesel oil polluted soil was conducted at the University of Uyo Teaching and research farm in 2009. The experiment was laid out in a completely randomized design (CRD) in triplicates. The size of the experimental plot was 60.7m2 . The plot was sub-divided into three sub-plots measuring 20.24m2 and each sub-plot divided into five experimental units receiving the following treatments: 0 (control), 8, 11.5, 145.5 and 22.0 litres of diesel oil, which was converted into 0.0%, 1.39%, 2.50%, 3.45% and 5.06% according to Yargodin (1982). The diesel oil used in this study was obtained from Mobil Filling Station, Uyo, Akwa Ibom State Nigeria. Diesel oil was applied evenly using a fine hose watering can to each experimental unit and properly worked into the soil by the help of a garden fork. 2.2 Laboratory Studies Soil samples were collected before oil application, 2 weeks and 18th weeks after diesel oil application (at 2WAOA degradation had taken place and the toxicity reduced and at 18 WAOA mineralization dominates immobilization) from each of the treatment and air-dried and crushed and passed through a 2-mm sieve for mechanical and chemical analysis. Soil particle size distribution was by Bouyoucos hydrometer method (Klute, 1986), pH in 1:2.5 soil/water suspension by pH- meter (Rowell, 1994). Soil organic matter by the Walkley and Black, 1934), as described by Nelson and Sommers (1982), total nitrogen was estimated by macro-kjeldahl procedure (Jackson, 1962), available phosphorus was extracted using Bray’s P-1 by the method of Bray and Kurtz (1945) and phosphorus in the extracts was determined by the method of Murphy and Riley (1962),
- 3. Journal of Biology, Agriculture and Healthcare www.iiste.org ISSN 2224-3208 (Paper) ISSN 2225-093X (Online) Vol.3, No.8, 2013 35 Exchangeable cations (Ca2+ , Mg2+ , K+ and Na+ ) were extracted with the ammonium acetate (pH 7.0) and determined by atomic absorption spectrophotometer (Udoh et al., 2009), exchangeable aluminum and hydrogen were determined with buffered potassium chloride and by titration method by 0.05 N NaOH. Effective cation exchange capacity (ECEC) was obtained by IITA (1979) summation of exchangeable bases and exchangeable acidity while the percentage base saturation was calculated as: % Base saturation = Ca2+ + mg2+ + K+ + Na+ x 100 ECEC 2.3 Statistical Analysis Analysis of variance (ANOVA) was determined based on completely randomized design (CRD) with means separated using least significant difference (LSD), correlation analysis and measures of significant were determined at 5% probability using SAS (1990). 3.0 Results and Discussion The results in Table 1 show the nutrient composition of diesel oil and Tables 2 and 3 show the physical and chemical properties of the soil before diesel application, 2 and 18 weeks after diesel application. The analysis of diesel oil showed the following nutrients 3.1 Composition: organic carbon 13.07% total nitrogen 0.15% available phosphorus 80 mg/l, calcium 4.8 mg/l, magnesium 2.8mg/l, potassium 0.3 mg/l and sodium 0.18 mg/l. Physico-chemical analysis of the soil before diesel application (Table 2) shows that the soil has a textural class of loamy sands, with sand fraction having 86.0±1.20, silt fraction 6.6±0.001% and clay fraction 4.8±0.002%. The result shows a soil reaction of very strongly acid with the pH 4.9±0.003, total nitrogen content in the soil was very low with the value of 0.05%. This shows that the soil is low in plant nutrients and may need amendment with nitrogen fertilizers for crop production. Organic carbon was moderates with the value of 1.37±0.005%, carbon/nitrogen ratio was 27.4±0.05.This indicates that immobilization may dominates mineralization of total N in the soil. The microbial assimilation of mineral nitrogen into their cell protoplasm resulted in converting inorganic nitrogen form to organic form (Akpan and Ekpo, 2006). Organic carbon in the soil increased as the level of oil in the soil increases at 2 weeks after oil application (Table 3). The highest pollution level of 5.06%, had the organic carbon content of 3.43 ±0.005% compared to the control with the organic carbon content of 2.57±0.001%. The increase in organic carbon in all the treated soil may be attributed to the hydrocarbon used in polluting the soil. The carbon/nitrogen ratio in the soil increased with increasing levels of diesel concentration in the soils at 2 WAOA (Table 3). The high increase in carbon/nitrogen ratio of 51.4±1.01 in the control plot to 114.33±1.41 in the highest pollution level of 5.06% plot. The high carbon/nitrogen ratio may be due to the activities of hydrocarbonastic utilizing microorganisms acting on the applied hydrocarbon releasing carbon into the soil. Based on this, immobilization dominates mineralization in the plots. Available P in the soil decreased with increasing concentration level of diesel oil in the soil. The highest pollution level of 5.06% had the P content of 85.28±0.5 mg/kg compared to the control plot with the P value of 120±2.0mg/kg. The reduction of about 38.93% P value in the polluted soil (5.06%) is due to immobilization of this nutrient by microbes degrading diesel oil. Basic cations (Na, K, Ca and Mg) contents at 2 WAOA were generally low in all the plots. The reasons for the low content of these nutrients may probably be due to increase pressure on the nutrients by diesel degrading microbes. Leaching may also be quite conceivable as a possible reason for the low contents of these nutrients because the area is within the humid tropical rain forest zone that is pruned to heavy rainfall and erosion. Effective cation exchange capacity was inconsistent in all the treatments. The values ranged from 5.38 ± 0.003 cmol/kg in the control to 7.92±0.008 cmol/kg in the 2.50% concentration level as the highest. Percent base saturation was decreasing inconsistently in all the polluted plots. The values decreased from 56.96±0.003% in 2.5% concentration level to 44.24± 0.008% in 3.45% level of pollution. The low percentage base saturation is a reflection of the low contents of basic cations due to leaching and activities of microorganisms in the polluted plots. Available P in the soil had the value of 12.0±2.0mg/kg. The P value in the soil was higher than the range of >20 ppm (Bray 1) by Esu et al., (2009) as being very high. Sodium (Na) content in the soil was 0.12± 0.001 cmol/kg. This value is in line with the range of 0.1-0.3 cmol/kg given by Esu et al., (2009) as low. K value in the soil was 0.08±0.0008 cmol/kg. This K value is rated as being very low by Esu et al, (2009) as it falls within the range of <0.2 cmol/kg. Ca content in the soil was 1.23±0.0002 cmol/kg. This value falls within the value of <2 cmol/kg rated as very low by Esu et al. (2009). Mg content in the soil was 1.33±0.002 cmol/kg. The magnesium content was moderate as it falls within the range of 1-3 cmol/kg rated as moderate. Exchangeable acidity in the soil was 2.88±0.0003 cmol/kg. This value is a reflection of the soil reaction which has a pH value of 4.90±0.003 described as very strongly acid. The ECEC was equally very low. This is as a result of the low
- 4. Journal of Biology, Agriculture and Healthcare www.iiste.org ISSN 2224-3208 (Paper) ISSN 2225-093X (Online) Vol.3, No.8, 2013 36 values of basic cations and the exchange acidity. Percent base saturation in the soil was 51.68±1.5%. This value is rated by Esu et al., (2009) as moderate because it is within range of 50-60%. The results in Table 3 show the physic-chemical properties of the soil two weeks after diesel application (2 WAOA). The results in the control plot showed 86.2±0.001% sand, 7.0±0.0% silt and 6.8± 0.001% clay giving rise to loamy sand textural class, the plot polluted with 1.39% concentrations showed 83.6±0.00% clay, giving rise to sandy loam textural class, the plot polluted with 2.5% concentrations level had 85.6±0.003% sand, 7.6±0.002% silt and sand textural class. The plot polluted with 3.45% level of concentration had 85.6±0.002% sand 7.6±0.003% silt and 6.8±0.003% clay giving rise to loamy sand textural class. Similarly, the plot polluted with 5.06% level of concentration had 85.6±0.003% sand, 8.8±0.0025% silt and 5.6±0.002% clay and giving rise to loamy sand textural class. It is observed that the oil did not impart any significant change on the soil separate. Soil reaction showed decreasing pH from the control plot with the pH 4.90±0.002 to the highest pollution level of 5.06% having the pH 4.35±0.005. The decrease in pH in the polluted plots may be as a result of the activities of hydrocarbon degrading microorganisms. This result was earlier observed by Akpan and Ekpo (2006). Total nitrogen in the soil was low decreasing with increased level of diesel oil concentrations. The control plot had 0.05±0.001% and the plot with highest concentration level of 5.06% had 0.03±0.00015% total N. The reason for the low level total N in the soil may be due to immobilization of mineral N by microorganisms and converting it to organic N. Table 4 shows the chemical properties of the soil 18 weeks after diesel oil pollution soil reaction. The result shows varying degree of increase in the pH of the soil with the control plot having the highest pH value of 6.39±0.002 and the least being the highest pollution level (5.06%) with the pH value of 6.05±0.2. This gives rise to the soil reaction of polluted plots being rated as slightly acid (Fig. 1). The reason for the slight increase in pH of the polluted plots 18 weeks after pollution may probably be due to reduction in microbial activities. The difference between the pH values 2WAOA and 18 WAOA is well conceivable in Fig. 1. 3.2 Organic Carbon: There were varying degrees of increase in organic carbon in each of the treatment compared to the control with the least organic carbon content of 2.6±0.001% and the highest being the plot polluted with 3.45% concentration having organic carbon content of 3.69±0.14%. The increase in organic C in the treated soil may be from the hydrocarbon used in polluting the soil. 3.3 Total Nitrogen: There is increased total nitrogen in the soil as the level of diesel oil pollution increases. The plot with 1.39% concentration of diesel had 50% increase in total nitrogen, 2.50% pollution level had 60% increase in total N, while 3.45% and 5.06% levels of concentrations recorded 80% and 70% increase in total nitrogen content of the soil respectively (Fig. 2). The reason for the high increase in total N 18 WAOA may be due to mineralization of N content in the diesel oil or dead degrader may also contributed to the significant increase in the total N. The increase in nitrogen content of the soil after oil pollution was in line with earlier reports by (Odu, 1972, Udo and Fayemi 1975). Odu (1972) reported that the increase in total N may be due to increase in non- symbiotic fixer attracted to the contaminated soils. 3.4 Carbon Nitrogen Ratio: The result shows reduction in carbon nitrogen ratio content of the soil with increased in diesel oil pollution (Fig. 3). The highest concentration level of 5.06% had the least carbon nitrogen ratio of 19.82±1.2 compared with the control with the carbon nitrogen ratio of 26.00±1.2. The reason for the reduction in carbon nitrogen ratio of the polluted plots may be due to concomitant increase in nitrogen content of the soil. Available P, there was increase in available P in all the treatments. The increase may be from the mineralization of diesel oil with phosphorus content of 80mg/kg; or diesel degrading microorganism such as Pseudomonas aeruginosa might have contributed n solubilizing fixed P leading to the release of the nutrient to the soil. 3.5 Calcium content in the soil: There is general increase in Ca in all the treatments at 18 weeks after oil application compared to the control. For example, there is 130.76% increase with 1.39% pollution level, and plot with 2.50% pollution level had 115.38% increase in calcium content compared to the control, while the plots receiving 3.45% and 5.06% pollution levels had 84.615 and 69.92% increases, respectively. The increase in calcium content of the soil may be due to the release of calcium from the diesel (4.8mg/l) as a result of microbes activities on diesel. 3.6 Potassium: The result shows decrease in K content of the soil at 18 WAOA, with increase in diesel oil pollution. The reasons for the decrease may be due to immobilization and leaching of the nutrient. The result similarly showed decrease in Na content of the soil at 18 WAOA in all the treatments. The reason for the decrease in Na content may be due to leaching of nutrient. Exchange acidity: The result shows increase in exchange acidity in all the treatments as compared to the control at 18 WAOA. The reason for increase in EA may be due to leaching of basic cations leading to increase in Al3+ and H+ content of the soil. Effective cations exchange capacity (ECEC). The result shows increase in ECEC content in all the treatments compared to the control. The reason for the increase may be due to the increase observed in EA.
- 5. Journal of Biology, Agriculture and Healthcare www.iiste.org ISSN 2224-3208 (Paper) ISSN 2225-093X (Online) Vol.3, No.8, 2013 37 Percent base saturation (PBS). The result showed increase in percent base saturation in all the treatment at 18 WAOA (Fig. 4). The increase may be because of increase in some of the basic cations. 3.7 Correlation between Concentration of Diesel Oil Pollution and some Selected Soil Properties At 2 weeks after diesel oil pollution The result in Fig. 5 shows the correlation between concentration of diesel oil in the soil and soil reaction (pH). The result shows negative correlation with the correlation coefficient of (r = -0.951). This shows decreased in soil pH as the concentration of diesel oil increases. The reason may be due to increase in acidic metabolites from the microorganisms degrading the diesel oil. This result is in conformity with easier report by Akpan and Ekpo (2005) who observed lower pH near high microbial activities, organic carbon. The result in Fig. 6 shows the correlation between the concentration of diesel oil pollution and organic carbon content. The result shows positive correlation with the correlation coefficient of (r = 0.670). The result indicated increase in organic carbon content as the concentration of diesel oil pollution in the soil increases. This may be due to the addition of hydrocarbon to the soil. Carbon/nitrogen ratio the result in Fig.7 shows the correlation between concentration of diesel oil pollution and the carbon nitrogen ratio in the soil. The result shows positive correlation with the correlation coefficient of (r = 0.863). The reason for this may probably be due to increase in the organic carbon content of the soil due to the added hydrocarbon and the conversion of mineral nitrogen in the soil to organic form. 3.8 Total Nitrogen: The result in Fig. 8 shows the correlation between concentration of diesel oil pollution in the soil and total nitrogen. The result shows negative correlation with the correlation coefficient of (r = 0.848). The result indicated decreased in total nitrogen of the soil as the concentration of diesel oil pollution in the soil increases. The reason for this may be due to the conversion of mineral nitrogen forms in the soil to organic form by microorganisms acting on the diesel oil. 3.9 Percentage Base Saturation The result in Fig. 9 shows the correlation between concentration of diesel oil pollution and the percent base saturation in the soil. The result shows negative correlation with the correlation coefficient of (r = -0.333). The reason for the negative result may be due to leaching of the basic cations and immobilization of the nutrients by microorganisms acting on the hydrocarbon. 3.10 At 18 Weeks after Diesel Oil Pollution The result in Fig. 10 shows the correlation between concentrations of diesel oil pollution and soil reaction (pH). The result shows negative correlation with the correlation coefficient of (r = -0.547). There was increased in pH of the soil in all the pollution levels compared to the result at 2 weeks after pollution. The result in Fig. 11 shows the correlation between concentrations of diesel oil pollution in the soil and the organic carbon content. The result shows positive correlation with the correlation coefficient of (r = 0.593). The result indicated high organic C content due to increasing hydrocarbon. 3.11 Total Nitrogen: The result in Fig. 12 shows the correlation between concentration of diesel oil pollution in the soil and total nitrogen content of the soil. The result shows positive correlation with the correlation coefficient of (r = 0.724). The result shows increased in total nitrogen with increasing concentration levels compared to 2 weeks after oil pollution. This may be due to mineralization of nitrogen in the diesel oil into the soil or the returning of nitrogen back to the soil from dead microorganisms. 3.12 Carbon Nitrogen Ratio The result in Fig. 13 shows correlation between concentration of diesel oil pollution in the soil and carbon nitrogen ratio. The result shows negative correlation with correlation coefficient of (r = -0.596). The reason for this may be due to degradation of the diesel oil applied to the soil and the reduction of microbial activities. The result in Fig. 14 shows the correlation between concentrations of diesel oil pollution and percent base saturation the result shows negative correlation with the correlation coefficient of (r = -0.197). This result shows increased immobilization of basic cations with increasing level of diesel oil in the soil. 4.0 Conclusion The frequent pollution of the Niger Delta environment by hydrocarbon necessitated the study on the effect of diesel oil pollution on the soil properties. The results showed depletion in soil pH giving rise to the soil reaction being rated as strongly acid at 2WAOA. At 2 WAOA show depletion in basic cations (Ca, Mg, Na and K) and increase carbon Nitrogen Ratio. There was significant decline in total N in the soil. At 18 WAOA, the results showed increase in the soil pH with the soil reaction being rated as slightly acid. There was increased in all the basic cations, total N, available P and per cent base saturation. There was reduction in carbon/nitrogen ratio. References Adam, G. & H. J. Duncan (1999). “Effect of diesel fuel on growth of selected plant species”. Environ.
- 6. Journal of Biology, Agriculture and Healthcare www.iiste.org ISSN 2224-3208 (Paper) ISSN 2225-093X (Online) Vol.3, No.8, 2013 38 Geochemistry and Health, 21(5): 353-357. Adam, G. & H. J. Duncan (2002). “Influence of diesel fuel on seed germination”. Environmental Pollution, 20:363-370. Akpan, G. U. & Ekpo, M. A. (2006). “Effect of diesel oil pollution on the physico-chemical Properties and Microbial Pollution of ultisol, Uyo, South-South Nigeria”, Journal of Agriculture, Food and Environment. 3(182):122-126. Bray, R. H. & Kurtz, L. T. (1945). “Determination of total organic and available forms of phosphorus in soils”. Soil Science. Vol. 59, pp. 39-54. Esu, I. E., Akpan-Idiok, A. U., G. A. Ayolaha, & M. Idoko (2009). “Soil Fertility Evaluation in three Southern States (Cross River, Edo and Rivers)”. Consultancy Report. Submitted to the FMAWR, Abuja, 149pp. Gobo, A. E. (1998). “Meteorology and Man’s environment”, Ibadan: African Link Books 101-127. Irwin, R. I., M. Van Moucwerik, L. Stevens, M. D. Seese, & W. Basham (1997). “Environmental Contaminants Encyclopedia”. National Park Service, Water resources Division, Fort Collins, Colorado. Electronic Document on the Internal or NTIS 1998. IITA (1979). “Selected methods for soil and plant analysis”. Manual series No. 1. International Institute of Tropical Agriculture, IITA, Ibadan, Nigeria, 3-39. Jackson, W. L. (1962). “Soil Chemical analysis”. Prentice-Hall, Inc. Englewood, New Jersey, 25-26. Klute, A. (1986). “Method of Soil Analysis. Port I. Physical and Mineralogical properties. No. 9. Monograph”. American Society of Agronomy, Madison, W. I. 502p. Mukherji, S., S. Jagadevan, G. Mohapatra and A. Vijay (2004). “Biodegradation of Diesel oil by an Arabian-Sea Sediment culture isolated from the vicinity of an oil field”. Bioresource Technology, 95: 281-286. Moffat, D. & Lindien, O. (1995). “Perception and Reality”; Assessing priorities for sustainable development in the Niger Delta. Ambio. A Journal of the Human environment. Vol. 24, No. 7-8, 528-530. Murphy, J. & Riley, J. P. (1962). “A modified single solution method for the determination of phosphorus in natural waters”. Analytical Chemistry. Acta 27:31-36. NDES (2003). “Niger Delta environmental survey: phase 1”: Report on the Niger Delta environment, 1-4. Nelson, D. W & Sommers, L. E. (1982). “Total carton, organic carbon and organic matter. In: Page, A. L., Miller R. H. and Keeney, D. R. (eds). Method of soil analysis Part 2”. American Society for Agronomy and soil science society of American. Madison Wiscon Sin, pp. 539-579. Odu, C. T. I. (1972). “Microbiology of Soil Contaminated with petroleum Hydrocarbons”. Journal of the Institute of Petroleum, 58:201-208. Pathak, H., Bhatnagar, K. & Jaroli, D. P. (2011). “Physico-Chemical Properties of Petroleum polluted soil collected from Transport Nagar (Jaipur)”. Indian Journal of Fundamental and Applied Life Sciences. Vol. 1(3): 84-89. Plohl, K. H. L. & Briceij (2002). “Biological degradation of Motor Oil in water”. Acta Chim. Slov, 49: 279-289. Riffaldi, R., R. L. Minizi, R. Cardelli, S., Palumbo & A. Saviozzi (2006). “Soil, biological activities in monitoring the bioremediation of diesel oil contamination soil”. Water, Air, Soil Pollution, 170: 3-15. Rowell, D. L. (1994). “Soil Science Methods and applications”. Longman Scientific and Technical. Singapore. Saddoun, I. (2002). “Isolation and Characterization of bacteria from crude petroleum oil contaminated soil and their potential to degrade diesel fuel”. Journal Basic Microbiology, 6: 422-430. SAS Institute (1990). “SAS/ETS user’s Guide, version 6, 2nd edition”, SAD Institute Inc. Cary, NC. Shrivastava, S. & Gupta, M. (2008). “Study on Diesel Degradation by Acinetobaacter Sp and it’s effect on germination of Medicago Sativa”. Asian Journal Microbiology, Biotechnology and Environmental Science, Vol. 10 No (3): 487-496. Siddiqui, S. & W. A. Adams (2002). “The fate of diesel hydrocarbons and their effect on the germination of perennial ryegrans”. Environmental Toxicology. 17: 49-62. Udo, E. J. & Fayemi, A. A. (1975). “The effect of oil pollution of soil on germination, growth and nutrient uptake of corn (zea mays L.)”. Journal of Environmental Quality, 1:540-547. Wyszkowskwa, J. J., Kucharski & E. Waldowska (2002). “The Influence of diesel oil contamination on soil enzyme activities”. Pollution Journal Environmental Studies, 48: 58-62. Yargodin, B. A. (1982). “Agrochemistry”. Mir Publishers Moscow, USSR. P. 450. Ziad, A. G., I. Saadoun, & Shakah, A. A. (2005). “Selection of Bacteria and Plant seeds for potential use in the remediation of diesel contaminated soils”. Journal of Basic Microbiology. 45: 251-256.
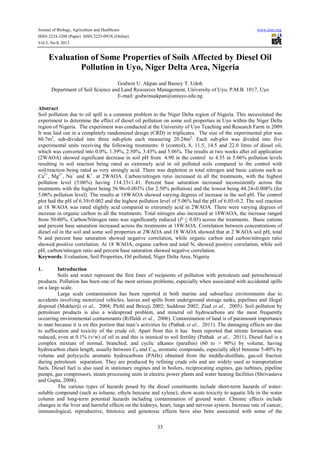
- 7. Journal of Biology, Agriculture and Healthcare www.iiste.org ISSN 2224-3208 (Paper) ISSN 2225-093X (Online) Vol.3, No.8, 2013 39 Table 1: Chemical Content of Diesel Oil Nitrogen 0.15% Organic carbon 13.07% Phosphorus 80mg/kg Calcium 4.8mg/l Magnesium 2.8mg/l Potassium 0.3mg/l Sodium 0.18mg/l Table 2: Physico-Chemical Properties of Soils from the Experimental plot before Pollution with Diesel Dept h Cm Sand % Silt % Clay % pH Total N % Org. C % C/N Av. P Mg/k g Na K Ca Cmol/kg Mg EA ECEC B.S % 20 86±1 .2 6.6±0.0 01 4.8±0.0 02 4.90±0.0 03 0.05±0.00 01 1.37±0.00 06 27.4±0.0 05 120±2 .0 0.12±0.00 01 0.08±0.000 05 1.23±0.00 02 1.33±0.00 02 2.88±0.00 03 5.96±0.00 03 51.68±1 .5 Table 3: Physico-Chemical Properties of Soils from the Experimental plot 2 Weeks after Oil Application (WAOA) Dept h Cm Sand % Silt % Clay % pH Total N % Org. C % C/N Av. P Mg/kg Na K Ca Cmol/k g Mg EA ECEC B.S % After % Oil 0 1.39 2.50 3.45 5.06 86.2±0. 001 83.6±0. 008 85.6±0. 003 85.6±0. 002 85.6±0. 003 7.0±0.0 01 5.6±0.0 1 7.6±0.0 03 7.6±0.0 03 8.8±0.0 025 16.8±0. 001 10.8±0. 02 6.8±0.0 1 6.8±0.0 05 5.6±0.0 02 4.90±0.0 02 4.76±0.0 020 4.74±0.0 012 4.56±0.0 015 4.35±0.0 05 0.05±0.00 010 0.05±0.00 020 0.04±0.00 05 0.03±0.00 12 0.03±0.00 015 2.57±0.0 61 2.15±0.0 05 3.11±0.0 03 3.19±0.0 010 3.43±0.0 050 51.4±1. 0 45.74±1 .2 88.86±2 .0 96.69±1 0 114.33± 14 120±2.0 106.76±0 .20 105.67±0 .12 96.67±0. 03 85.28±0. 05 0.11±0. 011 0.10±0. 010 0.11±0. 011 0.11±0. 011 0.10±0. 010 0.09±0. 005 0.11±0. 01 0.30±0. 02 0.12±0. 04 0.23±0. 03 1.44±0. 001 1.44±0. 001 2.88±0. 001 1.20±0. 002 1.20±0. 002 1.45±0.0 068 1.38±0.0 001 1.15±0.0 002 0.95±0.0 001 0.90±0.0 002 2.76±0.0 068 3.24±0.6 2 3.48±0.0 04 3.00±0.0 1 3.12±0.0 03 5.85±0. 002 6.27±0. 03 7.92±0. 008 5.38±0. 003 5.56±0. 002 52.87±0. 04 48.38±0. 001 56.96±0. 03 44.24±0. 008 44.78±0. 006 Table 4: Effect of Diesel oil on Chemical properties of Soil from the Experimental plot 18 Weeks After Oil Application (18 WAOA) Conc. Of Diesel Oil pH Org. C % Total N % C/N Av. P Mg/kg Ca Mg K Na Cmol/kg EA ECEC B.S % 0 1.39 2.50 3.45 5.06 6.39±0.20 6.1±0.14 6.04±0.18 6.13±0.04 6.05±0.2 2.6±0.014 3.04 ±0.0011 3.53 ±0.0013 3.69±0.04 3.37±0.002 0.10±0.011 0.15±0.001 0.16±0.002 0.18±0.004 0.17±0.005 26.00±1.2 20.27±0.44 22.06±1.5 20.50±0.5 19.82±1.20 120.8±2.5 113±0.58 120±1.4 120±1.4 122±1.0 1.56±0.05 3.6±0.05 3.36±0.01 2.88±0.12 2.64±0.02 1.20±0.025 1.20±0.025 1.08±0.0015 0.80±0.07 0.08±0.002 0.12±0.01 0.04±0.0002 0.07±0.0004 0.04±0.002 0.05±0.0003 0.03±0.01 0.04±0.00019 0.05±0.0063 0.04±0.0019 0.04±0.0019 3.00±0.00085 3.35±0.0017 3.36±0.0016 3.96±0.0014 3.24±0.0012 6.32±0.0005 8.92±0.00025 8.04±0.00002 7.92±0.003 7.60±0.005 52.34±0.00175 56.95±0.01 58.21±0.02 49.97±0.11 49.95±0.011 Concentration of diesel oil in the soil (%) Fig 1: comparing the pH of the soil at 2 weeks and 18 week after oil application 0 1 2 3 4 5 6 7 0 1.39 2.5 3.45 5.06 2 WAOA 18WAOA pHofthesoil
- 8. Journal of Biology, Agriculture and Healthcare www.iiste.org ISSN 2224-3208 (Paper) ISSN 2225-093X (Online) Vol.3, No.8, 2013 40 Concentration of diesel oil in the soil (%) Fig 2: comparing the pH of the soil at 2 weeks and 18 week after oil application Concentration of diesel oil in the soil (%) Fig 3: comparing the C/N ratio of the soil at 2 weeks and 18 week after oil application 0 0.02 0.04 0.06 0.08 0.1 0.12 0.14 0.16 0.18 0.2 0 1.39 2.5 3.45 5.06 2WAOA 18WAOA 0 20 40 60 80 100 120 140 0 1.39 2.5 3.45 5.06 2WAOA 18WAOA TotalN(%)C/NRatio
- 9. Journal of Biology, Agriculture and Healthcare www.iiste.org ISSN 2224-3208 (Paper) ISSN 2225-093X (Online) Vol.3, No.8, 2013 41 Concentration of diesel oil in the soil (%) Fig. 4: comparing the base saturation (%) of the soil at 2 weeks and 18 week after oil application 0 20 40 60 80 100 120 140 0 1.39 2.5 3.45 5.06 2WAOA 18WAOA Basesaturation(%)
- 10. Journal of Biology, Agriculture and Healthcare www.iiste.org ISSN 2224-3208 (Paper) ISSN 2225-093X (Online) Vol.3, No.8, 2013 42
- 11. This academic article was published by The International Institute for Science, Technology and Education (IISTE). The IISTE is a pioneer in the Open Access Publishing service based in the U.S. and Europe. The aim of the institute is Accelerating Global Knowledge Sharing. More information about the publisher can be found in the IISTE’s homepage: http://www.iiste.org CALL FOR PAPERS The IISTE is currently hosting more than 30 peer-reviewed academic journals and collaborating with academic institutions around the world. There’s no deadline for submission. Prospective authors of IISTE journals can find the submission instruction on the following page: http://www.iiste.org/Journals/ The IISTE editorial team promises to the review and publish all the qualified submissions in a fast manner. All the journals articles are available online to the readers all over the world without financial, legal, or technical barriers other than those inseparable from gaining access to the internet itself. Printed version of the journals is also available upon request of readers and authors. IISTE Knowledge Sharing Partners EBSCO, Index Copernicus, Ulrich's Periodicals Directory, JournalTOCS, PKP Open Archives Harvester, Bielefeld Academic Search Engine, Elektronische Zeitschriftenbibliothek EZB, Open J-Gate, OCLC WorldCat, Universe Digtial Library , NewJour, Google Scholar