Contenu connexe Similaire à Environment-Indicators_CTC-Report Similaire à Environment-Indicators_CTC-Report (20) 1.
Planning Research and Analytics
Planning, Development and Legislative Services
Regional Municipality of Waterloo
150 Frederick Street, 8th Floor
Kitchener, ON N2G 4J3
Tel: (519) 575-4400
Fax: (519) 575-4449
Email: planninginfo@regionofwaterloo.ca
Website: www.regionofwaterloo.ca
Central Transit Corridor Monitoring Program
Kitchener-Cambridge-Waterloo
2015 MONITORING REPORT
NOVEMBER 2016
This is an excerpt of the report, to
read the full report visit:
http://www.regionofwaterloo.ca/en/
aboutTheEnvironment/resources/
Monitoring_Change_in_the_CTC__2
015_Report.pdf
2.
ACKNOWLEDGMENTS
LEAD AUTHORS
Margaret Parkin – Manager, Planning Research and Analytics, Community Planning
David Stubbs – Planner, Planning Research and Analytics
Virginia Hang – Student, Planning Research and Analytics
Alexander (AJ) Wray – Student, Planning Research and Analytics
This document could not have been possible without the contribution of the many who participated
in the process.
REGION OF WATERLOO
Michelle Sergi – Director, Community Planning
Amanda Kutler –Manager, Reurbanization
Chris Gosselin – Manager, Environmental Planning
John Lubczynski – Principal Planner, Community Planning
David Roewade – Sustainability Planner, Community Planning
Catherine Heal – Principal Planner, Community Planning
Tim Van Hinte – Principal Planner, Community Planning
Virgil Martin – Planning Information Specialist, Planning Research and Analytics
Rehan Waheed – Planning Data Analyst, Planning Research and Analytics
John Cicuttin – Manager, Transit Services
Blair Allen – Supervisor, Transit Services
Jill Dickinson – Analyst, Transit Services
Andrea Mikkila – Student, Transit Services
Paula Sawicki – Manager, Rapid Transit Coordination
Geoffrey Keyworth – Acting Manager, Transportation Planning
Michelle Pinto – Engineer, Transportation Planning
Pat Fisher – Public Health Planner, Public Health
Jeffrey Schumacher – Supervisor, Housing Supply Initiatives
Judy Maan Miedema – Principal Planner, Housing Services
Angela Hinchberger – Director, Treasury Services and Deputy Treasurer
Julie Bradey – Financial Analyst (Tax Policy), Treasury Services
Lucille Bish ‐ Director, Cultural Services
Kate Hagerman – Specialist, Cultural Heritage Services
Lindsay Benjamin – Cultural Heritage Planner, Cultural Heritage Services
Christiane Sadeler – Executive Director, Waterloo Region Crime Prevention Council
Dianne Heise Bennett – Coordinator, Waterloo Crime Prevention Council
Margaret Gloade – Research Analyst/Planner, Waterloo Regional Police Service
UNIVERSITY OF WATERLOO
Dr. Dawn Parker – Principal Investigator, University of Waterloo
Dr. Jeff Casello – Co‐Investigator, University of Waterloo
Robert Babin – Student Investigator, University of Waterloo
5. i
1. Background
1.1 Summary
The Region of Waterloo has recognized the importance of monitoring change in the Central
Transit Corridor (CTC) over time in order to understand the changing nature of the social,
economic and environmental characteristics of the corridor. The CTC monitoring program is a
multi‐year project to monitor the corridor from the baseline year of 2011 until at least 2021,
after ION has been constructed, opened for service, and is functioning within the community. A
total of 16 baseline indicators were chosen, as well as themed indicators, for their ability to
comprehensively describe key aspects of the corridor. The indicators provide a lens for
monitoring activity in the corridor, as well as the protection of the community’s important
assets, such as heritage resources and affordable housing. Further, through a partnership with
the University of Waterloo, the influence of rapid transit on urban growth and land use changes
is being explored.
1.2 About ION
The idea of a north‐south transportation corridor linking the Region’s three cities began as early
as 1976 when it was identified in the first official plan for the newly formed Region of Waterloo.
In 2000, the Region assumed responsibility for transit, and three years later, included rapid
transit in its Growth Management Strategy. With a mandate from the Province of Ontario to
plan for major population growth and to comply with the Places to Grow Plan (2006), Council
chose to investigate rapid transit to meet the community’s growth and transportation needs.
Years of technical studies and the completion of an extensive public consultation process led to
Council’s decision on June 2011 to approve the implementation of the ION Rapid Transit project
to bring Light Rail Transit (LRT) to Waterloo Region in two stages. In 2014, construction began
on the ION LRT service between Kitchener and Waterloo and on the ION bus rapid transit (BRT)
service, which is the first step towards bringing LRT to Cambridge. At the completion of stage
one, the ION rapid transit system will consist of 19 km of LRT connecting Waterloo to Kitchener,
17 km of BRT between Kitchener and Cambridge, and 23 stops along the 36 km transit corridor.
After the completion of stage one, stage two will see the ION BRT route converted to LRT,
thereby creating a continuous route through Cambridge, Kitchener, and Waterloo. Opening of
ION LRT is scheduled for early 2018.
More information about ION can be found in the Region of Waterloo’s ION Story report:
http://rapidtransit.regionofwaterloo.ca/en/resources/ION_Story_revised_R_0315.pdf; and at
the project website: www.regionofwaterloo.ca/rapidtransit.
Along with ION, GRT will create an efficient, integrated, easy‐to‐use public transit system for all
residents in Waterloo Region. New iXpress routes will be added for convenient crosstown
travel, local bus service will be increased along with improved frequency in neighbourhoods,
7.
21
4. Monitoring the Environment
The environment is one of the dimensions that the CTC Monitoring Program measures as it
represents an important characteristic of the Central Transit Corridor (CTC). In the 2015
Monitoring Report, the Region reported on emissions as an annual indicator for the
environment dimension. As a further exploration of the environment theme, this report will
look at the indicators ‘Trails and Pathways’ and ‘Public Greenspaces’ to describe the state of the
environment in the corridor, and to consider the potential influence of ION on the environment
(Table 1). As part of the Region‐wide transit system, ION can augment trails and pathways in
connecting people to the multi‐modal transportation corridor. However, the presence of ION
and related intensification pressures may place development pressures on the natural
environment within the CTC.
Table 1. Environment Thematic Indicators
Opportunity Dimension Indicator Metric Indicator Value (2015)
Building
Community
Environment
Trails and
Pathways
Length of trails and
pathways in the CTC
78 Kilometres
Public
Greenspaces
Area of public
greenspaces in the CTC
398 hectares
The Region and local area municipalities are planning to integrate transit stations with the trails
and pathways surrounding ION station areas to support a seamless, multi‐modal and low‐
emissions transportation system. Enhancing mobility throughout the Region, greening the CTC,
and enhancing access to the Valley System are among the key opportunities identified in the
Region’s Community Building Strategy. The Region’s Strategic Plan (2015‐18) further identifies
the improvement of environmental sustainability and livability in intensifying urban and rural
settlement areas as a strategic objective.
The local area municipalities have proposed recommendations as part of their station area
planning processes to develop and improve trail connections. Over the next few years, the CTC
will also see the addition of new multi‐use trails along King Street North and Caroline Street
South. Area Municipalities have recently made enhancements to existing trails, and are
planning further improvements to the Iron Horse Trail and Waterloo Park trail network. The
Waterloo Spur Line trail was a recent addition to the trail system.
The two additional indicators in the environment dimension provide data about the current
trails and pathways and public greenspaces in the corridor, which will allow for future review
and assessment of the greening of the corridor.
8.
22
4.1 Environment: Trails and Pathways
Indicator
78 kilometres of trails and pathways were present in the CTC in 2015.
Importance
The Region of Waterloo’s Community Building Strategy identifies the provision of trails and
pathways as an opportunity to enhance mobility throughout the Region, to promote healthy
communities, and to green the corridor. Trails and pathways contribute to enhancing mobility
throughout the Region by linking more origin and destination points that can be travelled by
various modes of active transport. Providing areas for active transport use not only improves
health and quality of life, but also reduces personal vehicle emissions and minimizes air
pollution.
Throughout the CTC, trail and pathway networks can form green corridors encompassing a
variety of parks and conservation areas that are accessible to residential neighbourhoods,
commercial areas, and employment nodes. ION has the potential to connect more people to a
greater network of trails and pathways across the CTC and the Region than ever before. Trails
and pathways that connect to public open greenspaces can support healthy lifestyles by
increasing the physical and mental well‐being of people, as residents are encouraged to
exercise outdoors.
ION can provide an opportunity for residents throughout the CTC to access multiple trail
networks, and conveniently connect to public green spaces and cultural heritage resources
within walking and biking distance from future rapid transit stations. For instance, the Iron
Horse Trail is an established urban greenway that conserves natural, cultural and heritage
landscape values of the Region, and attracts users across a range of activities through all
seasons.
Methodology
The trails and pathways data is obtained from Regional and local area municipality mapping
datasets, which is updated periodically as new infrastructure is added to the regional network.
This indicator measures on and off‐road multi‐use recreational trails that are owned by the
municipal, provincial, and federal governments within the boundaries of the cities of
Cambridge, Kitchener and Waterloo. Trails and pathways that are part of the Region’s
townships as well as unmaintained, private or informal footpaths are excluded in the analysis.
The total length of total trails and pathways that exist within the CTC in 2015 was summed in
kilometres. The density of trails was calculated by dividing the total length of trails in kilometres
9.
23
within the CTC by the total area of the CTC in square kilometres. On‐road cycling lanes were
excluded from this indicator.
Results
The CTC had 78 kilometres of trails and pathways in 2015 with 55 kilometres in stage one and
23 kilometres in stage two. These trails make up 16 per cent of the total length of trails and
pathways that exist within the cities of Cambridge, Kitchener, and Waterloo (Table 1). The three
cities have 475 kilometres of trails and pathways of which 397 kilometres (84 per cent) are
outside the CTC.
Table 1. Length and Percentage of Trails and Pathways
Length (km) Percentage of Total
Stage One 55 10%
Stage Two 23 5%
CTC 78 16%
Outside CTC 397 84%
Cities of Cambridge, Kitchener, Waterloo 475 100%
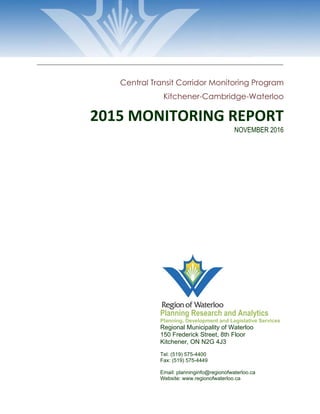
The density of trails is higher in the CTC than outside the CTC. In 2015, for every square
kilometre in stage one, there was approximately 2.2 kilometres of trails, while in stage two,
there were approximately 1.13 kilometres of trails for every square kilometre (Figure 1).
Although there are longer lengths of trails outside the CTC than within, the higher density of
trails within the CTC implies that residents living within the CTC, particularly in stage one, have
access to more trails in their proximity than residents that live outside the CTC.
Figure 1. Density of Trails and Pathways
*Size of various geographic scales used in calculations; stage one: 25 km2
, stage two: 20 km2
, CTC: 45
km2
, outside CTC: 274 km2
, and Tri‐City area( Cities of Cambridge, Kitchener, and Waterloo): 319 km2
2.21
1.13
1.73
1.45
1.49
Stage One
Stage Two
CTC
Outside CTC
Tri-City Area
Density (km/km2)*
Trail and Pathway Density
10.
24
Analysis
Since ION’s announcement, the trail network has increased in length, with the addition of the
Waterloo Spur Line Trail running along 2.5 kilometres of a rail spurline. The Waterloo Spur Line
Trail strengthens connectivity within the CTC by linking Kitchener’s Innovation District, and the
site of the future regional transit hub, with the Trans Canada Trail and the Iron Horse Trail in
Uptown Waterloo.
What does the literature tell us?
A reliable and interconnected network of multi‐use trails could influence a change in travel
behaviour amongst residents living within the CTC. Trails and pathways that connect to parks
and destinations outside the CTC can encourage residents to lead healthier and more active
lifestyles, and in turn lower the usage of private vehicles for short‐term trips.
In an urban environment, large tracts of greenspace are not readily available and are expensive
to maintain and purchase. However, smaller green corridors with trails and pathways can
become convenient and accessible places for recreational activities and connecting to nature
(Gobster, 1995). The prevalence of underutilized railway corridors, waterways, and hydro line
corridors in urban areas are excellent opportunities for beautifying and greening potential
public open spaces (Little, 1990). Trails and pathways can act as green corridors that provide
shade and microclimate in the urban area, and supplement existing greenspaces that connect
to various destinations in the CTC. Furthermore, trails and pathways provide habitat for wildlife,
reduce urban flooding potential, improve water quality, act as a recreation resource, and
contribute to the improvement of local transportation infrastructure (Searns, 1995). Greenways
and trail corridors with natural vegetation can preserve biodiversity by fostering healthy
habitats for forest‐breeding birds in urban areas (Mason et al., 2007). Trails and pathways can
be naturally landscaped with small shrubs and tree canopies to provide areas for sanctuary and
enhanced esthetic qualities. Taylor et al. (1995) identified the importance of establishing urban
greenways that connect nodes of greenspaces via trail and pathway networks to allow residents
to access parks, gardens, and amenities conveniently.
Trails and pathways are a key part of promoting sustainability and lower‐emission intensive
forms of transportation. However, they not only provide direct environmental benefits, but can
contribute to public health, and serve recreational and transportation needs. For example,
Krizek and Johnson (2006) found that the presence of trails and pathways in proximity to
commercial uses is conducive to higher levels of active transportation, as residents are more
likely to walk or cycle to their destination when living within 200 to 400 metres of a trail. Cities
that enhance pedestrian trail infrastructure to allow safe, direct routes from residential to non‐
residential destinations have seen increases in levels of outdoor physical activity at the
12.
26
4.2 Environment: Public Greenspaces
Indicator
398 hectares of public greenspace were present in the CTC in 2015
Importance
The intensification of residential and employment land uses around ION may cause pressures to
develop on open space. Greenspace is an important component of a complete community and
provides multiple environmental and social benefits for people living, working in, or visiting the
CTC. Vegetated spaces remove air pollutants and improve air quality, aid carbon sequestration,
facilitate storm water capture to reduce flooding potential, and add to the Region’s canopy
cover, which helps reduce the urban heat island effect. Greenspaces that are supplemented by
trails can promote healthy and active lifestyles for residents that live in proximity to the
amenity. Many greenspaces in the CTC have become endowed with social and cultural values
and meanings that are special to local residents. Greenspaces provide venues for community
engagement, leisure, gathering, and recreation and social activities. Overall, public open
greenspaces can provide a sense of belonging for different social groups and foster
inclusiveness in a diverse community.
Methodology
This indicator identifies public greenspaces as municipally owned or recognized parks, and
properties owned by the Grand River Conservation Authority. Public greenspaces can include
playgrounds, neighbourhood parks, storm water management ponds, and trails. The data is
collected from datasets maintained by the Cities of Cambridge, Kitchener and Waterloo. For
this analysis, properties were excluded when they had a sole public works or indoor recreation
function (i.e., the Waterloo Recreation Complex), cemeteries, golf courses, and semi‐public
spaces such as schoolyards and post‐secondary institutional land. Greenspaces within the
townships of the Region were not included in the analysis. To calculate the percentage of land
area that is greenspace within stage one and stage two of the CTC, the size of greenspace
within the CTC was divided by the total land area of stage one and stage two respectively. To
calculate percent distribution of greenspace that falls within stage one and stage two of the
CTC, the size of the greenspace is divided by the total area of greenspace within the Cities of
Cambridge, Kitchener, and Waterloo combined.
13.
27
Results
The CTC had a total of 398 hectares (3.98 km2
) of greenspace, with 169 hectares (1.69 km2
) in
stage one, and 229 hectares (2.29 km2
) in stage two. The total greenspace area in the CTC
represents 9 per cent of the total land area of the CTC. It also represents 10 per cent of the
total greenspace area within the Cities of Cambridge, Kitchener, and Waterloo. If we consider
the full extent of greenspaces that are partially within the CTC but also extend beyond the
boundaries of the CTC, then the total area of greenspaces accessible from the corridor totals
502 hectares (5.02 km2
) (Table 1).
Table 1. Public Greenspace
Scale
Land Area
(km2
)
Within CTC Accessible to CTC Greenspace in
Land Area (%)
Distribution of
Greenspace (%) ha km2
ha km2
Stage One 25 169 1.69 212 2.1 7% 4%
Stage Two 20 229 2.29 290 2.9 11% 6%
CTC 45 398 3.98 502 5.0 9% 10%
Outside CTC 274 3,743 37.4 14% 90%
Tri‐City Area 319 4,141 41.4 13% 100%
Analysis
ION will allow residents to travel along the corridor and access an array of public greenspaces,
including those that extend beyond the boundaries of the CTC. The five largest greenspaces
that are accessible to the CTC include:
1. Riverside Park, Cambridge – 92 ha
2. Dumfries Conservation Area (GRCA), Cambridge – 71 ha
3. Waterloo Park, Waterloo – 48 ha
4. Victoria Park, Kitchener – 19 ha
5. Riverside Park (GRCA), Cambridge – 9 ha
These five greenspaces have a combined total of almost 250 hectares, and make up 62 per cent
of the greenspaces in the CTC by size. Large parks often become anchors or nodes in the
greenspace network, with linear parks acting as corridors that connect greenspaces to
residential neighbourhoods, employment areas, and transit options. Each of the downtowns in
the cities of Cambridge, Kitchener, and Waterloo are associated with a large park that serves as
a destination. These large parks offer a multitude of functions that can accommodate a
diversity of social and cultural uses.
14.
28
Table 5. Characteristics of Public Greenspace in the CTC
Size of Greenspace Number of Spaces Total Area
Total
Spaces
Stage One Stage Two Stage One Stage Two CTC CTC
Classification*
Area
(ha)
%
Area
(ha)
% # % # %
Area
(ha)
% # %
Small (< 1ha) 19 5% 9 2% 67 44% 38 25% 28 7% 104 68%
Medium (1‐5 ha) 52 13% 15 4% 24 16% 9 6% 67 17% 33 22%
Large (5‐20 ha) 50 13% 35 9% 6 4% 5 3% 85 21% 12 8%
Significant (> 20ha) 48 12% 170 43% 1 1% 2 1% 218 55% 3 2%
Totals 169 42% 229 58% 98 64% 54 36% 398 100% 152 100%
*Classifications were adapted from Van Herzele and Wiedemann (2003), and Nicol and Blake (2000).
There are a total of 152 unique greenspaces in the CTC ranging in size from small parks to large
conservation areas (Table 5). There are 104 small greenspaces across the CTC that make up 7%
of the CTC’s total greenspace inventory by size, and are typically playgrounds or parkettes
within predominantly residential areas. Medium sized greenspaces make up 17 percent of the
CTC’s total greenspace inventory by size, and include places such as Knollwood Park in
Kitchener, Studiman Park in Cambridge, and Kingscourt Park in Waterloo. Large parks make up
21 per cent of the CTC’s total greenspace inventory by size, and include destinations such as
Victoria Park in Kitchener, Bechtel Park in Waterloo and Gordon Chaplin Park in Cambridge.
What does the literature tell us?
Public greenspaces are valuable to the urban environment as they have the potential to
enhance the quality of life of residents: greenspaces provide escape from sedentary lifestyles,
improve air and water quality, and are catalysts for improving public health. Greenspaces also
cultivate a sense of place by providing venues for relaxation, recreation, and social gatherings.
Arnberger and Eder (2015) found that a person’s preferences towards greenspaces were similar
to their preferences when seeking stress relief, as greenspaces were seen by residents as places
to restore physical and mental well‐being. Furthermore, in an urban environment, greenspaces
close to where people live and work have been identified as places that can fulfill a person’s
desire to relax and connect to the natural environment (Chiesura, 2004; Lanarc, 1995). Burgess
et al (1986) found that residents in London highly valued greenspaces in their communities that
are natural and green, and conducive to a diversity of recreational, social and cultural activities.
In addition, Harrison et al (1986) suggests that greenspaces can effectively provide
environmental services that benefit urban residents in compact communities that are
otherwise found in rural communities.
15.
29
A small neighbourhood park less than a hectare in size will attract significantly less people than
a large city park that is multiple hectares in size (Nicol and Blake, 2000). However, safeguarding
a variety of greenspaces throughout the CTC can accommodate a variety of visitors ranging
from cyclists, parents with children, dog walkers, and older adults to name a few (Harrison and
Burgess, 1988; Van Herzle and Wiedemann, 2003). In addition, residential properties that are
adjacent to an accessibly located, and well designed and managed neighbourhood park can
experience an increase in property value as the area surrounding the greenspace intensifies
(Jim and Chen, 2010). Overall, greenspaces provide multiple benefits such as providing access
to the natural environment, improving public health, supporting active and passive activities,
satisfying socio‐cultural needs, and raising property values.
16.
38
8. References for Environment Theme Indicators
Arnberger, A., and Eder, R. (2015). Are urban visitors’ general preferences for green‐
spaces similar to their preferences when seeking stress relief? Urban Forestry and Urban
Greening, 14: 872‐882.
Blakely, E.J. (2015). The ten elements of great city public spaces. As presented at ICTC
and Main Street Conference 2015: People, Places and Partnerships – Creating Liveable
and Loveable Places. Wollongong, Australia: 22 – 24 July 2015.
Burgess, J., Harrison, C., and Limb, M. (1988). People, parks and the urban green: a
study of popular meanings and values for open spaces in the city. Urban Studies, 25:
455‐473.
Chiesura, A. (2004). The role of urban parks for the sustainable city. Landscape and
Urban Planning, 68: 129‐138.
Fitzhugh, E., Bassett, D., and Evans, M. (2010). Urban trails and physical activity: a
natural experiment. American Journal of Preventive Medicine, 39(3): 259‐262.
Gobster, P.H. (1995). Perception and use of a metropolitan greenway system for
recreation. Landscape and Urban Planning, 33: 401‐413.
Harrison, C., Limb, M., and Burgess, J. (1986). Recreation 2000: views of the country from
the city. Landscape Research, 11: 19‐24.
Harrison, C., and Burgess, J., (1988). Qualitative research and open space policy. The
Planner, 11: pp. 16–18.
Jim, C., and Chen, W. (2010). External effects of neighbourhood parks and landscape
elements on high‐rise residential value. Land Use Policy, 27: 662‐670.
Krizek, K., El‐Geneidy, A., and Thompson, K. (2007). A detailed analysis of how an urban
trail system affects cyclists’ travel. Transportation, 34: 611‐624.
Krizek, K., and Johnson, J. (2006). Proximity to trails and retail: effects on urban cycling
and walking. Journal of the American Planning Association, 72(1): 33‐42.
Lanarc Consulting. (1995). Community Greenways: Linking Communities to Country,
and People to Nature. Ottawa: Canadian Department of Fisheries and Oceans.
Little, C.E. (1990). Greenways for America. Baltimore: John Hopkins University Press.
Mason, J., Moorman, C., Hess, G., and Sinclair, K. (2007). Designing suburban
greenways to provide habitat for forest‐breeding birds. Landscape and Urban Planning,
80: 153‐164.
Nicol, C., and Blake, R. (2000). Classification and use of open space in the context of
increasing urban capacity. Planning Practice and Research, 15: 193–210.
Taylor, J., Paine, C., and FitzGibbon, J. (1995). From greenbelts to greenways: four
Canadian case studies. Landscape and Urban Planning, 33: 47‐64.
Van Herzele, A., and Wiedemann, T. (2003). A monitoring tool for the provision of
accessible and attractive urban spaces. Landscape and Urban Planning 63: 109‐126.