More Related Content
More from Anantha Bellary
More from Anantha Bellary (20)
Annexure
- 1. Annexure:
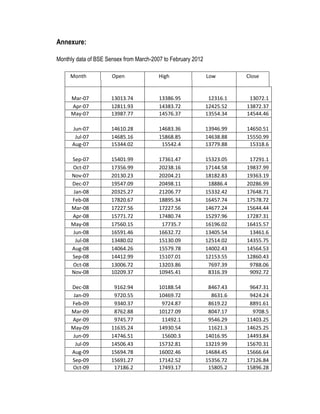
Monthly data of BSE Sensex from March-2007 to February 2012
Month Open High Low Close
Mar-07 13013.74 13386.95 12316.1 13072.1
Apr-07 12811.93 14383.72 12425.52 13872.37
May-07 13987.77 14576.37 13554.34 14544.46
Jun-07 14610.28 14683.36 13946.99 14650.51
Jul-07 14685.16 15868.85 14638.88 15550.99
Aug-07 15344.02 15542.4 13779.88 15318.6
Sep-07 15401.99 17361.47 15323.05 17291.1
Oct-07 17356.99 20238.16 17144.58 19837.99
Nov-07 20130.23 20204.21 18182.83 19363.19
Dec-07 19547.09 20498.11 18886.4 20286.99
Jan-08 20325.27 21206.77 15332.42 17648.71
Feb-08 17820.67 18895.34 16457.74 17578.72
Mar-08 17227.56 17227.56 14677.24 15644.44
Apr-08 15771.72 17480.74 15297.96 17287.31
May-08 17560.15 17735.7 16196.02 16415.57
Jun-08 16591.46 16632.72 13405.54 13461.6
Jul-08 13480.02 15130.09 12514.02 14355.75
Aug-08 14064.26 15579.78 14002.43 14564.53
Sep-08 14412.99 15107.01 12153.55 12860.43
Oct-08 13006.72 13203.86 7697.39 9788.06
Nov-08 10209.37 10945.41 8316.39 9092.72
Dec-08 9162.94 10188.54 8467.43 9647.31
Jan-09 9720.55 10469.72 8631.6 9424.24
Feb-09 9340.37 9724.87 8619.22 8891.61
Mar-09 8762.88 10127.09 8047.17 9708.5
Apr-09 9745.77 11492.1 9546.29 11403.25
May-09 11635.24 14930.54 11621.3 14625.25
Jun-09 14746.51 15600.3 14016.95 14493.84
Jul-09 14506.43 15732.81 13219.99 15670.31
Aug-09 15694.78 16002.46 14684.45 15666.64
Sep-09 15691.27 17142.52 15356.72 17126.84
Oct-09 17186.2 17493.17 15805.2 15896.28
- 2. Nov-09 15838.63 17290.48 15330.56 16926.22
Dec-09 16947.46 17530.94 16577.78 17464.81
Jan-10 17473.45 17790.33 15982.08 16357.96
Feb-10 16339.32 16669.25 15651.99 16429.55
Mar-10 16438.45 17793.01 16438.45 17527.77
Apr-10 17555.04 18047.86 17276.8 17558.71
May-10 17536.86 17536.86 15960.15 16944.63
Jun-10 16942.82 17919.62 16318.39 17700.9
Jul-10 17679.34 18237.56 17395.58 17868.29
Aug-10 17911.31 18475.27 17819.99 17971.12
Sep-10 18027.12 20267.98 18027.12 20069.12
Oct-10 20094.1 20854.55 19768.96 20032.34
Nov-10 20272.49 21108.64 18954.82 19521.25
Dec-10 19529.99 20552.03 19074.57 20509.09
Jan-11 20621.61 20664.8 18038.48 18327.76
Feb-11 18425.18 18690.97 17295.62 17823.4
Mar-11 17982.28 19575.16 17792.17 19445.22
Apr-11 19463.11 19811.14 18976.19 19135.96
May-11 19224.05 19253.87 17786.13 18503.28
Jun-11 18527.12 18873.39 17314.38 18845.87
Jul-11 18974.96 19131.7 18131.86 18197.2
Aug-11 18352.23 18440.07 15765.53 16676.75
Sep-11 16963.67 17211.8 15801.01 16453.76
Oct-11 16255.97 17908.13 15745.43 17705.01
Nov-11 17540.55 17702.26 15478.69 16123.46
Dec-11 16555.93 17003.71 15135.86 15454.92
Jan-12 15534.67 17258.97 15358.02 17193.55
Feb-12 17179.64 18523.78 17061.55 17752.68
- 3. Monthly data of S&P CNX NIFTY from March-2007 to February 2012
Date Open High Low Close
30-Mar-07 3788.85 3832.2 3785.3 3821.55
30-Apr-07 4081.6 4096.9 4028.9 4087.9
31-May-07 4250.25 4306.75 4250.25 4295.8
29-Jun-07 4282.4 4321.35 4280.95 4318.3
31-Jul-07 4444.25 4534.2 4432.85 4528.85
31-Aug-07 4412.6 4471.3 4403 4464
28-Sep-07 4996.45 5055.8 4996.45 5021.35
31-Oct-07 5868.9 5952.25 5861.3 5900.65
30-Nov-07 5633.9 5782.55 5632.65 5762.75
31-Dec-07 6095 6167.75 6095 6138.6
31-Jan-08 5172.25 5251.65 5071.15 5137.45
29-Feb-08 5285 5290.8 5098.35 5223.5
31-Mar-08 4942.15 4947 4703.85 4734.5
30-Apr-08 5198.35 5230.75 5155.85 5165.9
30-May-08 4844.05 4908.85 4833.45 4870.1
30-Jun-08 4136.25 4163 4021.7 4040.55
31-Jul-08 4314.35 4342 4285.55 4332.95
29-Aug-08 4230.6 4368.8 4230.6 4360
30-Sep-08 3848.7 3966.85 3715.05 3921.2
31-Oct-08 2696.3 2921.35 2696.3 2885.6
28-Nov-08 2745.7 2779 2690.3 2755.1
31-Dec-08 2979.8 3002.65 2937.35 2959.15
30-Jan-09 2824.05 2881 2774.1 2874.8
27-Feb-09 2785.7 2787.2 2708.45 2763.65
31-Mar-09 2981.7 3054.3 2966.4 3020.95
29-Apr-09 3371.65 3486.4 3366.7 3473.95
29-May-09 4340.75 4488.05 4340.75 4448.95
30-Jun-09 4391.5 4426.75 4267.35 4291.1
31-Jul-09 4571.6 4669.75 4571.6 4636.45
31-Aug-09 4730.85 4730.85 4635 4662.1
30-Sep-09 5007.65 5087.6 5004.35 5083.95
30-Oct-09 4751.1 4853.65 4687.5 4711.7
30-Nov-09 4942.25 5066.35 4942.25 5032.7
31-Dec-09 5171.2 5221.85 5168.75 5201.05
29-Jan-10 4866.15 4893.7 4766 4882.05
- 4. 26-Feb-10 4858.5 4992 4858.45 4922.3
31-Mar-10 5260.4 5293.9 5235.15 5249.1
30-Apr-10 5254.2 5294.8 5254.2 5278
31-May-10 5076.1 5097.6 5038.55 5086.3
30-Jun-10 5254.25 5320.35 5210 5312.5
30-Jul-10 5408.4 5413.25 5349.2 5367.6
31-Aug-10 5413.55 5413.9 5348.9 5402.4
30-Sep-10 5991.35 6048.45 5963.6 6029.95
29-Oct-10 6021.15 6032.65 5937.1 6017.7
30-Nov-10 5811.6 5892.25 5768.35 5862.7
31-Dec-10 6105.1 6147.3 6103.55 6134.5
31-Jan-11 5452.55 5526.85 5416.65 5505.9
28-Feb-11 5330.15 5477 5308.6 5333.25
31-Mar-11 5803.05 5872 5778.65 5833.75
29-Apr-11 5782.5 5804.3 5706.05 5749.5
31-May-11 5492 5571.6 5489.7 5560.15
30-Jun-11 5614.5 5657.9 5606.1 5647.4
29-Jul-11 5479 5520.3 5453.95 5482
30-Aug-11 4973.25 5016.25 4927.55 5001
30-Sep-11 4990.15 5025.55 4924.3 4943.25
31-Oct-11 5358.9 5360.25 5314.6 5326.6
30-Nov-11 4766.15 4851.55 4754.8 4832.05
30-Dec-11 4659.95 4690.45 4608.9 4624.3
31-Jan-12 5125.25 5215.4 5120.15 5199.25
29-Feb-12 5424.95 5458.8 5352.25 5385.2
- 5. Monthly data of Foreign Institutional Investments from March-2007 to February 2012
Date Equity Debt Total
30-Mar-07 -1,082.00 1,442.60 360.6
30-Apr-07 6,679.20 1,042.30 7,721.50
31-May-07 3,959.70 1,360.10 5,319.80
29-Jun-07 1,643.10 -541.4 1,101.70
31-Jul-07 23,872.40 -1,263.00 22,609.40
31-Aug-07 -7,770.50 608.4 -7,162.10
28-Sep-07 16,132.60 2,655.80 18,788.40
31-Oct-07 20,590.90 2,499.50 23,090.40
30-Nov-07 -5,849.90 -469.3 -6,319.20
31-Dec-07 5,579.10 3,312.00 8,891.10
31-Jan-08 -13,035.70 1,953.80 -11,081.90
29-Feb-08 1,733.30 2,496.80 4,230.10
31-Mar-08 -130.4 -879.7 -1,010.10
30-Apr-08 1,074.80 -1,701.70 -626.9
30-May-08 -5,011.50 -162.9 -5,174.40
30-Jun-08 -10,095.80 -998.7 -11,094.50
31-Jul-08 -1,836.80 3,618.90 1,782.10
29-Aug-08 -1,211.70 1,257.80 46.1
30-Sep-08 -8,278.10 3,204.20 -5,073.90
31-Oct-08 -15,347.30 -1,858.10 -17,205.40
28-Nov-08 -2,598.30 4,215.00 1,616.70
31-Dec-08 1,750.10 626.5 2,376.60
30-Jan-09 -4,245.30 802.3 -3,443.00
27-Feb-09 -2,436.60 -687.8 -3,124.40
31-Mar-09 530.3 -6,420.30 -5,890.00
29-Apr-09 6,508.20 2,490.30 8,998.50
29-May-09 20,117.20 -2,711.40 17,405.80
30-Jun-09 3,830.00 1,068.30 4,898.30
31-Jul-09 11,066.30 2,115.40 13,181.70
31-Aug-09 4,902.70 -379.4 4,523.30
30-Sep-09 18,344.30 2,228.40 20,572.70
30-Oct-09 9,077.00 6,895.60 15,972.60
30-Nov-09 5,497.00 684.4 6,181.40
31-Dec-09 10,233.10 -1,522.40 8,710.70
29-Jan-10 -500.3 8,912.90 8,412.60
26-Feb-10 1,216.90 3,146.10 4,363.00
31-Mar-10 19,928.00 9,509.50 29,437.50
- 6. 30-Apr-10 9,361.30 3,031.80 12,393.10
31-May-10 -9,436.70 2,450.60 -6,986.10
30-Jun-10 10,508.40 740.7 11,249.10
30-Jul-10 16,617.40 8,106.60 24,724.00
31-Aug-10 11,687.20 2,999.10 14,686.30
30-Sep-10 24,978.50 7,689.50 32,668.00
29-Oct-10 28,562.90 -4,260.30 24,302.60
30-Nov-10 18,293.10 2,917.60 21,210.70
31-Dec-10 2,049.60 1,164.20 3,213.80
31-Jan-11 -4813.2 10176.7 5363.5
28-Feb-11 -4,585.50 1,315.70 -3,269.80
31-Mar-11 6,897.80 -14.9 6,882.90
29-Apr-11 7,213.30 -17.2 7,196.10
31-May-11 -6,614.40 2,338.40 -4,276.00
30-Jun-11 4,572.20 311.1 4,883.30
29-Jul-11 8,030.10 2,622.80 10,652.90
30-Aug-11 -10,833.60 2,931.10 -7,902.50
30-Sep-11 -158.3 -1,707.40 -1,865.70
31-Oct-11 1,677.40 1,401.40 3,078.80
30-Nov-11 -4,197.90 934.7 -3,263.20
30-Dec-11 97.9 21,774.60 21,872.50
31-Jan-12 10,357.70 15,971.20 26,328.90
29-Feb-12 25,212.10 10,015.80 35,227.90