Are Asset Class Correlations Increasing?
•
1 like•1,686 views

This article examines the patterns of correlation among the returns of 12 broad investment asset classes over the nine-year time frame from 1993-2011.

Recommended
Recommended
More Related Content
Viewers also liked
Viewers also liked (8)
Recently uploaded
Recently uploaded (20)
Are Asset Class Correlations Increasing?
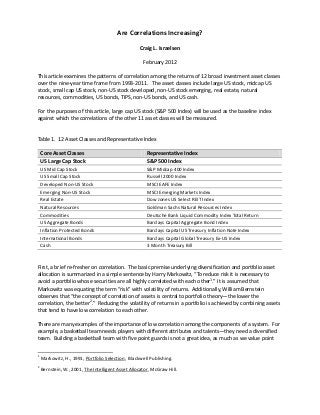
- 1. Are Correlations Increasing? Craig L. Israelsen February 2012 This article examines the patterns of correlation among the returns of 12 broad investment asset classes over the nine-year time frame from 1993-2011. The asset classes include large US stock, midcap US stock, small cap US stock, non-US stock developed, non-US stock emerging, real estate, natural resources, commodities, US bonds, TIPS, non-US bonds, and US cash. For the purposes of this article, large cap US stock (S&P 500 Index) will be used as the baseline index against which the correlations of the other 11 asset classes will be measured. Table 1. 12 Asset Classes and Representative Index Core Asset Classes Representative Index US Large Cap Stock S&P 500 Index US Mid Cap Stock S&P Midcap 400 Index US Small Cap Stock Russell 2000 Index Developed Non-US Stock MSCI EAFE Index Emerging Non-US Stock MSCI Emerging Markets Index Real Estate Dow Jones US Select REIT Index Natural Resources Goldman Sachs Natural Resources Index Commodities Deutsche Bank Liquid Commodity Index Total Return US Aggregate Bonds Barclays Capital Aggregate Bond Index Inflation Protected Bonds Barclays Capital US Treasury Inflation Note Index International Bonds Barclays Capital Global Treasury Ex-US Index Cash 3 Month Treasury Bill First, a brief re-fresher on correlation. The basic premise underlying diversification and portfolio asset allocation is summarized in a simple sentence by Harry Markowitz, “To reduce risk it is necessary to avoid a portfolio whose securities are all highly correlated with each other1.” It is assumed that Markowitz was equating the term “risk” with volatility of returns. Additionally, William Bernstein observes that “the concept of correlation of assets is central to portfolio theory—the lower the correlation, the better2.” Reducing the volatility of returns in a portfolio is achieved by combining assets that tend to have low correlation to each other. There are many examples of the importance of low correlation among the components of a system. For example, a basketball team needs players with different attributes and talents—they need a diversified team. Building a basketball team with five point guards is not a great idea, as much as we value point 1 Markowitz, H., 1991, Portfolio Selection, Blackwell Publishing. 2 Bernstein, W., 2001, The Intelligent Asset Allocator, McGraw Hill.
- 2. guards. A center is needed, as well as several forwards. Because they have different attributes and talents, the correlation between point guards and power forwards is low—and low correlation is what we’re after. Low correlation between the various parts of a system = diversification. The maximum correlation between two parts of a system is +1.00 (or 100%) and the minimum correlation is -1.00 (or -100%). A correlation of +1.0 indicates that the behavior of the two parts is very similar (two twin brothers who both play point guard). A correlation of -1.00 indicates that the two parts behave very differently (a left-handed 6’1” point guard and a right-handed 7’4” center). A correlation of zero indicates that the behavior between the two parts is basically random. As it pertains to investment portfolios, correlation between two assets within a portfolio is measured in the range of -1.0 to +1.0, where -1.0 indicates that the price movement of two assets is perfectly inversely related. When one goes up, the other goes down, and vice versa. A correlation coefficient of zero indicates no correlation between the assets, while a correlation of +1.0 indicates perfect positive correlation. When one goes up, the other goes up. When building investment portfolios we are trying to minimize the number of high correlations (above 0.70) between the various assets in the portfolio. A correlation of 0.70 between two portfolio assets indicates that 70% of their behavior is similar. Myth: All Correlations Went to “1.0” in 2008 As outlined below in Table 2, all correlations did not go to 1.00 in 2008 (as also shown by the red colored bars in Figure 1). In fact, 9 asset classes had equal or higher correlations to the S&P 500 Index in 2011 than in 2008 (noted by yellow highlighting). The figures in Table 2 represent the correlation coefficients between the S&P 500 Index and other 11 indexes (using 12 monthly returns for calendar years 2005, 2008, and 2011). It is correct to say that in 2008 the correlation between large US stock and the other 11 asset classes were higher in all but one asset class (cash) compared to correlations in 2005. Furthermore, in 2011 nine of the 12-month correlations with the S&P 500 Index were higher than in 2008 (the exceptions being US Aggregate Bonds and TIPS). Using 2005 to 2008 and 2008 to 2011 as moments in time, we clearly observe that correlations among various asset classes and the S&P 500 Index have, in most cases, increased. However, saying that correlations “have gone to 1.0” is a different matter. The actual correlation data do not support that statement—particularly when examining the correlations between the S&P 500 and the four fixed income assets (US Bonds, TIPS, non-US bonds, cash). Where correlation has noticeably increased is among the eight equity and equity-like asset classes: large US stock (the base asset against which other assets are correlated), midcap US stock, small cap US stock, non-US stock developed, non-US stock emerging, real estate, natural resources, and commodities. Even so, the 0.80 correlation between large US stock and commodities as of 2011 is still lower than the correlation between large US stock/midcap US stock and large US stock/small cap US stock in any of the past three periods under review (2005, 2008, 2011). The point is that despite the higher correlation between commodities and large US stock, commodities remain a superior diversifier for large US stock than midcap US stock or small cap US stock.
- 3. Table 2. 12-Month Correlation to S&P 500 Index 2005 2008 2011 US Midcap Stock 0.96 0.98 0.98 US Small Cap Stock 0.93 0.96 0.98 Non US Developed Stock 0.60 0.90 0.94 Non US Emerging Stock 0.76 0.84 0.86 US REIT 0.66 0.81 0.93 Natural Resources 0.55 0.68 0.93 Commodities -0.01 0.52 0.80 US Aggregate Bonds -0.19 0.35 -0.35 TIPS -0.35 0.53 0.26 Non US Bonds -0.23 0.08 0.34 US Cash 0.25 0.07 0.18 Figure 1. Correlation of monthly returns with S&P 500 Index over 12-month periods 1.00 0.80 0.60 0.40 0.20 0.00 -0.20 -0.40 -0.60 2005 2008 2011 Let’s now take a longer view of correlation using 36-month periods instead of 12-month periods. In Table 3 we see the correlation between large US stock and the other 11 asset classes over three 36- month periods (2003-2005, 2006-2008, and 2009-2011). The general pattern is clear: correlations have
- 4. increased in recent years in most cases. However, among the four fixed income asset classes the pattern of correlation with large US stock is anything but consistent (shown also in Figure 2). Table 3. 36-month Correlations to S&P 500 Index 2003 - 2005 2006 - 2008 2009 - 2011 US Midcap Stock 0.91 0.95 0.96 US Small Cap Stock 0.88 0.91 0.95 Non US Developed Stock 0.84 0.90 0.93 Non US Emerging Stock 0.74 0.82 0.86 US REIT 0.44 0.76 0.84 Natural Resources 0.45 0.68 0.85 Commodities -0.19 0.44 0.70 US Aggregate Bonds -0.03 0.19 0.00 TIPS -0.01 0.33 0.13 Non US Bonds 0.21 -0.02 0.51 US Cash -0.12 0.49 0.10 Figure 2. Correlation of monthly returns with S&P 500 Index over 36-month periods 1.00 0.80 0.60 0.40 0.20 0.00 -0.20 -0.40 2003 - 2005 2006 - 2008 2009 - 2011
- 5. Finally, it is worthwhile to consider a much longer time frame as it pertains to the correlation between commodities and large US stock. In Figure 3 we observe the rolling 10-year (i.e., 120-month) correlations between large cap US stock and commodities (as represented by the S&P Goldman Sachs Commodity Index) from 1970 to 2011. Form this viewpoint we clearly see that the pattern of correlation between US stock and commodities can fluctuate widely. We have experienced time periods in the past (1980’s) where commodities and US stock had relatively high correlation. We are again in such a period. The important observation is that high correlations do not necessarily persist. So, while it is true that correlation between the S&P 500 Index and many other major asset classes has increased in recent years, it is not necessarily the case that such correlations will stay high going forward. Figure 3. 10-Year Rolling Correlations: 1970-2011 Large US Stock to Commodities 1.00 0.80 0.60 0.40 0.20 0.00 -0.20 -0.40 -0.60 -0.80 -1.00 1990 2006 1979 1980 1981 1982 1983 1984 1985 1986 1987 1988 1989 1991 1992 1993 1994 1995 1996 1997 1998 1999 2000 2001 2002 2003 2004 2005 2007 2008 2009 2010 2011 ------------------------------------------ Craig L. Israelsen, Ph.D. is a professor at Brigham Young University. He is a principal at Target Date Analytics (www.OnTargetIndex.com) and the designer of the 7Twelve Portfolio (www.7TwelvePortfolio.com).