From Luxury Escort Service Kamathipura : 9352852248 Make on-demand Arrangemen...
Axis bank ru2 qfy2011-141010
1. 2QFY2011 Result Update | Banking
October 14, 2010
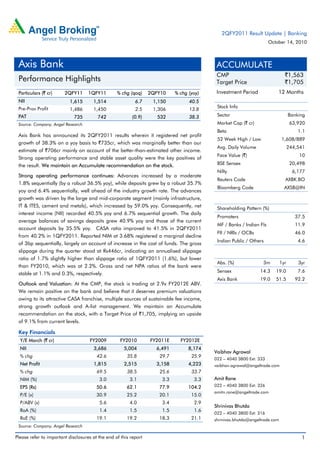
Axis Bank ACCUMULATE
CMP `1,563
Performance Highlights Target Price `1,705
Particulars (` cr) 2QFY11 1QFY11 % chg (qoq) 2QFY10 % chg (yoy) Investment Period 12 Months
NII 1,615 1,514 6.7 1,150 40.5
Pre-Prov Profit Stock Info
1,486 1,450 2.5 1,306 13.8
PAT 735 742 (0.9) 532 38.3 Sector Banking
Source: Company, Angel Research Market Cap (` cr) 63,920
Beta 1.1
Axis Bank has announced its 2QFY2011 results wherein it registered net profit
52 Week High / Low 1,608/889
growth of 38.3% on a yoy basis to `735cr, which was marginally better than our
Avg. Daily Volume 244,541
estimate of `706cr mainly on account of the better-than-estimated other income.
Face Value (`) 10
Strong operating performance and stable asset quality were the key positives of
the result. We maintain an Accumulate recommendation on the stock. BSE Sensex 20,498
Nifty 6,177
Strong operating performance continues: Advances increased by a moderate
Reuters Code AXBK.BO
1.8% sequentially (by a robust 36.5% yoy), while deposits grew by a robust 35.7%
Bloomberg Code AXSB@IN
yoy and 6.4% sequentially, well ahead of the industry growth rate. The advances
growth was driven by the large and mid-corporate segment (mainly infrastructure,
IT & ITES, cement and metals), which increased by 59.0% yoy. Consequently, net Shareholding Pattern (%)
interest income (NII) recorded 40.5% yoy and 6.7% sequential growth. The daily
Promoters 37.5
average balances of savings deposits grew 40.9% yoy and those of the current
MF / Banks / Indian Fls 11.9
account deposits by 35.5% yoy. CASA ratio improved to 41.5% in 2QFY2011
FII / NRIs / OCBs 46.0
from 40.2% in 1QFY2011. Reported NIM at 3.68% registered a marginal decline
Indian Public / Others 4.6
of 3bp sequentially, largely on account of increase in the cost of funds. The gross
slippage during the quarter stood at Rs446cr, indicating an annualised slippage
ratio of 1.7% slightly higher than slippage ratio of 1QFY2011 (1.6%), but lower
Abs. (%) 3m 1yr 3yr
than FY2010, which was at 2.2%. Gross and net NPA ratios of the bank were
Sensex 14.3 19.0 7.6
stable at 1.1% and 0.3%, respectively.
Axis Bank 19.0 51.5 92.2
Outlook and Valuation: At the CMP, the stock is trading at 2.9x FY2012E ABV.
We remain positive on the bank and believe that it deserves premium valuations
owing to its attractive CASA franchise, multiple sources of sustainable fee income,
strong growth outlook and A-list management. We maintain an Accumulate
recommendation on the stock, with a Target Price of `1,705, implying an upside
of 9.1% from current levels.
Key Financials
Y/E March (` cr) FY2009 FY2010 FY2011E FY2012E
NII 3,686 5,004 6,491 8,174
Vaibhav Agrawal
% chg 42.6 35.8 29.7 25.9
022 – 4040 3800 Ext: 333
Net Profit 1,815 2,515 3,158 4,223 vaibhav.agrawal@angeltrade.com
% chg 69.5 38.5 25.6 33.7
NIM (%) 3.0 3.1 3.3 3.3 Amit Rane
EPS (Rs) 50.6 62.1 77.9 104.2 022 – 4040 3800 Ext: 326
amitn.rane@angeltrade.com
P/E (x) 30.9 25.2 20.1 15.0
P/ABV (x) 5.6 4.0 3.4 2.9
Shrinivas Bhutda
RoA (%) 1.4 1.5 1.5 1.6
022 – 4040 3800 Ext: 316
RoE (%) 19.1 19.2 18.3 21.1 shrinivas.bhutda@angeltrade.com
Source: Company, Angel Research
Please refer to important disclosures at the end of this report 1
2. Axis Bank | 2QFY2011 Result Update
Exhibit 1: 2QFY2011 Performance
Particulars (` cr) 2QFY11 1QFY11 % chg (qoq) 2QFY10 % chg (yoy)
Interest earned 3,624 3,326 9.0 2,860 26.7
Interest expenses 2,009 1,812 10.9 1,711 17.4
Net interest income 1,615 1,514 6.7 1,150 40.5
Non-interest income 1,033 1,001 3.2 1,066 (3.0)
Total income 2,648 2,515 5.3 2,215 19.5
Operating expenses 1,162 1,065 9.2 910 27.8
Pre-prov. profit 1,486 1,450 2.5 1,306 13.8
Provisions & cont. 379 333 13.7 499 (24.1)
PBT 1,108 1,117 (0.8) 807 37.3
Prov. for taxes 372 375 (0.7) 275 35.3
PAT 735 742 (0.9) 532 38.3
EPS (Rs) 18.0 18.2 (1.2) 13.2 35.9
Cost-to-income ratio (%) 43.9 42.3 41.1
Effective tax rate (%) 33.6 33.6 34.1
Net NPA (%) 0.3 0.4 0.5
Source: Company, Angel Research
Exhibit 2: 2QFY2011 Actual v/s Estimates
Particulars (` cr) Actual Estimates Var (%)
Net interest income 1,615 1,585 1.9
Non-interest income 1,033 919 12.4
Total income 2,648 2,505 5.7
Operating expenses 1,162 1,117 4.0
Pre-prov. profit 1,486 1,387 7.1
Provisions & cont. 379 318 19.2
PBT 1,108 1,070 3.6
Prov. for taxes 372 364 2.4
PAT 735 706 4.1
Source: Company, Angel Research
Advances and Deposits growth above industry
Advances increased by a moderate 1.8% sequentially (by a robust 36.5% yoy) to
`1,10,593cr, while deposits increased to `1,56,887cr, a robust growth of 35.7%
yoy and 6.4% sequentially, well above the industry growth rate. The advances
growth was driven by the large and mid-corporate segment (mainly infrastructure,
IT and ITES, cement and metals), which increased by ~59.0% yoy. Consequently,
the NII of the bank recorded a growth of 40.5% yoy and 6.7% sequentially.
The deposit growth was driven by the 11.5% qoq growth in current account
balances. The CASA ratio of the bank improved to 41.5% from 40.2% in
1QFY2011, but it was lower than 42.8% registered in 2QFY2010. On the positive
side, the daily average balances of savings deposits grew 40.9% yoy, while those
of the current account deposits grew by 35.5% yoy. Reported NIM at 3.68%,
registered a marginal decline of 3bp on account of increase in cost of funds in the
system as a whole.
October 14, 2010 2
3. Axis Bank | 2QFY2011 Result Update
Exhibit 3: CASA proportion continues to remain strong at above 40%
(%) CA SA
50
40
24
22 24 26
30 21 23 24 24
21
20
10 19 21 20 23
17 17 19 17 17
-
2QFY09
3QFY09
4QFY09
1QFY10
2QFY10
3QFY10
4QFY10
1QFY11
2QFY11
Source: Company, Angel Research; Note: Based on quarter-end numbers
Exhibit 4: NIMs remain flattish sequentially
Reported NIMs (%) Reported Cost of Funds (%)
8.0
6.91
6.64
6.23 6.09
6.0 5.41
4.83 4.61 4.75
4.54
4.0
4.00 4.09
3.51 3.52 3.71 3.68
3.37 3.34
3.12
2.0
2QFY09
3QFY09
4QFY09
1QFY10
2QFY10
3QFY10
4QFY10
1QFY11
2QFY11
Source: Company, Angel Research
Exhibit 5: Advances break-up (2QFY2011)
SME
Agri and
15%
Microfinance
8%
Auto
2%
Housing
14%
Personal
2%
Retail
Others
19%
1%
Large & Mid-
Corporates
58%
Source: Company, Angel Research
October 14, 2010 3
4. Axis Bank | 2QFY2011 Result Update
Reasonable non-interest income growth
Fee income registered 18% yoy growth to `849cr (`719cr) during 2QFY2011, with
strong contribution from the corporate segment. Fee income from large and mid-
corporate credit (including infrastructure) grew 54% yoy, followed by capital
markets (23% yoy), treasury and debt and capital markets (12% yoy) and retail
business (7% yoy). Meanwhile fee income from SME and agricultural lending and
business banking declined by 14% yoy and 4% yoy, respectively.
The bank generated `108cr (`224cr) of trading profits during 2QFY2011, a
decline of 52% yoy.
Exhibit 6: Fee income – Corporate and Retail continue their dominance
Corporate Treasury Agri & SME
(Rs cr)
Business banking Capital markets Retail
900
600
300
-
2QFY09
3QFY09
4QFY09
1QFY10
2QFY10
3QFY10
4QFY10
1QFY11
2QFY11
Source: Company, Angel Research
Asset quality stable
The gross slippage during the quarter stood at `446cr, indicating an annualised
slippage ratio of 1.7% slightly higher than slippage ratio of 1QFY2011 (1.6%) but
lower than that of FY2010, which was at 2.2%. Gross NPAs increased by 1.6%
sequentially to `1,362cr, while net NPAs declined marginally on a sequential basis
by `4cr to `409cr. The NPA provisions were higher sequentially at `321cr in
2QFY2011 v/s `304cr in 1QFY2011. The bank has improved its provision
coverage ratio including technical write-offs from 76.6% in 1QFY2011 to 80.2% in
2QFY2011. Gross and net NPA ratios of the bank were stable at 1.1% and 0.3%,
respectively.
The bank restructured loans aggregating `60cr during 2QFY2011 (Rs30cr in
1QFY2011). The cumulative restructured assets till 2QFY2011, however declined
to `2,061cr (1.7% of gross customer assets) from `2,151cr in 1QFY2011. The
bank restructured ~73% in the large and mid corporate credit, and 17% in the
SME segment, while the balance was restructured in agriculture and capital
markets. A sector-wise analysis by the bank indicates that restructuring of textiles
was the highest at 23%, followed by shipping 22%, sugar, petroleum and real
estate at 8% each.
October 14, 2010 4
5. Axis Bank | 2QFY2011 Result Update
Exhibit 7: Stable NPAs and improving provision coverage
Gross NPA (Rs cr) Net NPA (Rs cr) NPA coverage (%, RHS)
1,600 100.0
80.0
1,200
60.0
800
40.0
400
20.0
- -
2QFY09
3QFY09
4QFY09
1QFY10
2QFY10
3QFY10
4QFY10
1QFY11
2QFY11
Source: Company, Angel Research; Note: Provision coverage excluding technical write-offs till
4QFY2010
Operating expenses rise
Operating expenses were up by 27.8% yoy, with a cost-to-income ratio of 43.9%
(42.3% in 1QFY2011 and 41.1% in 2QFY2010) on account of network expansion
and average wage inflation of ~13-14%.
During 2QFY2011, the bank added another 53 branches (taking the number of
branches opened in 1HFY2011 to 68) and 372 ATMs, taking its network size to
1,103 branches and 4,846 ATMs. The bank plans to open about 200-250
branches in FY2011E.
Exhibit 8: Cost-to-income ratio to remain high Exhibit 9: Network expansion at decent pace
Staff costs Other opex Cost-to-income ratio (RHS) Branches ATMs (RHS)
(` cr) (%) 1,200 6,000
1,400 46 48
45
1,200 44 46 900 4,500
1,000 42 42 44
800 41 41 41 600 3,000
42
600 39
400 40 300 1,500
200 38
- 36 - -
3QFY09
4QFY09
1QFY10
2QFY10
3QFY10
4QFY10
1QFY11
2QFY11
2QFY09
3QFY09
4QFY09
1QFY10
2QFY10
3QFY10
4QFY10
1QFY11
2QFY11
Source: Company, Angel Research Source: Company, Angel Research
Strong capital adequacy
The bank has a healthy capital adequacy ratio of 13.7%, with tier-I capital of 9.8%
at the end of 2QFY2011. The CAR has declined sequentially due to not
considering profit during the quarter in tier-I capital as per the RBI guidelines. If the
profit for 1HFY2011 was included, then CAR would have been 14.6% with tier-I of
10.7%. With leverage (assets/net worth) at 11.3x, the bank is adequately
capitalised to grow its advances at 5% above industry growth over FY2010-12.
October 14, 2010 5
6. Axis Bank | 2QFY2011 Result Update
Investment Arguments
Equity capital increased to support faster market share gains
We believe the bank’s strong capital adequacy positions it for market share gains
as the GDP and capital market activity continue to revive, with at least 500bp
higher growth than industry over FY2010-12. The bank has expanded its network
at 35% CAGR since FY2003 till-date, driving a four-fold increase in CASA market
share to 4.0% by FY2010 (20bp yoy increase in FY2010). In our view, such gains
(30-50bp every year) will continue going forward as well, especially as the network
expansion (200+ additions, about 20-25% yoy) remains strong.
Fee income continues to drive higher RoEs
Fee income contribution across a spectrum of services has been a meaningful
1.9% of assets (almost twice the level in PSBs) over FY2008-10. Further, with
corporate loan growth picking up and capital markets reviving, fee income growth
is also expected to gain traction (30% CAGR over FY2010-12), taking the
contribution to 2.0% of assets by FY2012.
NPA concerns receding
With the improving economic outlook and reducing corporate leverage, NPA
concerns are receding. Sequentially, the slippage rate has broadly been declining
(down from 2.2% in FY2010 to 1.7% in 2QFY2011). We expect NPA
provisions/avg assets to decline to 0.4% by FY2012 from 0.8% in FY2010.
October 14, 2010 6
7. Axis Bank | 2QFY2011 Result Update
Outlook and Valuation
At the CMP, the stock is trading at 2.9x FY2012E ABV. Our Target P/ABV multiple
of 3.2x on FY2012 estimates, is at a 20% discount to our Target P/ABV multiple of
4.0x for HDFC Bank, keeping in mind the relatively higher credit and market risks.
However, we believe that going ahead as Axis Bank establishes a longer and more
credible track record of pricing and managing risks, this gap vis-à-vis HDFC Bank
could narrow down.
We remain positive on the bank and believe that it deserves premium valuations
on account of its attractive CASA franchise, multiple sources of sustainable fee
income, strong growth outlook and A-list management. We maintain an
Accumulate recommendation on the stock, with a Target Price of `1,705, implying
an upside of 9.1% from current levels.
Exhibit 10: Key Assumptions
Earlier Estimates Revised Estimates
Particulars (%)
FY2011E FY2012E FY2011E FY2012E
Credit growth 26.0 27.0 26.0 27.0
Deposit growth 28.0 26.0 28.0 26.0
CASA ratio 46.4 46.2 46.4 46.2
NIMs 3.3 3.3 3.3 3.3
Other income growth 10.8 27.6 12.4 27.6
Growth in staff expenses 22.9 29.2 22.9 29.2
Growth in other expenses 22.9 29.2 22.9 29.2
Slippages 1.5 1.0 1.6 1.1
Coverage ratio 69.4 70.4 70.7 71.8
Treasury gain/(loss) (% of investments) 0.3 0.2 0.3 0.2
Source: Company, Angel Research
Exhibit 11: Change in estimates
FY2011E FY2012E
Particulars (` cr) Earlier Revised Earlier Revised
% chg % chg
estimates estimates estimates estimates
NII 6,491 6,491 - 8,174 8,174 -
Non-interest income 4,179 4,240 1.5 5,333 5,411 1.5
Total income 10,671 10,732 0.6 13,507 13,585 0.6
Operating expenses 4,561 4,561 - 5,891 5,891 -
Pre-prov. profit 6,110 6,171 1.0 7,616 7,695 1.0
Provisions & cont. 1,324 1,386 4.7 1,213 1,297 6.9
PBT 4,786 4,785 (0.0) 6,403 6,398 (0.1)
Prov. for taxes 1,627 1,627 (0.0) 2,177 2,175 (0.1)
PAT 3,159 3,158 (0.0) 4,226 4,223 (0.1)
Source: Company, Angel Research
October 14, 2010 7
11. Axis Bank | 2QFY2011 Result Update
Research Team Tel: 022 - 4040 3800 E-mail: research@angeltrade.com Website: www.angeltrade.com
DISCLAIMER
This document is solely for the personal information of the recipient, and must not be singularly used as the basis of any investment
decision. Nothing in this document should be construed as investment or financial advice. Each recipient of this document should make
such investigations as they deem necessary to arrive at an independent evaluation of an investment in the securities of the companies
referred to in this document (including the merits and risks involved), and should consult their own advisors to determine the merits and
risks of such an investment.
Angel Broking Limited, its affiliates, directors, its proprietary trading and investment businesses may, from time to time, make
investment decisions that are inconsistent with or contradictory to the recommendations expressed herein. The views contained in this
document are those of the analyst, and the company may or may not subscribe to all the views expressed within.
Reports based on technical and derivative analysis center on studying charts of a stock's price movement, outstanding positions and
trading volume, as opposed to focusing on a company's fundamentals and, as such, may not match with a report on a company's
fundamentals.
The information in this document has been printed on the basis of publicly available information, internal data and other reliable
sources believed to be true, but we do not represent that it is accurate or complete and it should not be relied on as such, as this
document is for general guidance only. Angel Broking Limited or any of its affiliates/ group companies shall not be in any way
responsible for any loss or damage that may arise to any person from any inadvertent error in the information contained in this report.
Angel Broking Limited has not independently verified all the information contained within this document. Accordingly, we cannot testify,
nor make any representation or warranty, express or implied, to the accuracy, contents or data contained within this document. While
Angel Broking Limited endeavours to update on a reasonable basis the information discussed in this material, there may be regulatory,
compliance, or other reasons that prevent us from doing so.
This document is being supplied to you solely for your information, and its contents, information or data may not be reproduced,
redistributed or passed on, directly or indirectly.
Angel Broking Limited and its affiliates may seek to provide or have engaged in providing corporate finance, investment banking or
other advisory services in a merger or specific transaction to the companies referred to in this report, as on the date of this report or in
the past.
Neither Angel Broking Limited, nor its directors, employees or affiliates shall be liable for any loss or damage that may arise from or in
connection with the use of this information.
Note: Please refer to the important `Stock Holding Disclosure' report on the Angel website (Research Section). Also, please
refer to the latest update on respective stocks for the disclosure status in respect of those stocks. Angel Broking Limited and
its affiliates may have investment positions in the stocks recommended in this report.
Disclosure of Interest Statement Axis Bank
1. Analyst ownership of the stock No
2. Angel and its Group companies ownership of the stock No
3. Angel and its Group companies' Directors ownership of the stock No
4. Broking relationship with company covered No
Note: We have not considered any Exposure below Rs 1 lakh for Angel, its Group companies and Directors.
Ratings (Returns): Buy (> 15%) Accumulate (5% to 15%) Neutral (-5 to 5%)
Reduce (-5% to 15%) Sell (< -15%)
October 14, 2010 11