SlideShare a Scribd company logo
1 of 10
Download to read offline
1QFY2011 Result Update | Capital Goods
                                                                                                                          August 4, 2010


 KEC International                                                                           BUY
                                                                                             CMP                                  Rs488
 Performance Highlights                                                                      Target Price                         Rs648
  Y/E March (Rs cr)        1QFY11        1QFY10      %chg (yoy)     4QFY10 %chg (qoq)        Investment Period              12 Months
  Net Sales                     846           727           16.4     1,356      (37.6)
                                                                                             Stock Info
  EBITDA                         85            87           (2.2)      140      (39.7)
  EBITDA (%)                   10.0          11.9       (190bp)        10.3    (30bp)        Sector                       Capital Goods
  PAT                            26            39         (32.6)        67      (61.0)       Market Cap (Rs cr)                    2,510
 Source: Company, Angel Research                                                             Beta                                    0.5
                                                                                             52 Week High / Low               640/416
 KECโ€™s 1QFY2011 performance was significantly impacted by the inclusion of
 erstwhile RPG Cables operations. Notably, the numbers are not directly                      Avg. Daily Volume                    12,895
 comparable on account of the merger of RPG cables with KEC during March                     Face Value (Rs)                          10
 2010. Post the merger, the company reported 16.4% yoy increase in revenues,
                                                                                             BSE Sensex                           18,217
 while EBDITA margins dipped to 10% and PAT dropped by 32.6% for 1QFY2011.
 We maintain a Buy on the stock.                                                             Nifty                                 5,468

 Merger hangover impacts profitability: Revenue growth of 16.4% yoy to Rs 846cr              Reuters Code                     KECL.BO
 (Rs727cr) during 1QFY2011 was in line with our expectations. It may be noted                Bloomberg Code                   KECI@IN
 that 1QFY2011 revenues also include Rs88cr from the erstwhile RPG Cables. The
 company reported the 190bp dip in EBDITA margins due to of inclusion of the
 low-margin cable business. Interest cost increased by 21.4% yoy to Rs26cr                   Shareholding Pattern (%)
 (Rs22cr) for 1QFY2011, reflecting the takeover of debts related to RPG Cables.
 Similar reasons may also be attributed to the increase in depreciation by 47.5%             Promoters                              41.7
 yoy to ~Rs9cr (Rs6cr). Tax expenses also included Rs8.1cr relating to the prior             MF / Banks / Indian Fls                41.3
 period tax liabilities on the international projects. The cumulative impact of the          FII / NRIs / OCBs                       6.0
 above led to PAT dropping by 32.6% yoy to Rs26cr (Rs39cr) for 1QFY2011.
 Excluding the impact of the additional tax expense, PAT fell 12.5% yoy to Rs34cr.           Indian Public / Others                 11.0

 Outlook and Valuation: The transmission EPC companies have been riding high
 on back of the ongoing investments in the domestic power sector. As on date,
 Indiaโ€™s largest power transmission utility, PGCIL, has spent ~ 46% of its planned           Abs. (%)               3m      1yr      3yr
 capex of Rs55,000cr during the first three years of the Eleventh Plan. We expect            Sensex                 6.3   15.1      20.3
 PGCIL to accelerate its capex schedule over the next two years, leading to higher
                                                                                             KEC                  (8.4)     2.4    (20.0)
 order inflows for transmission EPC companies like KEC. Improving order visibility
 from PGCIL and other state utilities is expected to help KEC boost its existing
 Rs5,650cr order book. At the CMP, the stock trades at 11.6x and 9.8x FY2011E
 and FY2012E EPS, respectively. We maintain a Buy on the stock, with a Target
 Price of Rs648.

 Key financials (Consolidated)
  Y/E March (Rs cr)                     FY2009        FY2010        FY2011E   FY2012E
  Net Sales                               3,427         3,877         4,563      5,223
  % chg                                    21.8          13.1          17.7       14.5
  Net Profit                                116           171           216        256
  % chg                                   (32.5)         47.0          26.1       18.8
  EBITDA (%)                                8.8           9.9          10.0       10.0
  EPS (Rs)                                 22.6          33.3          41.9       49.8
  P/E (x)                                  21.8          14.8          11.6        9.8
  P/BV (x)                                  4.5           3.6           2.9        2.3
  RoE (%)                                  22.3          27.3          27.6       26.2
  RoCE (%)                                 16.1          17.0          18.5       18.9
                                                                                            Hemang Thaker
  EV/Sales (x)                              1.0           0.9           0.8        0.7      022-40403800 Ext: 342
  EV/EBITDA (x)                            11.2           9.3           7.8        6.7      hemang.thaker@angeltrade.com
 Source: Company, Angel Research
Please refer to important disclosures at the end of this report                                                                        1
KEC International | 1QFY2011 Result Update


Exhibit 1: 1QFY2011 Performance (Consolidated)
Y/E March (Rs cr)                 1QFY2011   1QFY2010         yoy (%)   4QFY2010             qoq (%)    FY2010     FY2009       yoy (%)
Net Sales                              846        727           16.4        1,356             (37.6)     3,907       3,429        14.0
Raw Material                           414        325           27.4             781          (47.0)     2,013       1,976         1.9
(% of Net Sales)                      48.9        44.7                           57.6                     51.5           57.6
Erection & Sub contracting             209        222           (5.9)            284          (26.4)      958            575      66.6
(% of Net Sales)                      24.7        30.5                       20.9                         24.5           16.8
Employee Cost                           48          38          26.3              45             6.4      169            142      18.9
(% of Net Sales)                       5.7         5.2                            3.3                      4.3            4.1
Other Expenses                          90          55          63.8             106          (14.4)      371            341       8.7
(% of Net Sales)                      10.7         7.6                            7.8                      9.5           10.0
Total Expenditure                      761        640           18.9        1,216             (37.4)     3,511       3,034        15.7
EBITDA                                  85          87          (2.2)            140          (39.7)      396            395       0.4
EBITDA (%)                            10.0        11.9                       10.3                         10.1           11.5
Interest                                26          22          21.4              19            36.2       87            100     (13.5)
Depreciation                             9             6        47.5               7            28.6       27             23      17.4
Other Income                             0         0.0                            0.6                       1              1      66.7
Profit before Tax                       49          59         (16.1)            114          (56.8)      284            272       4.3
(% of Net Sales)                       5.8         8.1                            8.4                      7.3            7.9
Total Tax                               23          20          16.2              47          (50.9)      100             94       6.4
(% of PBT)                            46.8        33.8                           41.1                     35.2           34.5
Adjusted PAT                           26          39          (32.6)             67          (61.0)      184            178       3.1
(% of Net Sales)                       3.1         5.3                            4.9                     4.7            5.2
Extraordinary items                      -             -                          (5)                       6            (61)   (109.8)
Reported PAT                            26          39         (32.6)             72          (63.6)      190            117      62.3
Source: Company, Angel Research

                                               Order backlog: The companyโ€™s order intake for the quarter was ~Rs1,000cr.
                                               Order backlog at the end of 1QFY2011 stood at Rs5,650cr equally split across the
                                               reporting geographies of International and South Asia. Of the total order backlog,
                                               transmission accounted for 76%, distribution & substation 18%, railways 4% and
                                               cables 2%.

                                               Exhibit 2: Order book (Rs cr)
                                               Particulars                              International      South Asia             Total
                                               Transmission                                   2,461              1,811           4,272
                                               Distribution                                     316               699            1,015
                                               Railway                                            30              217             247
                                               Cable                                                -             113             113
                                               Telecom                                              -               3                3
                                               Total                                          2,807              2,843           5,650
                                               Source: Company, Angel Research

                                               Capex guidance: KEC intends to spend ~ Rs100cr on its tower business in the
                                               current fiscal. Capex planned for the cable plant at Vadodara is ~Rs120cr over
                                               the next two years. Management expects the Vadodara facility to commence
                                               production from FY2012E generating ~Rs400cr in revenues with EBDITA margins
                                               of ~7-8%


August 4, 2010                                                                                                                        2
KEC International | 1QFY2011 Result Update


                 Investment Arguments

                 Huge opportunity for transmission EPC players: The government has envisaged
                 investment of Rs140,000cr in the transmission segment during the Eleventh plan,
                 an increase of over two times from the investments made in the Tenth Plan. The
                 scale gets even bigger for the Twelfth Plan, with planned investment of around
                 Rs240,000cr. As per our estimates, this had opened up a potential US $14-15bn
                 opportunity for the transmission EPC players during the Eleventh Plan period
                 alone. Besides, Power Grid Corporation of India (PGCIL), India's largest
                 transmission utility, having spent only ~46% of its planned capex of Rs 55,000cr
                 during the first three years of the Eleventh Plan, is all set to accelerate its capex
                 during the remaining two years, which in turn, would translate into higher order
                 inflows for the transmission EPC sector.

                 Overseas orders to improve: KEC has a Strong international presence across
                 geographies compared to its domestic peers who have generally restricted
                 themselves to local operations. Notably, the company has executed large number
                 of T&D projects in over forty countries. With its footprint spread across continents,
                 KEC is adequately hedged against slow-down in any particular region. On the
                 other hand, any delay or deferment in the release of domestic T&D orders would
                 adversely impact the revenue projections of many domestic EPC companies.
                 Amidst such a scenario, we believe that KEC would be the least impacted owing to
                 its high exposure to international orders.

                 Diversification into railways and telecom sectors a major positive: KEC has forayed
                 into the telecom and railway sectors. Although these divisions currently account for
                 small portion of the company's total revenues, future prospects of the segments are
                 very bright. KEC also plans to enter tracking, signaling and platform construction
                 works in the railway segment.

                 Outlook and Valuation: The transmission EPC companies have been riding high
                 on back of the ongoing investments in the domestic power sector. As on date,
                 Indiaโ€™s largest power transmission utility, PGCIL, has spent ~ 46% of its planned
                 capex of Rs55,000cr during the first three years of the Eleventh Plan. We expect
                 PGCIL to accelerate its capex schedule over the next two years, leading to higher
                 order inflows for transmission EPC companies like KEC. Improving order visibility
                 from PGCIL and other state utilities is expected to help KEC boost its existing
                 Rs5,650cr order book. At the CMP, the stock trades at 11.6x and 9.8x FY2011E
                 and FY2012 EPS, respectively. We maintain a Buy on the stock, with a Target Price
                 of Rs648.


                 Exhibit 3: Actual v/s Angel estimates โ€“ 1QFY2011
                 Particulars (Rs cr)                           Actual        Estimates        Var (%)
                 Revenues                                        846              844             0.2
                 Operating Profit                                 85               85               -
                 PAT                                              26               35          (25.7)
                 EPS (Rs)                                        5.1               6.9         (26.1)
                 Source: Company, Angel Research


August 4, 2010                                                                                      3
KEC International | 1QFY2011 Result Update


                 Exhibit 4: Angel EPS Forecast v/s Consensus
                 Year                             Angel forecast (Rs) Bloomberg consensus (Rs)                        Var (%)
                  FY2011E                                          41.9            40.1                                      4.4
                 FY2012E                                           49.8            49.6                                      0.4

                 Source: Bloomberg, Angel Research


                 Exhibit 5: Key assumptions
                 Particulars                                                         FY2011E                        FY2012E
                 Order Inflow (Rs cr)                                                     5,111                           5,878
                 Order Inflow Growth (%)                                                    20.0                           15.0
                 Order Backlog (Rs cr)                                                    5,995                           6,589
                 Order Backlog Growth (%)                                                      9.0                         10.0
                 Order Book to Sales (%)                                                    43.5                           44.5
                 Source: Company, Angel Research


                 Exhibit 6: One-year forward P/E band
                   1,000

                     800

                     600

                     400

                     200

                        0
                                                                                          Jan-09


                                                                                                                           Jul-10
                            Apr-06


                                                          Aug-07
                                         Dec-06


                                                                          May-08


                                                                                                           Oct-09

                                     Share Price (Rs)                6x            10x               14x            18x


                 Source: Company, Angel Research


August 4, 2010                                                                                                                      4
KEC International | 1QFY2011 Result Update


Exhibit 7: Peer Valuation
                                              CMP      Tgt Price    Upside   FY2012E     FY2012E    FY2010-12E    FY2012E    FY2012E
Company                       Reco                                                                    EPS CAGR
                                                (Rs)        (Rs)       (%)    P/BV (x)     P/E(x)                 RoCE (%)    RoE (%)
                                                                                                            (%)
ABB*                        Neutral            788              -        -        4.9       25.8           35.3      22.3       20.8
Areva T&D*                      Sell           289              -        -        6.0       29.2          11.3       17.6       22.2
BHEL                        Neutral          2,518              -        -        5.0       19.4          21.5       30.4       28.6
BGR Energy                  Neutral            768                                4.8       16.0            31       17.7       33.6
Crompton Greaves       Accumulate              281         307         9.3        4.5       18.2            7.2      27.1       27.3
Jyoti Structures                Buy            154         215       39.6         1.8        9.3          21.4       19.3       20.6
KEC International               Buy            488         648       32.8         2.3        9.8          22.3       18.9       26.2
Thermax                     Neutral            771              -        -        5.5       20.6          30.9         31       29.5
Source: Company, Angel Research. Note: *December year ending.


August 4, 2010                                                                                                                      5
KEC International | 1QFY2011 Result Update


                 Profit and Loss statement (Consolidated)
                 Y/E March (Rs cr)         FY2007 FY2008 FY2009      FY2010 FY2011E FY2012E
                 Net Sales                  2,041   2,814   3,427     3,877   4,563   5,223
                 Other operating
                                                -       -        -        -       -       -
                 income
                 Total operating income     2,041   2,814   3,427     3,877   4,563   5,223
                 % chg                       18.1    37.9    21.8      13.1    17.7    14.5
                 Total Expenditure          1,789   2,460   3,127     3,492   4,109   4,703
                 Net Raw Materials           929    1,415   1,976     2,011   2,389   2,734
                 Other Mfg costs             764     924    1,010     1,312   1,528   1,750
                 Personnel                    95     121      142      168      192     219
                 Other                          -       -        -        -       -       -
                 EBITDA                      252     354     300       386      454     520
                 % chg                       55.2    40.7   (15.2)     28.5    17.7    14.5
                 (% of Net Sales)            12.3    12.6     8.8       9.9    10.0    10.0
                 Depreciation&
                                              33      25       23       26       31      34
                 Amortisation
                 EBIT                        218     329     278       359      423     486
                 % chg                       61.4    50.7   (15.7)     29.5    17.7    14.9
                 (% of Net Sales)            10.7    11.7     8.1       9.3     9.3     9.3
                 Interest & other
                                              59      68      100       87      103     105
                 Charges
                 Other Income                  1       0        0        1        1       2
                 (% of PBT)                   0.4     0.1     0.2       0.4     0.4     0.4
                 Others                         -       -        -        -       -       -
                 Recurring PBT               160     262     178       274      322     382
                 % chg                       89.4    63.8   (32.1)     54.0    17.5    18.8
                 Extraordinary
                                                -       -        -        -       -       -
                 Expense/(Inc.)
                 PBT (reported)              160     262     178       274      322     382
                 Tax                         55.2    89.7    61.5     103.0   106.2   126.2
                 (% of PBT)                  34.5    34.3    34.6      37.6    33.0    33.0
                 PAT (reported)              105     172     116       171      216     256
                 Add: Share of earnings
                                                -       -        -        -       -       -
                 of associate
                 Less: Minority interest
                                                -       -        -        -       -       -
                 (MI)
                 Prior period items             -       -        -        -       -       -
                 PAT after MI (reported)     105     172     116       171      216     256
                 ADJ. PAT                    105     172     116       171      216     256
                 % chg                      112.3    64.5   (32.5)     47.0    26.1    18.8
                 (% of Net Sales)             5.1     6.1     3.4       4.4     4.7     4.9
                 Basic EPS (Rs)               28      35       24       33       42      50
                 Fully Diluted EPS (Rs)       20      33       23       33       42      50
                 % chg                       89.4    63.8   (32.1)     54.0    17.5    18.8


August 4, 2010                                                                            6
KEC International | 1QFY2011 Result Update


                 Balance Sheet (Consolidated)
                 Y/E March (Rs cr)           FY2007 FY2008 FY2009 FY2010 FY2011E FY2012E
                 SOURCES OF FUNDS
                 Equity Share Capital           38      49      49      51      51      51
                 Preference Capital             13      10        -       -       -       -
                 Reserves& Surplus             221     435     509     644     818    1,032
                 Shareholders Funds            272     495     559     696     869    1,083
                 Minority Interest                -       -       -       -       -       -
                 Total Loans                   386     592     622     772     752     752
                 Deferred Tax Liability         29      20      30      30      30      30
                 Total Liabilities             687    1,107   1,210   1,497   1,651   1,865
                 APPLICATION OF FUNDS
                 Gross Block                   464     518     622     729     801     871
                 Less: Acc. Depreciation        60      90     122     148     179     213
                 Net Block                     404     428     500     581     622     658
                 Capital Work-in-Progress        2      19      51      19      18      18
                 Goodwill                        4       4       4       4       4       4
                 Investments                    21       0       2       2       2       2
                 Current Assets               1,248   1,973   2,540   2,648   3,246   3,449
                 Cash                           21      68     137      65     102     140
                 Loans & Advances              172     270     327     368     433     496
                 Other                            -       -       -       -       -       -
                 Current liabilities           991    1,317   1,886   1,756   2,240   2,265
                 Net Current Assets            257     656     654     892    1,006   1,184
                 Mis. Exp. not written off        -       -       -       -       -       -
                 Total Assets                  687    1,107   1,210   1,497   1,651   1,865


August 4, 2010                                                                            7
KEC International | 1QFY2011 Result Update


                 Cash Flow statement (Consolidated)
                 Y/E March (Rs cr)            FY07    FY08    FY09    FY10    FY11E   FY12E
                 Profit before tax             160     262     178     274     322     382
                 Depreciation                   33      25      23      26      31      34
                 (Inc)/Dec in Working
                                              (209)   (353)     71    (310)    (77)   (140)
                 Capital
                 Less: Other income              1       0       0       1       1       2
                 Direct taxes paid              46      83      52     103     106     126
                 Cash Flow from
                                               (62)   (149)    219    (114)    168     148
                 Operations
                 (Inc.)/Dec.in Fixed Assets    (14)    (70)   (137)    (75)    (70)    (70)
                 (Inc.)/Dec. in Investments     (0)     20      (1)       -       -       -
                 Other income                    1       0       0       1       1       2
                 Cash Flow from Investing      (13)    (50)   (138)    (74)    (69)    (68)
                 Issue of Equity                  -     (4)    (15)       -       -       -
                 Inc./(Dec.) in loans           54     205      30     150     (20)       -
                 Dividend Paid (Incl. Tax)      20      29      29      36      42      42
                 Others                         (0)     73       0       2        -       -
                 Cash Flow from
                                                34     173     (14)    114     (62)    (42)
                 Financing
                 Inc./(Dec.) in Cash           (42)     47      69     (72)     37      38
                 Opening Cash balances          64      21      68     137      65     102
                 Closing Cash balances          21      68     137      65     102     140


August 4, 2010                                                                           8
KEC International | 1QFY2011 Result Update


                 Key Ratios
                 Y/E March               FY2007   FY2008 FY2009    FY2010 FY2011E FY2012E
                 Valuation Ratio (x)
                 P/E (on FDEPS)            24.2     14.7    21.8     14.8    11.6     9.8
                 P/CEPS                    18.4     12.9    18.2     12.9    10.3     8.7
                 P/BV                       9.8      5.2     4.5      3.6     2.9     2.3
                 Dividend yield (%)         0.9      1.0     1.0      1.2     1.4     1.4
                 EV/Sales                   1.4      1.1     0.9      0.8     0.7     0.6
                 EV/EBITDA                 11.5      8.6    10.1      8.4     7.0     6.1
                 EV/Total Assets            4.2      2.8     2.5      2.2     1.9     1.7
                 Per Share Data (Rs)       27.8     34.9    23.6     33.3    41.9    49.8
                 EPS (Basic)               20.4     33.5    22.6     33.3    41.9    49.8
                 EPS (fully diluted)       26.9     38.4    27.0     38.4    47.9    56.4
                 Cash EPS                   4.5      5.0     5.0      6.0     7.0     7.0
                 DPS                       50.4     94.3   108.6    135.3   169.0   210.6
                 Book Value                24.2     14.7    21.8     14.8    11.8     9.9
                 Dupont Analysis
                 EBIT margin (%)           10.7     11.7     8.1      9.3     9.3     9.3
                 Tax retention ratio        0.7      0.7     0.7      0.6     0.7     0.7
                 Asset turnover (x)         3.6      3.3     3.2      3.1     3.1     3.2
                 ROIC (Post-tax) (%)       25.0     25.4    17.2     17.9    19.0    19.9
                 Cost of Debt (Post
                                           10.8      9.1    10.8      7.8     9.0     9.4
                 Tax) (%)
                 Leverage (x)               1.4      1.1     0.9      1.0     0.7     0.6
                 Operating RoE (%)         45.1     43.0    22.7     28.2    26.5    25.8
                 Returns (%)
                 RoCE (Pre-tax)            35.6     36.7    24.0     26.6    26.9    27.7
                 Angel RoIC (Pre-tax)      38.8     39.3    27.3     29.6    28.8    30.1
                 RoE                       48.3     46.3    22.3     27.3    27.6    26.2
                 Turnover ratios (x)
                 Asset Turnover (Gross
                                            4.5      5.7     6.0      5.7     6.0     6.2
                 Block)
                 Inventory / Sales
                                            25       23      23       24      22       21
                 (days)
                 Receivables (days)        142      151     175      178     175      172
                 Payables (days)            71       74      92       86      83       81
                 Working capital cycle
                                            42       76      55       78      72       73
                 (ex-cash) (days)
                 Solvency ratios (x)
                 Net debt to equity         1.4      1.1     0.9      1.0     0.7     0.6
                 Net debt to EBITDA         1.4      1.5     1.6      1.8     1.4     1.2
                 Interest Coverage
                                            3.7      4.9     2.8      4.2     4.1     4.6
                 (EBIT / Interest)


August 4, 2010                                                                          9
KEC International | 1QFY2011 Result Update


  Research Team Tel: 022 - 4040 3800               E-mail: research@angeltrade.com                   Website: www.angeltrade.com

  DISCLAIMER

 This document is solely for the personal information of the recipient, and must not be singularly used as the basis of any investment
 decision. Nothing in this document should be construed as investment or financial advice. Each recipient of this document should make
 such investigations as they deem necessary to arrive at an independent evaluation of an investment in the securities of the companies
 referred to in this document (including the merits and risks involved), and should consult their own advisors to determine the merits and
 risks of such an investment.

 Angel Broking Limited, its affiliates, directors, its proprietary trading and investment businesses may, from time to time, make
 investment decisions that are inconsistent with or contradictory to the recommendations expressed herein. The views contained in this
 document are those of the analyst, and the company may or may not subscribe to all the views expressed within.

 Reports based on technical and derivative analysis center on studying charts of a stock's price movement, outstanding positions and
 trading volume, as opposed to focusing on a company's fundamentals and, as such, may not match with a report on a company's
 fundamentals.

 The information in this document has been printed on the basis of publicly available information, internal data and other reliable
 sources believed to be true, but we do not represent that it is accurate or complete and it should not be relied on as such, as this
 document is for general guidance only. Angel Broking Limited or any of its affiliates/ group companies shall not be in any way
 responsible for any loss or damage that may arise to any person from any inadvertent error in the information contained in this report.
 Angel Broking Limited has not independently verified all the information contained within this document. Accordingly, we cannot testify,
 nor make any representation or warranty, express or implied, to the accuracy, contents or data contained within this document. While
 Angel Broking Limited endeavours to update on a reasonable basis the information discussed in this material, there may be regulatory,
 compliance, or other reasons that prevent us from doing so.
 This document is being supplied to you solely for your information, and its contents, information or data may not be reproduced,
 redistributed or passed on, directly or indirectly.

 Angel Broking Limited and its affiliates may seek to provide or have engaged in providing corporate finance, investment banking or
 other advisory services in a merger or specific transaction to the companies referred to in this report, as on the date of this report or in
 the past.

 Neither Angel Broking Limited, nor its directors, employees or affiliates shall be liable for any loss or damage that may arise from or in
 connection with the use of this information.

  Note: Please refer to the important `Stock Holding Disclosure' report on the Angel website (Research Section). Also, please
  refer to the latest update on respective stocks for the disclosure status in respect of those stocks. Angel Broking Limited and
  its affiliates may have investment positions in the stocks recommended in this report.


 Disclosure of Interest Statement                                           KEC International
 1. Analyst ownership of the stock                                                No
 2. Angel and its Group companies ownership of the stock                          No
 3. Angel and its Group companies' Directors ownership of the stock               No
 4. Broking relationship with company covered                                     No

 Note: We have not considered any Exposure below Rs 1 lakh for Angel, its Group companies and Directors.


 Ratings (Returns) :            Buy (> 15%)                      Accumulate (5% to 15%)                  Neutral (-5 to 5%)
                                Reduce (-5% to 15%)              Sell (< -15%)


August 4, 2010                                                                                                                            10

More Related Content

What's hot

RIL - result Update
RIL - result UpdateRIL - result Update
RIL - result Update
Angel Broking
ย 
JP Associates
JP AssociatesJP Associates
JP Associates
Angel Broking
ย 
L&T - Result Update RU2QFY2011
L&T - Result Update RU2QFY2011L&T - Result Update RU2QFY2011
L&T - Result Update RU2QFY2011
Angel Broking
ย 
Rallis India - RU2QFY2011
Rallis India - RU2QFY2011Rallis India - RU2QFY2011
Rallis India - RU2QFY2011
Angel Broking
ย 
Jagran Prakashan
Jagran PrakashanJagran Prakashan
Jagran Prakashan
Angel Broking
ย 
BHEL -Result Update
BHEL -Result UpdateBHEL -Result Update
BHEL -Result Update
Angel Broking
ย 
Infosys ru2 qfy2011-151010
Infosys  ru2 qfy2011-151010Infosys  ru2 qfy2011-151010
Infosys ru2 qfy2011-151010
Angel Broking
ย 
Nalco ru4 qfy2010-140510
Nalco ru4 qfy2010-140510Nalco ru4 qfy2010-140510
Nalco ru4 qfy2010-140510
Angel Broking
ย 
Electrosteel castings
Electrosteel castingsElectrosteel castings
Electrosteel castings
Angel Broking
ย 
Sail steel ru4 qfy2010-310510
Sail steel ru4 qfy2010-310510Sail steel ru4 qfy2010-310510
Sail steel ru4 qfy2010-310510
Angel Broking
ย 
Crompton Greaves
Crompton Greaves Crompton Greaves
Crompton Greaves
Angel Broking
ย 
Bajaj Electricals
Bajaj ElectricalsBajaj Electricals
Bajaj Electricals
Angel Broking
ย 
Mcnally Bharat
Mcnally BharatMcnally Bharat
Mcnally Bharat
Angel Broking
ย 
Finolex Cables
Finolex CablesFinolex Cables
Finolex Cables
Angel Broking
ย 
Concor -Result Update
Concor -Result UpdateConcor -Result Update
Concor -Result Update
Angel Broking
ย 

What's hot (20)

RIL - result Update
RIL - result UpdateRIL - result Update
RIL - result Update
ย 
Cesc
Cesc Cesc
Cesc
ย 
JP Associates
JP AssociatesJP Associates
JP Associates
ย 
L&T - Result Update RU2QFY2011
L&T - Result Update RU2QFY2011L&T - Result Update RU2QFY2011
L&T - Result Update RU2QFY2011
ย 
Rallis India - RU2QFY2011
Rallis India - RU2QFY2011Rallis India - RU2QFY2011
Rallis India - RU2QFY2011
ย 
Jagran Prakashan
Jagran PrakashanJagran Prakashan
Jagran Prakashan
ย 
BHEL -Result Update
BHEL -Result UpdateBHEL -Result Update
BHEL -Result Update
ย 
Infosys ru2 qfy2011-151010
Infosys  ru2 qfy2011-151010Infosys  ru2 qfy2011-151010
Infosys ru2 qfy2011-151010
ย 
CCCl
CCClCCCl
CCCl
ย 
Nalco ru4 qfy2010-140510
Nalco ru4 qfy2010-140510Nalco ru4 qfy2010-140510
Nalco ru4 qfy2010-140510
ย 
HCL Tech
HCL Tech  HCL Tech
HCL Tech
ย 
Electrosteel castings
Electrosteel castingsElectrosteel castings
Electrosteel castings
ย 
Sail steel ru4 qfy2010-310510
Sail steel ru4 qfy2010-310510Sail steel ru4 qfy2010-310510
Sail steel ru4 qfy2010-310510
ย 
Crompton Greaves
Crompton Greaves Crompton Greaves
Crompton Greaves
ย 
Bajaj Electricals
Bajaj ElectricalsBajaj Electricals
Bajaj Electricals
ย 
Bosch
BoschBosch
Bosch
ย 
Mcnally Bharat
Mcnally BharatMcnally Bharat
Mcnally Bharat
ย 
Finolex Cables
Finolex CablesFinolex Cables
Finolex Cables
ย 
Concor -Result Update
Concor -Result UpdateConcor -Result Update
Concor -Result Update
ย 
TAJGVK
TAJGVKTAJGVK
TAJGVK
ย 

Viewers also liked

Technical Report - September 3, 2010
Technical Report - September 3, 2010Technical Report - September 3, 2010
Technical Report - September 3, 2010
Angel Broking
ย 
Sterlite Result Update
Sterlite Result UpdateSterlite Result Update
Sterlite Result Update
Angel Broking
ย 
Market Outlook- July 14,2010
Market Outlook- July 14,2010Market Outlook- July 14,2010
Market Outlook- July 14,2010
Angel Broking
ย 
Derivatives report 01 nov-2010
Derivatives report 01 nov-2010Derivatives report 01 nov-2010
Derivatives report 01 nov-2010
Angel Broking
ย 
Simplex Infra
Simplex InfraSimplex Infra
Simplex Infra
Angel Broking
ย 
Tech Report 31 Mar
Tech Report 31 MarTech Report 31 Mar
Tech Report 31 Mar
Angel Broking
ย 
Cairn India Event Update 25 03 10
Cairn India  Event Update   25 03 10Cairn India  Event Update   25 03 10
Cairn India Event Update 25 03 10
Angel Broking
ย 
Cinemax ru4 qfy2010-270510
Cinemax ru4 qfy2010-270510Cinemax ru4 qfy2010-270510
Cinemax ru4 qfy2010-270510
Angel Broking
ย 

Viewers also liked (8)

Technical Report - September 3, 2010
Technical Report - September 3, 2010Technical Report - September 3, 2010
Technical Report - September 3, 2010
ย 
Sterlite Result Update
Sterlite Result UpdateSterlite Result Update
Sterlite Result Update
ย 
Market Outlook- July 14,2010
Market Outlook- July 14,2010Market Outlook- July 14,2010
Market Outlook- July 14,2010
ย 
Derivatives report 01 nov-2010
Derivatives report 01 nov-2010Derivatives report 01 nov-2010
Derivatives report 01 nov-2010
ย 
Simplex Infra
Simplex InfraSimplex Infra
Simplex Infra
ย 
Tech Report 31 Mar
Tech Report 31 MarTech Report 31 Mar
Tech Report 31 Mar
ย 
Cairn India Event Update 25 03 10
Cairn India  Event Update   25 03 10Cairn India  Event Update   25 03 10
Cairn India Event Update 25 03 10
ย 
Cinemax ru4 qfy2010-270510
Cinemax ru4 qfy2010-270510Cinemax ru4 qfy2010-270510
Cinemax ru4 qfy2010-270510
ย 

Similar to Kec International

Idea Cellular
Idea  CellularIdea  Cellular
Idea Cellular
Angel Broking
ย 
Hindalco Novelis
Hindalco Novelis Hindalco Novelis
Hindalco Novelis
Angel Broking
ย 
3i Infotech
3i Infotech3i Infotech
3i Infotech
Angel Broking
ย 
Exide Industries
Exide IndustriesExide Industries
Exide Industries
Angel Broking
ย 
Tcs Result Update
Tcs  Result UpdateTcs  Result Update
Tcs Result Update
Angel Broking
ย 
Bharat Forge
Bharat ForgeBharat Forge
Bharat Forge
Angel Broking
ย 
ABG Shipyard
ABG Shipyard ABG Shipyard
ABG Shipyard
Angel Broking
ย 
Tech Mahindra
Tech Mahindra Tech Mahindra
Tech Mahindra
Angel Broking
ย 
FAG Bearing
FAG BearingFAG Bearing
FAG Bearing
Angel Broking
ย 
Ashok leyland ru4 qfy2010-300410
Ashok leyland ru4 qfy2010-300410Ashok leyland ru4 qfy2010-300410
Ashok leyland ru4 qfy2010-300410
Angel Broking
ย 
Ipca ru4 qfy2010-280510
Ipca ru4 qfy2010-280510Ipca ru4 qfy2010-280510
Ipca ru4 qfy2010-280510
Angel Broking
ย 

Similar to Kec International (20)

Elecon
EleconElecon
Elecon
ย 
Sun TV
Sun TVSun TV
Sun TV
ย 
Idea Cellular
Idea  CellularIdea  Cellular
Idea Cellular
ย 
Hindalco Novelis
Hindalco Novelis Hindalco Novelis
Hindalco Novelis
ย 
Areva TD
Areva TDAreva TD
Areva TD
ย 
3i Infotech
3i Infotech3i Infotech
3i Infotech
ย 
Exide Industries
Exide IndustriesExide Industries
Exide Industries
ย 
Wipro
Wipro  Wipro
Wipro
ย 
HT Media
HT MediaHT Media
HT Media
ย 
Tcs Result Update
Tcs  Result UpdateTcs  Result Update
Tcs Result Update
ย 
Exide
Exide Exide
Exide
ย 
SAIL
SAILSAIL
SAIL
ย 
Bharat Forge
Bharat ForgeBharat Forge
Bharat Forge
ย 
ABG Shipyard
ABG Shipyard ABG Shipyard
ABG Shipyard
ย 
Alembic
Alembic Alembic
Alembic
ย 
Tech Mahindra
Tech Mahindra Tech Mahindra
Tech Mahindra
ย 
FAG Bearing
FAG BearingFAG Bearing
FAG Bearing
ย 
Ashok leyland ru4 qfy2010-300410
Ashok leyland ru4 qfy2010-300410Ashok leyland ru4 qfy2010-300410
Ashok leyland ru4 qfy2010-300410
ย 
Hindalco
Hindalco Hindalco
Hindalco
ย 
Ipca ru4 qfy2010-280510
Ipca ru4 qfy2010-280510Ipca ru4 qfy2010-280510
Ipca ru4 qfy2010-280510
ย 

More from Angel Broking

Market outlook 110612
Market outlook 110612Market outlook 110612
Market outlook 110612
Angel Broking
ย 
Axis%20 bank ru1qfy2012-220711
Axis%20 bank ru1qfy2012-220711Axis%20 bank ru1qfy2012-220711
Axis%20 bank ru1qfy2012-220711
Angel Broking
ย 
Persistent systems
Persistent systemsPersistent systems
Persistent systems
Angel Broking
ย 
Derivative report 19th July 2011
Derivative report 19th July 2011Derivative report 19th July 2011
Derivative report 19th July 2011
Angel Broking
ย 
Market outlook 19th July 2011
Market outlook 19th July 2011Market outlook 19th July 2011
Market outlook 19th July 2011
Angel Broking
ย 
Telecom sector
Telecom sectorTelecom sector
Telecom sector
Angel Broking
ย 
Weekly Report 18th July 2011
Weekly Report 18th July 2011Weekly Report 18th July 2011
Weekly Report 18th July 2011
Angel Broking
ย 
Derivative Report 18th July 2011
Derivative Report 18th July 2011Derivative Report 18th July 2011
Derivative Report 18th July 2011
Angel Broking
ย 
Technical Report 18th July 2011
Technical Report 18th July 2011Technical Report 18th July 2011
Technical Report 18th July 2011
Angel Broking
ย 
Market Outlook 18th July 2011
Market Outlook 18th July 2011Market Outlook 18th July 2011
Market Outlook 18th July 2011
Angel Broking
ย 
South Indian Bank
 South Indian Bank South Indian Bank
South Indian Bank
Angel Broking
ย 
Bajaj auto Result Updated
Bajaj auto Result UpdatedBajaj auto Result Updated
Bajaj auto Result Updated
Angel Broking
ย 
Tata consultancy services
Tata consultancy services Tata consultancy services
Tata consultancy services
Angel Broking
ย 
Fc4 e63c4d01
Fc4 e63c4d01Fc4 e63c4d01
Fc4 e63c4d01
Angel Broking
ย 
Derivatives Report 15th July 2011
Derivatives Report 15th July 2011Derivatives Report 15th July 2011
Derivatives Report 15th July 2011
Angel Broking
ย 
Technical Report 15th July 2011
Technical Report 15th July 2011Technical Report 15th July 2011
Technical Report 15th July 2011
Angel Broking
ย 
Infosys Result Updated
Infosys Result UpdatedInfosys Result Updated
Infosys Result Updated
Angel Broking
ย 
Derivative Report 13th July 2011
Derivative Report 13th July 2011Derivative Report 13th July 2011
Derivative Report 13th July 2011
Angel Broking
ย 
Technical Report 13th July 2011
Technical Report 13th July 2011Technical Report 13th July 2011
Technical Report 13th July 2011
Angel Broking
ย 

More from Angel Broking (20)

Market outlook 110612
Market outlook 110612Market outlook 110612
Market outlook 110612
ย 
Axis%20 bank ru1qfy2012-220711
Axis%20 bank ru1qfy2012-220711Axis%20 bank ru1qfy2012-220711
Axis%20 bank ru1qfy2012-220711
ย 
Persistent systems
Persistent systemsPersistent systems
Persistent systems
ย 
Ht media
Ht mediaHt media
Ht media
ย 
Derivative report 19th July 2011
Derivative report 19th July 2011Derivative report 19th July 2011
Derivative report 19th July 2011
ย 
Market outlook 19th July 2011
Market outlook 19th July 2011Market outlook 19th July 2011
Market outlook 19th July 2011
ย 
Telecom sector
Telecom sectorTelecom sector
Telecom sector
ย 
Weekly Report 18th July 2011
Weekly Report 18th July 2011Weekly Report 18th July 2011
Weekly Report 18th July 2011
ย 
Derivative Report 18th July 2011
Derivative Report 18th July 2011Derivative Report 18th July 2011
Derivative Report 18th July 2011
ย 
Technical Report 18th July 2011
Technical Report 18th July 2011Technical Report 18th July 2011
Technical Report 18th July 2011
ย 
Market Outlook 18th July 2011
Market Outlook 18th July 2011Market Outlook 18th July 2011
Market Outlook 18th July 2011
ย 
South Indian Bank
 South Indian Bank South Indian Bank
South Indian Bank
ย 
Bajaj auto Result Updated
Bajaj auto Result UpdatedBajaj auto Result Updated
Bajaj auto Result Updated
ย 
Tata consultancy services
Tata consultancy services Tata consultancy services
Tata consultancy services
ย 
Fc4 e63c4d01
Fc4 e63c4d01Fc4 e63c4d01
Fc4 e63c4d01
ย 
Derivatives Report 15th July 2011
Derivatives Report 15th July 2011Derivatives Report 15th July 2011
Derivatives Report 15th July 2011
ย 
Technical Report 15th July 2011
Technical Report 15th July 2011Technical Report 15th July 2011
Technical Report 15th July 2011
ย 
Infosys Result Updated
Infosys Result UpdatedInfosys Result Updated
Infosys Result Updated
ย 
Derivative Report 13th July 2011
Derivative Report 13th July 2011Derivative Report 13th July 2011
Derivative Report 13th July 2011
ย 
Technical Report 13th July 2011
Technical Report 13th July 2011Technical Report 13th July 2011
Technical Report 13th July 2011
ย 

Recently uploaded

Toronto dominion bank investor presentation.pdf
Toronto dominion bank investor presentation.pdfToronto dominion bank investor presentation.pdf
Toronto dominion bank investor presentation.pdf
JinJiang6
ย 
QATAR Pills for Abortion -+971*55*85*39*980-in Dubai. Abu Dhabi.
QATAR Pills for Abortion -+971*55*85*39*980-in Dubai. Abu Dhabi.QATAR Pills for Abortion -+971*55*85*39*980-in Dubai. Abu Dhabi.
QATAR Pills for Abortion -+971*55*85*39*980-in Dubai. Abu Dhabi.
hyt3577
ย 
Technology industry / Finnish economic outlook
Technology industry / Finnish economic outlookTechnology industry / Finnish economic outlook
Technology industry / Finnish economic outlook
TechFinland
ย 
+97470301568>>buy weed in qatar,buy thc oil in qatar doha>>buy cannabis oil i...
+97470301568>>buy weed in qatar,buy thc oil in qatar doha>>buy cannabis oil i...+97470301568>>buy weed in qatar,buy thc oil in qatar doha>>buy cannabis oil i...
+97470301568>>buy weed in qatar,buy thc oil in qatar doha>>buy cannabis oil i...
Health
ย 
In Sharjah เฏต(+971)558539980 *_เฏตabortion pills now available.
In Sharjah เฏต(+971)558539980 *_เฏตabortion pills now available.In Sharjah เฏต(+971)558539980 *_เฏตabortion pills now available.
In Sharjah เฏต(+971)558539980 *_เฏตabortion pills now available.
hyt3577
ย 
Law of Demand.pptxnnnnnnnnnnnnnnnnnnnnnnnnnnnnnnnnnnnnnnnnnnn
Law of Demand.pptxnnnnnnnnnnnnnnnnnnnnnnnnnnnnnnnnnnnnnnnnnnnLaw of Demand.pptxnnnnnnnnnnnnnnnnnnnnnnnnnnnnnnnnnnnnnnnnnnn
Law of Demand.pptxnnnnnnnnnnnnnnnnnnnnnnnnnnnnnnnnnnnnnnnnnnn
TintoTom3
ย 
abortion pills in Jeddah Saudi Arabia (+919707899604)cytotec pills in Riyadh
abortion pills in Jeddah Saudi Arabia (+919707899604)cytotec pills in Riyadhabortion pills in Jeddah Saudi Arabia (+919707899604)cytotec pills in Riyadh
abortion pills in Jeddah Saudi Arabia (+919707899604)cytotec pills in Riyadh
samsungultra782445
ย 

Recently uploaded (20)

Toronto dominion bank investor presentation.pdf
Toronto dominion bank investor presentation.pdfToronto dominion bank investor presentation.pdf
Toronto dominion bank investor presentation.pdf
ย 
Significant AI Trends for the Financial Industry in 2024 and How to Utilize Them
Significant AI Trends for the Financial Industry in 2024 and How to Utilize ThemSignificant AI Trends for the Financial Industry in 2024 and How to Utilize Them
Significant AI Trends for the Financial Industry in 2024 and How to Utilize Them
ย 
Stock Market Brief Deck (Under Pressure).pdf
Stock Market Brief Deck (Under Pressure).pdfStock Market Brief Deck (Under Pressure).pdf
Stock Market Brief Deck (Under Pressure).pdf
ย 
20240419-SMC-submission-Annual-Superannuation-Performance-Test-โ€“-design-optio...
20240419-SMC-submission-Annual-Superannuation-Performance-Test-โ€“-design-optio...20240419-SMC-submission-Annual-Superannuation-Performance-Test-โ€“-design-optio...
20240419-SMC-submission-Annual-Superannuation-Performance-Test-โ€“-design-optio...
ย 
QATAR Pills for Abortion -+971*55*85*39*980-in Dubai. Abu Dhabi.
QATAR Pills for Abortion -+971*55*85*39*980-in Dubai. Abu Dhabi.QATAR Pills for Abortion -+971*55*85*39*980-in Dubai. Abu Dhabi.
QATAR Pills for Abortion -+971*55*85*39*980-in Dubai. Abu Dhabi.
ย 
Technology industry / Finnish economic outlook
Technology industry / Finnish economic outlookTechnology industry / Finnish economic outlook
Technology industry / Finnish economic outlook
ย 
ๅŠณไผฆๆฃฎๅคงๅญฆๆฏ•ไธš่ฏ
ๅŠณไผฆๆฃฎๅคงๅญฆๆฏ•ไธš่ฏๅŠณไผฆๆฃฎๅคงๅญฆๆฏ•ไธš่ฏ
ๅŠณไผฆๆฃฎๅคงๅญฆๆฏ•ไธš่ฏ
ย 
NO1 Verified Online Love Vashikaran Specialist Kala Jadu Expert Specialist In...
NO1 Verified Online Love Vashikaran Specialist Kala Jadu Expert Specialist In...NO1 Verified Online Love Vashikaran Specialist Kala Jadu Expert Specialist In...
NO1 Verified Online Love Vashikaran Specialist Kala Jadu Expert Specialist In...
ย 
Bhubaneswar๐ŸŒนRavi Tailkes โคCALL GIRLS 9777949614 ๐Ÿ’Ÿ CALL GIRLS IN bhubaneswar ...
Bhubaneswar๐ŸŒนRavi Tailkes  โคCALL GIRLS 9777949614 ๐Ÿ’Ÿ CALL GIRLS IN bhubaneswar ...Bhubaneswar๐ŸŒนRavi Tailkes  โคCALL GIRLS 9777949614 ๐Ÿ’Ÿ CALL GIRLS IN bhubaneswar ...
Bhubaneswar๐ŸŒนRavi Tailkes โคCALL GIRLS 9777949614 ๐Ÿ’Ÿ CALL GIRLS IN bhubaneswar ...
ย 
+97470301568>>buy weed in qatar,buy thc oil in qatar doha>>buy cannabis oil i...
+97470301568>>buy weed in qatar,buy thc oil in qatar doha>>buy cannabis oil i...+97470301568>>buy weed in qatar,buy thc oil in qatar doha>>buy cannabis oil i...
+97470301568>>buy weed in qatar,buy thc oil in qatar doha>>buy cannabis oil i...
ย 
Call Girls Howrah ( 8250092165 ) Cheap rates call girls | Get low budget
Call Girls Howrah ( 8250092165 ) Cheap rates call girls | Get low budgetCall Girls Howrah ( 8250092165 ) Cheap rates call girls | Get low budget
Call Girls Howrah ( 8250092165 ) Cheap rates call girls | Get low budget
ย 
Pension dashboards forum 1 May 2024 (1).pdf
Pension dashboards forum 1 May 2024 (1).pdfPension dashboards forum 1 May 2024 (1).pdf
Pension dashboards forum 1 May 2024 (1).pdf
ย 
Collecting banker, Capacity of collecting Banker, conditions under section 13...
Collecting banker, Capacity of collecting Banker, conditions under section 13...Collecting banker, Capacity of collecting Banker, conditions under section 13...
Collecting banker, Capacity of collecting Banker, conditions under section 13...
ย 
In Sharjah เฏต(+971)558539980 *_เฏตabortion pills now available.
In Sharjah เฏต(+971)558539980 *_เฏตabortion pills now available.In Sharjah เฏต(+971)558539980 *_เฏตabortion pills now available.
In Sharjah เฏต(+971)558539980 *_เฏตabortion pills now available.
ย 
Business Principles, Tools, and Techniques in Participating in Various Types...
Business Principles, Tools, and Techniques  in Participating in Various Types...Business Principles, Tools, and Techniques  in Participating in Various Types...
Business Principles, Tools, and Techniques in Participating in Various Types...
ย 
Law of Demand.pptxnnnnnnnnnnnnnnnnnnnnnnnnnnnnnnnnnnnnnnnnnnn
Law of Demand.pptxnnnnnnnnnnnnnnnnnnnnnnnnnnnnnnnnnnnnnnnnnnnLaw of Demand.pptxnnnnnnnnnnnnnnnnnnnnnnnnnnnnnnnnnnnnnnnnnnn
Law of Demand.pptxnnnnnnnnnnnnnnnnnnnnnnnnnnnnnnnnnnnnnnnnnnn
ย 
abortion pills in Jeddah Saudi Arabia (+919707899604)cytotec pills in Riyadh
abortion pills in Jeddah Saudi Arabia (+919707899604)cytotec pills in Riyadhabortion pills in Jeddah Saudi Arabia (+919707899604)cytotec pills in Riyadh
abortion pills in Jeddah Saudi Arabia (+919707899604)cytotec pills in Riyadh
ย 
Famous Kala Jadu, Kala ilam specialist in USA and Bangali Amil baba in Saudi ...
Famous Kala Jadu, Kala ilam specialist in USA and Bangali Amil baba in Saudi ...Famous Kala Jadu, Kala ilam specialist in USA and Bangali Amil baba in Saudi ...
Famous Kala Jadu, Kala ilam specialist in USA and Bangali Amil baba in Saudi ...
ย 
Strategic Resources May 2024 Corporate Presentation
Strategic Resources May 2024 Corporate PresentationStrategic Resources May 2024 Corporate Presentation
Strategic Resources May 2024 Corporate Presentation
ย 
Avoidable Errors in Payroll Compliance for Payroll Services Providers - Globu...
Avoidable Errors in Payroll Compliance for Payroll Services Providers - Globu...Avoidable Errors in Payroll Compliance for Payroll Services Providers - Globu...
Avoidable Errors in Payroll Compliance for Payroll Services Providers - Globu...
ย 

Kec International

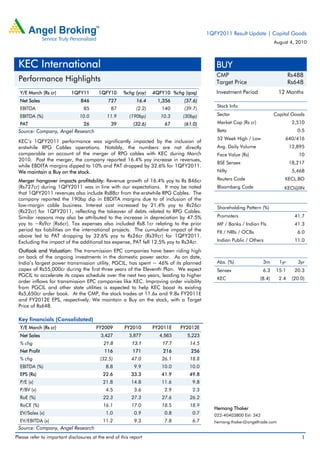
  • 1. 1QFY2011 Result Update | Capital Goods August 4, 2010 KEC International BUY CMP Rs488 Performance Highlights Target Price Rs648 Y/E March (Rs cr) 1QFY11 1QFY10 %chg (yoy) 4QFY10 %chg (qoq) Investment Period 12 Months Net Sales 846 727 16.4 1,356 (37.6) Stock Info EBITDA 85 87 (2.2) 140 (39.7) EBITDA (%) 10.0 11.9 (190bp) 10.3 (30bp) Sector Capital Goods PAT 26 39 (32.6) 67 (61.0) Market Cap (Rs cr) 2,510 Source: Company, Angel Research Beta 0.5 52 Week High / Low 640/416 KECโ€™s 1QFY2011 performance was significantly impacted by the inclusion of erstwhile RPG Cables operations. Notably, the numbers are not directly Avg. Daily Volume 12,895 comparable on account of the merger of RPG cables with KEC during March Face Value (Rs) 10 2010. Post the merger, the company reported 16.4% yoy increase in revenues, BSE Sensex 18,217 while EBDITA margins dipped to 10% and PAT dropped by 32.6% for 1QFY2011. We maintain a Buy on the stock. Nifty 5,468 Merger hangover impacts profitability: Revenue growth of 16.4% yoy to Rs 846cr Reuters Code KECL.BO (Rs727cr) during 1QFY2011 was in line with our expectations. It may be noted Bloomberg Code KECI@IN that 1QFY2011 revenues also include Rs88cr from the erstwhile RPG Cables. The company reported the 190bp dip in EBDITA margins due to of inclusion of the low-margin cable business. Interest cost increased by 21.4% yoy to Rs26cr Shareholding Pattern (%) (Rs22cr) for 1QFY2011, reflecting the takeover of debts related to RPG Cables. Similar reasons may also be attributed to the increase in depreciation by 47.5% Promoters 41.7 yoy to ~Rs9cr (Rs6cr). Tax expenses also included Rs8.1cr relating to the prior MF / Banks / Indian Fls 41.3 period tax liabilities on the international projects. The cumulative impact of the FII / NRIs / OCBs 6.0 above led to PAT dropping by 32.6% yoy to Rs26cr (Rs39cr) for 1QFY2011. Excluding the impact of the additional tax expense, PAT fell 12.5% yoy to Rs34cr. Indian Public / Others 11.0 Outlook and Valuation: The transmission EPC companies have been riding high on back of the ongoing investments in the domestic power sector. As on date, Indiaโ€™s largest power transmission utility, PGCIL, has spent ~ 46% of its planned Abs. (%) 3m 1yr 3yr capex of Rs55,000cr during the first three years of the Eleventh Plan. We expect Sensex 6.3 15.1 20.3 PGCIL to accelerate its capex schedule over the next two years, leading to higher KEC (8.4) 2.4 (20.0) order inflows for transmission EPC companies like KEC. Improving order visibility from PGCIL and other state utilities is expected to help KEC boost its existing Rs5,650cr order book. At the CMP, the stock trades at 11.6x and 9.8x FY2011E and FY2012E EPS, respectively. We maintain a Buy on the stock, with a Target Price of Rs648. Key financials (Consolidated) Y/E March (Rs cr) FY2009 FY2010 FY2011E FY2012E Net Sales 3,427 3,877 4,563 5,223 % chg 21.8 13.1 17.7 14.5 Net Profit 116 171 216 256 % chg (32.5) 47.0 26.1 18.8 EBITDA (%) 8.8 9.9 10.0 10.0 EPS (Rs) 22.6 33.3 41.9 49.8 P/E (x) 21.8 14.8 11.6 9.8 P/BV (x) 4.5 3.6 2.9 2.3 RoE (%) 22.3 27.3 27.6 26.2 RoCE (%) 16.1 17.0 18.5 18.9 Hemang Thaker EV/Sales (x) 1.0 0.9 0.8 0.7 022-40403800 Ext: 342 EV/EBITDA (x) 11.2 9.3 7.8 6.7 hemang.thaker@angeltrade.com Source: Company, Angel Research Please refer to important disclosures at the end of this report 1
  • 2. KEC International | 1QFY2011 Result Update Exhibit 1: 1QFY2011 Performance (Consolidated) Y/E March (Rs cr) 1QFY2011 1QFY2010 yoy (%) 4QFY2010 qoq (%) FY2010 FY2009 yoy (%) Net Sales 846 727 16.4 1,356 (37.6) 3,907 3,429 14.0 Raw Material 414 325 27.4 781 (47.0) 2,013 1,976 1.9 (% of Net Sales) 48.9 44.7 57.6 51.5 57.6 Erection & Sub contracting 209 222 (5.9) 284 (26.4) 958 575 66.6 (% of Net Sales) 24.7 30.5 20.9 24.5 16.8 Employee Cost 48 38 26.3 45 6.4 169 142 18.9 (% of Net Sales) 5.7 5.2 3.3 4.3 4.1 Other Expenses 90 55 63.8 106 (14.4) 371 341 8.7 (% of Net Sales) 10.7 7.6 7.8 9.5 10.0 Total Expenditure 761 640 18.9 1,216 (37.4) 3,511 3,034 15.7 EBITDA 85 87 (2.2) 140 (39.7) 396 395 0.4 EBITDA (%) 10.0 11.9 10.3 10.1 11.5 Interest 26 22 21.4 19 36.2 87 100 (13.5) Depreciation 9 6 47.5 7 28.6 27 23 17.4 Other Income 0 0.0 0.6 1 1 66.7 Profit before Tax 49 59 (16.1) 114 (56.8) 284 272 4.3 (% of Net Sales) 5.8 8.1 8.4 7.3 7.9 Total Tax 23 20 16.2 47 (50.9) 100 94 6.4 (% of PBT) 46.8 33.8 41.1 35.2 34.5 Adjusted PAT 26 39 (32.6) 67 (61.0) 184 178 3.1 (% of Net Sales) 3.1 5.3 4.9 4.7 5.2 Extraordinary items - - (5) 6 (61) (109.8) Reported PAT 26 39 (32.6) 72 (63.6) 190 117 62.3 Source: Company, Angel Research Order backlog: The companyโ€™s order intake for the quarter was ~Rs1,000cr. Order backlog at the end of 1QFY2011 stood at Rs5,650cr equally split across the reporting geographies of International and South Asia. Of the total order backlog, transmission accounted for 76%, distribution & substation 18%, railways 4% and cables 2%. Exhibit 2: Order book (Rs cr) Particulars International South Asia Total Transmission 2,461 1,811 4,272 Distribution 316 699 1,015 Railway 30 217 247 Cable - 113 113 Telecom - 3 3 Total 2,807 2,843 5,650 Source: Company, Angel Research Capex guidance: KEC intends to spend ~ Rs100cr on its tower business in the current fiscal. Capex planned for the cable plant at Vadodara is ~Rs120cr over the next two years. Management expects the Vadodara facility to commence production from FY2012E generating ~Rs400cr in revenues with EBDITA margins of ~7-8% August 4, 2010 2
  • 3. KEC International | 1QFY2011 Result Update Investment Arguments Huge opportunity for transmission EPC players: The government has envisaged investment of Rs140,000cr in the transmission segment during the Eleventh plan, an increase of over two times from the investments made in the Tenth Plan. The scale gets even bigger for the Twelfth Plan, with planned investment of around Rs240,000cr. As per our estimates, this had opened up a potential US $14-15bn opportunity for the transmission EPC players during the Eleventh Plan period alone. Besides, Power Grid Corporation of India (PGCIL), India's largest transmission utility, having spent only ~46% of its planned capex of Rs 55,000cr during the first three years of the Eleventh Plan, is all set to accelerate its capex during the remaining two years, which in turn, would translate into higher order inflows for the transmission EPC sector. Overseas orders to improve: KEC has a Strong international presence across geographies compared to its domestic peers who have generally restricted themselves to local operations. Notably, the company has executed large number of T&D projects in over forty countries. With its footprint spread across continents, KEC is adequately hedged against slow-down in any particular region. On the other hand, any delay or deferment in the release of domestic T&D orders would adversely impact the revenue projections of many domestic EPC companies. Amidst such a scenario, we believe that KEC would be the least impacted owing to its high exposure to international orders. Diversification into railways and telecom sectors a major positive: KEC has forayed into the telecom and railway sectors. Although these divisions currently account for small portion of the company's total revenues, future prospects of the segments are very bright. KEC also plans to enter tracking, signaling and platform construction works in the railway segment. Outlook and Valuation: The transmission EPC companies have been riding high on back of the ongoing investments in the domestic power sector. As on date, Indiaโ€™s largest power transmission utility, PGCIL, has spent ~ 46% of its planned capex of Rs55,000cr during the first three years of the Eleventh Plan. We expect PGCIL to accelerate its capex schedule over the next two years, leading to higher order inflows for transmission EPC companies like KEC. Improving order visibility from PGCIL and other state utilities is expected to help KEC boost its existing Rs5,650cr order book. At the CMP, the stock trades at 11.6x and 9.8x FY2011E and FY2012 EPS, respectively. We maintain a Buy on the stock, with a Target Price of Rs648. Exhibit 3: Actual v/s Angel estimates โ€“ 1QFY2011 Particulars (Rs cr) Actual Estimates Var (%) Revenues 846 844 0.2 Operating Profit 85 85 - PAT 26 35 (25.7) EPS (Rs) 5.1 6.9 (26.1) Source: Company, Angel Research August 4, 2010 3
  • 4. KEC International | 1QFY2011 Result Update Exhibit 4: Angel EPS Forecast v/s Consensus Year Angel forecast (Rs) Bloomberg consensus (Rs) Var (%) FY2011E 41.9 40.1 4.4 FY2012E 49.8 49.6 0.4 Source: Bloomberg, Angel Research Exhibit 5: Key assumptions Particulars FY2011E FY2012E Order Inflow (Rs cr) 5,111 5,878 Order Inflow Growth (%) 20.0 15.0 Order Backlog (Rs cr) 5,995 6,589 Order Backlog Growth (%) 9.0 10.0 Order Book to Sales (%) 43.5 44.5 Source: Company, Angel Research Exhibit 6: One-year forward P/E band 1,000 800 600 400 200 0 Jan-09 Jul-10 Apr-06 Aug-07 Dec-06 May-08 Oct-09 Share Price (Rs) 6x 10x 14x 18x Source: Company, Angel Research August 4, 2010 4
  • 5. KEC International | 1QFY2011 Result Update Exhibit 7: Peer Valuation CMP Tgt Price Upside FY2012E FY2012E FY2010-12E FY2012E FY2012E Company Reco EPS CAGR (Rs) (Rs) (%) P/BV (x) P/E(x) RoCE (%) RoE (%) (%) ABB* Neutral 788 - - 4.9 25.8 35.3 22.3 20.8 Areva T&D* Sell 289 - - 6.0 29.2 11.3 17.6 22.2 BHEL Neutral 2,518 - - 5.0 19.4 21.5 30.4 28.6 BGR Energy Neutral 768 4.8 16.0 31 17.7 33.6 Crompton Greaves Accumulate 281 307 9.3 4.5 18.2 7.2 27.1 27.3 Jyoti Structures Buy 154 215 39.6 1.8 9.3 21.4 19.3 20.6 KEC International Buy 488 648 32.8 2.3 9.8 22.3 18.9 26.2 Thermax Neutral 771 - - 5.5 20.6 30.9 31 29.5 Source: Company, Angel Research. Note: *December year ending. August 4, 2010 5
  • 6. KEC International | 1QFY2011 Result Update Profit and Loss statement (Consolidated) Y/E March (Rs cr) FY2007 FY2008 FY2009 FY2010 FY2011E FY2012E Net Sales 2,041 2,814 3,427 3,877 4,563 5,223 Other operating - - - - - - income Total operating income 2,041 2,814 3,427 3,877 4,563 5,223 % chg 18.1 37.9 21.8 13.1 17.7 14.5 Total Expenditure 1,789 2,460 3,127 3,492 4,109 4,703 Net Raw Materials 929 1,415 1,976 2,011 2,389 2,734 Other Mfg costs 764 924 1,010 1,312 1,528 1,750 Personnel 95 121 142 168 192 219 Other - - - - - - EBITDA 252 354 300 386 454 520 % chg 55.2 40.7 (15.2) 28.5 17.7 14.5 (% of Net Sales) 12.3 12.6 8.8 9.9 10.0 10.0 Depreciation& 33 25 23 26 31 34 Amortisation EBIT 218 329 278 359 423 486 % chg 61.4 50.7 (15.7) 29.5 17.7 14.9 (% of Net Sales) 10.7 11.7 8.1 9.3 9.3 9.3 Interest & other 59 68 100 87 103 105 Charges Other Income 1 0 0 1 1 2 (% of PBT) 0.4 0.1 0.2 0.4 0.4 0.4 Others - - - - - - Recurring PBT 160 262 178 274 322 382 % chg 89.4 63.8 (32.1) 54.0 17.5 18.8 Extraordinary - - - - - - Expense/(Inc.) PBT (reported) 160 262 178 274 322 382 Tax 55.2 89.7 61.5 103.0 106.2 126.2 (% of PBT) 34.5 34.3 34.6 37.6 33.0 33.0 PAT (reported) 105 172 116 171 216 256 Add: Share of earnings - - - - - - of associate Less: Minority interest - - - - - - (MI) Prior period items - - - - - - PAT after MI (reported) 105 172 116 171 216 256 ADJ. PAT 105 172 116 171 216 256 % chg 112.3 64.5 (32.5) 47.0 26.1 18.8 (% of Net Sales) 5.1 6.1 3.4 4.4 4.7 4.9 Basic EPS (Rs) 28 35 24 33 42 50 Fully Diluted EPS (Rs) 20 33 23 33 42 50 % chg 89.4 63.8 (32.1) 54.0 17.5 18.8 August 4, 2010 6
  • 7. KEC International | 1QFY2011 Result Update Balance Sheet (Consolidated) Y/E March (Rs cr) FY2007 FY2008 FY2009 FY2010 FY2011E FY2012E SOURCES OF FUNDS Equity Share Capital 38 49 49 51 51 51 Preference Capital 13 10 - - - - Reserves& Surplus 221 435 509 644 818 1,032 Shareholders Funds 272 495 559 696 869 1,083 Minority Interest - - - - - - Total Loans 386 592 622 772 752 752 Deferred Tax Liability 29 20 30 30 30 30 Total Liabilities 687 1,107 1,210 1,497 1,651 1,865 APPLICATION OF FUNDS Gross Block 464 518 622 729 801 871 Less: Acc. Depreciation 60 90 122 148 179 213 Net Block 404 428 500 581 622 658 Capital Work-in-Progress 2 19 51 19 18 18 Goodwill 4 4 4 4 4 4 Investments 21 0 2 2 2 2 Current Assets 1,248 1,973 2,540 2,648 3,246 3,449 Cash 21 68 137 65 102 140 Loans & Advances 172 270 327 368 433 496 Other - - - - - - Current liabilities 991 1,317 1,886 1,756 2,240 2,265 Net Current Assets 257 656 654 892 1,006 1,184 Mis. Exp. not written off - - - - - - Total Assets 687 1,107 1,210 1,497 1,651 1,865 August 4, 2010 7
  • 8. KEC International | 1QFY2011 Result Update Cash Flow statement (Consolidated) Y/E March (Rs cr) FY07 FY08 FY09 FY10 FY11E FY12E Profit before tax 160 262 178 274 322 382 Depreciation 33 25 23 26 31 34 (Inc)/Dec in Working (209) (353) 71 (310) (77) (140) Capital Less: Other income 1 0 0 1 1 2 Direct taxes paid 46 83 52 103 106 126 Cash Flow from (62) (149) 219 (114) 168 148 Operations (Inc.)/Dec.in Fixed Assets (14) (70) (137) (75) (70) (70) (Inc.)/Dec. in Investments (0) 20 (1) - - - Other income 1 0 0 1 1 2 Cash Flow from Investing (13) (50) (138) (74) (69) (68) Issue of Equity - (4) (15) - - - Inc./(Dec.) in loans 54 205 30 150 (20) - Dividend Paid (Incl. Tax) 20 29 29 36 42 42 Others (0) 73 0 2 - - Cash Flow from 34 173 (14) 114 (62) (42) Financing Inc./(Dec.) in Cash (42) 47 69 (72) 37 38 Opening Cash balances 64 21 68 137 65 102 Closing Cash balances 21 68 137 65 102 140 August 4, 2010 8
  • 9. KEC International | 1QFY2011 Result Update Key Ratios Y/E March FY2007 FY2008 FY2009 FY2010 FY2011E FY2012E Valuation Ratio (x) P/E (on FDEPS) 24.2 14.7 21.8 14.8 11.6 9.8 P/CEPS 18.4 12.9 18.2 12.9 10.3 8.7 P/BV 9.8 5.2 4.5 3.6 2.9 2.3 Dividend yield (%) 0.9 1.0 1.0 1.2 1.4 1.4 EV/Sales 1.4 1.1 0.9 0.8 0.7 0.6 EV/EBITDA 11.5 8.6 10.1 8.4 7.0 6.1 EV/Total Assets 4.2 2.8 2.5 2.2 1.9 1.7 Per Share Data (Rs) 27.8 34.9 23.6 33.3 41.9 49.8 EPS (Basic) 20.4 33.5 22.6 33.3 41.9 49.8 EPS (fully diluted) 26.9 38.4 27.0 38.4 47.9 56.4 Cash EPS 4.5 5.0 5.0 6.0 7.0 7.0 DPS 50.4 94.3 108.6 135.3 169.0 210.6 Book Value 24.2 14.7 21.8 14.8 11.8 9.9 Dupont Analysis EBIT margin (%) 10.7 11.7 8.1 9.3 9.3 9.3 Tax retention ratio 0.7 0.7 0.7 0.6 0.7 0.7 Asset turnover (x) 3.6 3.3 3.2 3.1 3.1 3.2 ROIC (Post-tax) (%) 25.0 25.4 17.2 17.9 19.0 19.9 Cost of Debt (Post 10.8 9.1 10.8 7.8 9.0 9.4 Tax) (%) Leverage (x) 1.4 1.1 0.9 1.0 0.7 0.6 Operating RoE (%) 45.1 43.0 22.7 28.2 26.5 25.8 Returns (%) RoCE (Pre-tax) 35.6 36.7 24.0 26.6 26.9 27.7 Angel RoIC (Pre-tax) 38.8 39.3 27.3 29.6 28.8 30.1 RoE 48.3 46.3 22.3 27.3 27.6 26.2 Turnover ratios (x) Asset Turnover (Gross 4.5 5.7 6.0 5.7 6.0 6.2 Block) Inventory / Sales 25 23 23 24 22 21 (days) Receivables (days) 142 151 175 178 175 172 Payables (days) 71 74 92 86 83 81 Working capital cycle 42 76 55 78 72 73 (ex-cash) (days) Solvency ratios (x) Net debt to equity 1.4 1.1 0.9 1.0 0.7 0.6 Net debt to EBITDA 1.4 1.5 1.6 1.8 1.4 1.2 Interest Coverage 3.7 4.9 2.8 4.2 4.1 4.6 (EBIT / Interest) August 4, 2010 9
  • 10. KEC International | 1QFY2011 Result Update Research Team Tel: 022 - 4040 3800 E-mail: research@angeltrade.com Website: www.angeltrade.com DISCLAIMER This document is solely for the personal information of the recipient, and must not be singularly used as the basis of any investment decision. Nothing in this document should be construed as investment or financial advice. Each recipient of this document should make such investigations as they deem necessary to arrive at an independent evaluation of an investment in the securities of the companies referred to in this document (including the merits and risks involved), and should consult their own advisors to determine the merits and risks of such an investment. Angel Broking Limited, its affiliates, directors, its proprietary trading and investment businesses may, from time to time, make investment decisions that are inconsistent with or contradictory to the recommendations expressed herein. The views contained in this document are those of the analyst, and the company may or may not subscribe to all the views expressed within. Reports based on technical and derivative analysis center on studying charts of a stock's price movement, outstanding positions and trading volume, as opposed to focusing on a company's fundamentals and, as such, may not match with a report on a company's fundamentals. The information in this document has been printed on the basis of publicly available information, internal data and other reliable sources believed to be true, but we do not represent that it is accurate or complete and it should not be relied on as such, as this document is for general guidance only. Angel Broking Limited or any of its affiliates/ group companies shall not be in any way responsible for any loss or damage that may arise to any person from any inadvertent error in the information contained in this report. Angel Broking Limited has not independently verified all the information contained within this document. Accordingly, we cannot testify, nor make any representation or warranty, express or implied, to the accuracy, contents or data contained within this document. While Angel Broking Limited endeavours to update on a reasonable basis the information discussed in this material, there may be regulatory, compliance, or other reasons that prevent us from doing so. This document is being supplied to you solely for your information, and its contents, information or data may not be reproduced, redistributed or passed on, directly or indirectly. Angel Broking Limited and its affiliates may seek to provide or have engaged in providing corporate finance, investment banking or other advisory services in a merger or specific transaction to the companies referred to in this report, as on the date of this report or in the past. Neither Angel Broking Limited, nor its directors, employees or affiliates shall be liable for any loss or damage that may arise from or in connection with the use of this information. Note: Please refer to the important `Stock Holding Disclosure' report on the Angel website (Research Section). Also, please refer to the latest update on respective stocks for the disclosure status in respect of those stocks. Angel Broking Limited and its affiliates may have investment positions in the stocks recommended in this report. Disclosure of Interest Statement KEC International 1. Analyst ownership of the stock No 2. Angel and its Group companies ownership of the stock No 3. Angel and its Group companies' Directors ownership of the stock No 4. Broking relationship with company covered No Note: We have not considered any Exposure below Rs 1 lakh for Angel, its Group companies and Directors. Ratings (Returns) : Buy (> 15%) Accumulate (5% to 15%) Neutral (-5 to 5%) Reduce (-5% to 15%) Sell (< -15%) August 4, 2010 10