
Recommandé
Contenu connexe
Similaire à demand and supply
Similaire à demand and supply (20)
Plus de A B
Plus de A B (17)
Dernier
Dernier (20)
demand and supply
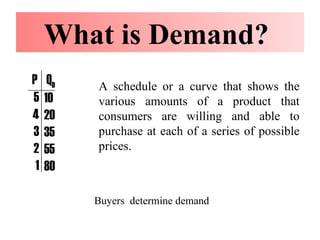
- 1. 5 4 3 2 1 10 20 35 55 80 A schedule or a curve that shows the various amounts of a product that consumers are willing and able to purchase at each of a series of possible prices. What is Demand? Buyers determine demand P Q D
- 2. P Q o 5 4 3 2 1 5 4 3 2 1 10 20 35 55 80 Price of quantity Quantity Plot the Points 10 20 30 40 50 60 70 80 Graphing Demand P Q D
- 3. 55 Q o 5 4 3 2 1 5 4 3 2 1 10 20 35 55 80 Quantity Plot the Points 10 20 30 40 50 60 70 80 Price of quantity Graphing Demand P P Q D
- 4. 35 P Q o 5 4 3 2 1 5 4 3 2 1 10 20 35 55 80 Quantity Plot the Points 10 20 30 40 50 60 70 80 Price of quantity Graphing Demand P Q D
- 5. P Q o 5 4 3 2 1 5 4 3 2 1 10 20 35 55 80 Price of quantity Quantity Plot the Points 10 20 30 40 50 60 70 80 Price of quantity Graphing Demand P Q D
- 6. P Q o 5 4 3 2 1 5 4 3 2 1 10 20 35 55 80 Price of quantity Quantity Plot the Points 10 20 30 40 50 60 70 80 Graphing Demand P Q D
- 7. P Q o 5 4 3 2 1 5 4 3 2 1 10 20 35 55 80 D Price of quantity Quantity Connect the Points 10 20 30 40 50 60 70 80 Graphing Demand P Q D
- 9. P Q o 5 4 3 2 1 5 4 3 2 1 10 20 35 55 80 D Quantity 10 20 30 40 50 60 70 80 Price of quantity Graphing Demand What if Demand Increases? P Q D
- 10. P Q o 5 4 3 2 1 5 4 3 2 1 D Price of quantity Quantity 10 20 30 40 50 60 70 80 D’ Increase in Demand Increase In quantity demanded (extension in demand) 10 20 35 55 80 30 40 60 80 + Graphing Demand P 2 P 1 P Q D
- 11. P Q o 5 4 3 2 1 5 4 3 2 1 10 20 35 55 80 D Price of qauntity Quantity 10 20 30 40 50 60 70 80 What if Demand Decreases? Graphing Demand P Q D
- 12. P Q o 5 4 3 2 1 5 4 3 2 1 10 20 35 55 80 D Price of quantity Quantity 10 20 30 40 50 60 70 80 -- 10 20 40 60 D’ Decrease in Demand Decrease in quantity demanded (contraction in demand) Graphing Demand P 1 P 2 P Q D
- 14. Determinants of demand VARIABLE A CHANGE IN THIS VARIABLE PRICE Representation a movement along the demand curve INCOME Shift the demand curve TASTES Shift the demand curve PRICE OF OTHER GOODS Shift the demand curve NUMBER OF BUYERS Shift the demand curve EXPECTATION Shifts the demand curve
- 15. 1 2 3 4 5 Supply is a schedule or a curve showing the amounts of a product that producers are willing and able to make available for sale at each of a series of possible prices. 5 20 35 50 60 What is Supply? P Q S
- 16. 5 P Q o 5 4 3 2 1 10 20 30 40 50 60 70 80 5 4 3 2 1 60 50 35 20 5 Price of a quantity Quantity Plot the Points Graphing Supply? P Q S
- 17. P Q o 5 4 3 2 1 10 20 30 40 50 60 70 80 5 4 3 2 1 60 50 35 20 5 Quantity Price of a quantity Graphing Supply? P Q S
- 18. 35 P Q o 5 4 3 2 1 10 20 30 40 50 60 70 80 5 4 3 2 1 60 50 35 20 5 Quantity Price of a quantity Graphing Supply? P Q S
- 19. P Q o 5 4 3 2 1 10 20 30 40 50 60 70 80 5 4 3 2 1 60 50 35 20 5 Quantity Price of a quantity Graphing Supply? P Q S
- 20. P Q o 5 4 3 2 1 10 20 30 40 50 60 70 80 5 4 3 2 1 60 50 35 20 5 Quantity Price of a quantity Graphing Supply? P Q S
- 21. S P Q o 5 4 3 2 1 10 20 30 40 50 60 70 80 5 4 3 2 1 60 50 35 20 5 Quantity Connect the Points Price of a quantity Graphing Supply? P Q S
- 23. Price of quantity S P Q o 5 4 3 2 1 10 20 30 40 50 60 70 80 $5 4 3 2 1 60 50 35 20 5 Quantity What if Supply Increases? Law of Supply? P Q S
- 24. S P Q o 5 4 3 2 1 10 20 30 40 50 60 70 80 Price of quantity Quantity 5 4 3 2 1 60 50 35 20 5 80 70 60 45 30 S’ Increase in Supply Increase in Quantity Supplied Law of Supply? P 1 P 2 P Q S
- 25. S P Q o 5 4 3 2 1 10 20 30 40 50 60 70 80 $5 4 3 2 1 60 50 35 20 5 Quantity What if Supply Decreases? Price of a quantity Law of Supply? P Q S
- 26. S P Q o 5 4 3 2 1 10 20 30 40 50 60 70 80 5 4 3 2 1 60 50 35 20 5 Quantity S’ 45 30 20 0 -- Decrease in Supply Decrease in Quantity Supplied Price of a quantity Law of Supply? P 2 P 1 P Q S
- 28. Determinants of Supply? VARIABLE A CHANGE IN THIS VARIABLE PRICE Representation a movement along the supply curve TECHNOLOGY Shift the supply curve TASTES & SUBSIDIES Shift the supply curve PRICE OF OTHER GOODS Shift the supply curve NUMBER OF SELLERS Shift the supply curve EXPECTATION Shifts the supply curve
- 29. EQUILIBRIUM Equilibrium refers to a situation in which the price has reached the level where quantity supplied equals quantity demanded. quantity supplied = quantity demanded (q s = q d )
- 30. 5 4 3 2 1 10 20 35 55 80 5 4 3 2 1 60 50 35 20 5 200 B U Y E R S MARKET DEMAND 2,000 4,000 7,000 11,000 16,000 200 S E L L E R S 12,000 10,000 7,000 4,000 1,000 MARKET SUPPLY EQUILIBRIUM x x EQUILIBRIUM P Q D P Q S
- 31. 7 S Q o 5 4 3 2 1 2 4 6 8 10 12 14 16 5 4 3 2 1 2,000 4,000 7,000 11,000 16,000 5 4 3 2 1 12,000 10,000 7,000 4,000 1,000 D Quantity EQUILIBRIUM P Q D P Q S
- 33. 7 S P Q o 5 4 3 2 1 2 4 6 8 10 12 14 16 5 4 3 2 1 2,000 4,000 7,000 11,000 16,000 5 4 3 2 1 12,000 10,000 7,000 4,000 1,000 D Price of quantity Quantity Surplus At a “P4” price more is being supplied than demanded EQUILIBRIUM- surplus P Q D P Q S
- 34. 11 7 S P Q o 5 4 3 2 1 2 4 6 8 10 12 14 16 5 4 3 2 1 2,000 4,000 7,000 11,000 16,000 5 4 3 2 1 12,000 10,000 7,000 4,000 1,000 D Price of quantity Quantity At a “P2” price more is being demanded than supplied Shortage EQUILIBRIUM- shortage P Q D P Q S
- 35. QUESTIONS ?
- 36. Thank You!