SlideShare une entreprise Scribd logo
1  sur  60
Trading Divergences
Topics:
 RSI
 RSI Math's
 Internal Characteristics
 Ratio Analysis
 Trend Determination
 Range Shift
 Various patterns n their Reliability.
 Math Error/Divergence
 Classification of Divergence.
 Simple Divergence
 Calculation of Divergence.
 Cheat sheet of Simple Divergence
 Hidden Divergence
 Cheat Sheet of Hidden Divergence
 Multiple Divergence
 Cheat Sheet of multiple Divergence
 Conclusion
Relative Strength Index(RSI)
 In June 1978, Welles Wilder introduced the Relative Strength
Index.
 It represents a ratio of the average 'gains' to the average 'losses'
calculated over a number of time periods.
 It is a formula based indicator which is usually assume to test the
strength and movement in the market.
 It is a range bound Oscillator which has upper boundary at 100 &
lower boundary at 0.
 RSI is considered overbought when above 70 and oversold when
below 30.
 Signals can also be generated by looking for divergences, failure
swings and centerline crossovers.
 RSI can also be used to identify the general trend.
RSI MATHS
 RSI Formula can be defined as
RSI = 100 - 100
(1+RS)
RS is defined as ratio between average gain to average loss over a
certain period of time
Average Gain over “n” period of times
Average Loss over “n” period of times
Where n can be defined by user
Generally it is used as 14 days of period.
Internal Characteristics Of RSI
Ratio Analysis
 The RSI behaves like a logarithmic curve.
 Anytime the ratio exceeds 10: 1 , the market has been experiencing
a very strong move up.
 Anytime the ratio exceeds 1 : 10, the market has been experiencing
a very strong down move.
 The largest increase or decrease in the RSI value occurs when the
ratio changes from 1 : 1 to the next whole number (2: 1 or 1 :2).
 The RSI value experiences its largest changes in value as it
oscillates between the index values of 40 and 60.
 In other words the RSI is most sensitive to price change when the
RSI is oscillating between 40 and 60.
 When the ratio is 20: 1 , The RSI value at this time is only
95.24/4.76. This is a market condition that almost never occurs
when the look back period is 14 bars.
Determination Of Trend
 In a Bull market RSI value tends to travel in between 40-80 zones.
 In a Bear Market RSI value tends to travel in Between 60-20 zones.
 In Sideways market RSI Value tends to travel in between 40-65
zones.
 In extreme or very strong Bull market RSI bound in 60-90 levels.
 In extreme or very strong Bear market RSI bound in 40-10 levels.
 Value above 95 and below 5 are very rare. As above or below this
this level RSI behave logarithmically means change in RS is very
minute to notice .
 Above levels are applicable in any timeframe.
Range Shift
 Range Shift simply means when a security changes its trend .
1. From uptrend to downtrend.
2. From Downtrend to uptrend.
3. From Sideways to uptrend/downtrend.
4. From Uptrend/Downtrend to Sideways.
Various Patterns n Their Reliability
 M pattern
 W pattern
 V pattern
 Double Top/Bottom
 Head n Shoulder
 Flag
 Triangles
 Spring
 Wedges
Math's Error or Divergence
 It can be define as whenever there is a misunderstanding b/w price n
indicator they used to get divert from each other and moved in opposite
direction to each other.
Classification Of Divergence
Divergence
Simple or
Classic
Bullish Bearish
Multiple Bullish
& Bearish
Simple / Hidden
Hidden
Bullish Bearish
Simple or Classic Divergence
 Whenever price makes a higher high n RSI makes lower high then it
is said to be Simple Bearish Divergence.
 Whenever price makes a lower low n RSI makes higher low then it
is said to be Simple Bullish Divergence.
 Simple Bullish Divergence occur in bear market, commonly known
as short covering.
 Simple Bearish Divergence occur in bull market, commonly known
as retracement or correction.
Calculation of Divergence
For Bullish Divergence:
D=(P–T)
DT=(P+D)
Where ,
P =Value of peak in b/w 2
troughs,
T=Lowest value of trough,
D = Difference of P & T,
DT = Divergence Target.
For Bearish Divergence:
D=(P–T)
DT=(T-D)
Where ,
P=Highest Value of Peak,
T=Value of valley in b/w 2
peaks,
D = Difference of P & T ,
DT = Divergence Target.
Key Points For Simple Divergence
 A simple bullish divergence is more reliable when RSI value lies
between 40 to 10 .
 A simple bearish divergence is more reliable when RSI value lies
between 80 to 65 .
 Lesser the no. of candles between 2 troughs or peaks more
powerful will be reversal in terms of price n time both.
Hidden Divergence
 Whenever RSI makes a Higher high & price makes a lower high
then it is said to be Bearish Hidden Divergence.
 Whenever RSI makes a lower low & price makes a higher low then
it is said to be Bullish Hidden Divergence.
Key Points For Hidden Divergence
 Hidden divergence mostly occur between 40 to 65 level as RSI
value.
 A bullish hidden divergence is strongest when it occur near 40 level
with W or double bottom pattern.
 A bearish hidden divergence is strongest when it occur near 65
level with M or double top pattern.
 Usually highest volume is witness in reversal candle as compared
to last 5-8 candles near its resistance at 65 or support at 40 in RSI .
Multiple Divergence
 Whenever price makes a series of lower low n RSI makes a series
of higher low it known to be Multiple Simple Bullish Divergence.
 Whenever price makers a series of higher high n RSI makes a series
of lower high it is known to be Multiple Simple Bearish
Divergence.
 Whenever RSI makes a series of lower low n Price makes a series of
higher low it is known to be Multiple Hidden Bullish Divergence.
 Whenever RSI makes a series of Higher high n Price makes a series
of lower high it is known to be Multiple Hidden Bearish
Divergence.
Key Points For Multiple Divergence
 Multiple Bullish Divergence are more reliable when RSI value lies
between 40 -10 along with triple bottom , falling wedge , H &S
formation formed either in RSI or in price.
 Multiple Bearish Divergence are more reliable when RSI value lies
between 65-80 along with triple top , rising wedge, H&S formation
formed wither in RSI or in price.
 Multiple hidden divergence are more reliable when RSI value lies
between 40-65 along with spring ,triangle, flag or combination of three
is formed either in Price or RSI.
 Multiple Divergence are the strongest & most reliable trend reversal
signal .
 Valid for all timeframe.
Conclusion
THANK YOU

Contenu connexe

Tendances

Pull Back Swing Trading Strategy I The Only Way To Trade Stocks and E-Mini Re...
Pull Back Swing Trading Strategy I The Only Way To Trade Stocks and E-Mini Re...Pull Back Swing Trading Strategy I The Only Way To Trade Stocks and E-Mini Re...
Pull Back Swing Trading Strategy I The Only Way To Trade Stocks and E-Mini Re...Marketgeekschannel
 
Introduction to Technical Analysis
Introduction to Technical AnalysisIntroduction to Technical Analysis
Introduction to Technical Analysismediafin
 
Magic Breakout Forex Trading Strategy PDF eBook
Magic Breakout Forex Trading Strategy PDF eBookMagic Breakout Forex Trading Strategy PDF eBook
Magic Breakout Forex Trading Strategy PDF eBookeforexcourse web
 
Understanding Japanese Candlesticks in Forex Trading by valentino heavens
Understanding Japanese Candlesticks in Forex Trading by valentino heavensUnderstanding Japanese Candlesticks in Forex Trading by valentino heavens
Understanding Japanese Candlesticks in Forex Trading by valentino heavensValentino Heavens
 
40 pip parabolic sar forex strategy (1)
40 pip parabolic sar forex strategy (1)40 pip parabolic sar forex strategy (1)
40 pip parabolic sar forex strategy (1)pipsumo traderfx
 
What are Key Chart Levels and How to Trade Them
What are Key Chart Levels and How to Trade ThemWhat are Key Chart Levels and How to Trade Them
What are Key Chart Levels and How to Trade Them My Trading Skills
 
Candlestick patterns
Candlestick patternsCandlestick patterns
Candlestick patternsnattyvirk
 
Technical analysis (2)
Technical analysis (2)Technical analysis (2)
Technical analysis (2)Anand Verma
 
Technical chart patterns
Technical chart patternsTechnical chart patterns
Technical chart patternsGerry Gatawa
 
Overview of price action trading
Overview of price action tradingOverview of price action trading
Overview of price action tradingChristineNelson17
 
Best Swing Trading Indicators and Oscillators
Best Swing Trading Indicators and OscillatorsBest Swing Trading Indicators and Oscillators
Best Swing Trading Indicators and OscillatorsSwingTradingBootCamp
 
Momentum indicators in tech. analysis
Momentum indicators in tech. analysisMomentum indicators in tech. analysis
Momentum indicators in tech. analysisPuneet Arora
 
Introduction To Technical Analysis
Introduction To Technical AnalysisIntroduction To Technical Analysis
Introduction To Technical AnalysisTrilok Hg
 
Forex Trading - How to Create a Trading Strategy
Forex Trading - How to Create a Trading StrategyForex Trading - How to Create a Trading Strategy
Forex Trading - How to Create a Trading StrategyBlueMax Capital
 
How to Use Pivot Points in Day Trading
How to Use Pivot Points in Day TradingHow to Use Pivot Points in Day Trading
How to Use Pivot Points in Day TradingVivek Rattan
 
Trading With Candlestick Charts
Trading With Candlestick ChartsTrading With Candlestick Charts
Trading With Candlestick ChartsVivek Rattan
 
Learn A Simple Range Trading Strategy
Learn A Simple Range Trading StrategyLearn A Simple Range Trading Strategy
Learn A Simple Range Trading StrategyNetpicksTrading
 
Price Action Trading.pdf
Price Action Trading.pdfPrice Action Trading.pdf
Price Action Trading.pdfShreya292338
 

Tendances (20)

5 Day Trading Techniques
5 Day Trading Techniques5 Day Trading Techniques
5 Day Trading Techniques
 
Pull Back Swing Trading Strategy I The Only Way To Trade Stocks and E-Mini Re...
Pull Back Swing Trading Strategy I The Only Way To Trade Stocks and E-Mini Re...Pull Back Swing Trading Strategy I The Only Way To Trade Stocks and E-Mini Re...
Pull Back Swing Trading Strategy I The Only Way To Trade Stocks and E-Mini Re...
 
Introduction to Technical Analysis
Introduction to Technical AnalysisIntroduction to Technical Analysis
Introduction to Technical Analysis
 
Magic Breakout Forex Trading Strategy PDF eBook
Magic Breakout Forex Trading Strategy PDF eBookMagic Breakout Forex Trading Strategy PDF eBook
Magic Breakout Forex Trading Strategy PDF eBook
 
Understanding Japanese Candlesticks in Forex Trading by valentino heavens
Understanding Japanese Candlesticks in Forex Trading by valentino heavensUnderstanding Japanese Candlesticks in Forex Trading by valentino heavens
Understanding Japanese Candlesticks in Forex Trading by valentino heavens
 
40 pip parabolic sar forex strategy (1)
40 pip parabolic sar forex strategy (1)40 pip parabolic sar forex strategy (1)
40 pip parabolic sar forex strategy (1)
 
What are Key Chart Levels and How to Trade Them
What are Key Chart Levels and How to Trade ThemWhat are Key Chart Levels and How to Trade Them
What are Key Chart Levels and How to Trade Them
 
Candlestick patterns
Candlestick patternsCandlestick patterns
Candlestick patterns
 
Technical analysis (2)
Technical analysis (2)Technical analysis (2)
Technical analysis (2)
 
Technical chart patterns
Technical chart patternsTechnical chart patterns
Technical chart patterns
 
Overview of price action trading
Overview of price action tradingOverview of price action trading
Overview of price action trading
 
Best Swing Trading Indicators and Oscillators
Best Swing Trading Indicators and OscillatorsBest Swing Trading Indicators and Oscillators
Best Swing Trading Indicators and Oscillators
 
Momentum indicators in tech. analysis
Momentum indicators in tech. analysisMomentum indicators in tech. analysis
Momentum indicators in tech. analysis
 
21 candlesticks
21 candlesticks21 candlesticks
21 candlesticks
 
Introduction To Technical Analysis
Introduction To Technical AnalysisIntroduction To Technical Analysis
Introduction To Technical Analysis
 
Forex Trading - How to Create a Trading Strategy
Forex Trading - How to Create a Trading StrategyForex Trading - How to Create a Trading Strategy
Forex Trading - How to Create a Trading Strategy
 
How to Use Pivot Points in Day Trading
How to Use Pivot Points in Day TradingHow to Use Pivot Points in Day Trading
How to Use Pivot Points in Day Trading
 
Trading With Candlestick Charts
Trading With Candlestick ChartsTrading With Candlestick Charts
Trading With Candlestick Charts
 
Learn A Simple Range Trading Strategy
Learn A Simple Range Trading StrategyLearn A Simple Range Trading Strategy
Learn A Simple Range Trading Strategy
 
Price Action Trading.pdf
Price Action Trading.pdfPrice Action Trading.pdf
Price Action Trading.pdf
 

Similaire à Trading divergences

Technical analysis
Technical analysisTechnical analysis
Technical analysisprasan25
 
Rsi pro forex trading system cash back forex rebaitess ( pdf drive ) (2)
Rsi pro forex trading system   cash back forex rebaitess ( pdf drive ) (2)Rsi pro forex trading system   cash back forex rebaitess ( pdf drive ) (2)
Rsi pro forex trading system cash back forex rebaitess ( pdf drive ) (2)hitesh836039
 
QNBFS Daily Technical Trader Qatar - November 14, 2021 التحليل الفني اليومي ل...
QNBFS Daily Technical Trader Qatar - November 14, 2021 التحليل الفني اليومي ل...QNBFS Daily Technical Trader Qatar - November 14, 2021 التحليل الفني اليومي ل...
QNBFS Daily Technical Trader Qatar - November 14, 2021 التحليل الفني اليومي ل...QNB Group
 
QNBFS Daily Technical Trader Qatar - December 04 2019 التحليل الفني اليومي لب...
QNBFS Daily Technical Trader Qatar - December 04 2019 التحليل الفني اليومي لب...QNBFS Daily Technical Trader Qatar - December 04 2019 التحليل الفني اليومي لب...
QNBFS Daily Technical Trader Qatar - December 04 2019 التحليل الفني اليومي لب...QNB Group
 
QNBFS Daily Technical Trader Qatar - September 05, 2021 التحليل الفني اليومي ...
QNBFS Daily Technical Trader Qatar - September 05, 2021 التحليل الفني اليومي ...QNBFS Daily Technical Trader Qatar - September 05, 2021 التحليل الفني اليومي ...
QNBFS Daily Technical Trader Qatar - September 05, 2021 التحليل الفني اليومي ...QNB Group
 
QNBFS Daily Technical Trader Qatar - November 25 2019 التحليل الفني اليومي لب...
QNBFS Daily Technical Trader Qatar - November 25 2019 التحليل الفني اليومي لب...QNBFS Daily Technical Trader Qatar - November 25 2019 التحليل الفني اليومي لب...
QNBFS Daily Technical Trader Qatar - November 25 2019 التحليل الفني اليومي لب...QNB Group
 
QNBFS Daily Technical Trader Qatar - December 05 2019 التحليل الفني اليومي لب...
QNBFS Daily Technical Trader Qatar - December 05 2019 التحليل الفني اليومي لب...QNBFS Daily Technical Trader Qatar - December 05 2019 التحليل الفني اليومي لب...
QNBFS Daily Technical Trader Qatar - December 05 2019 التحليل الفني اليومي لب...QNB Group
 
QNBFS Daily Technical Trader Qatar - May 05, 2021 التحليل الفني اليومي لبورصة...
QNBFS Daily Technical Trader Qatar - May 05, 2021 التحليل الفني اليومي لبورصة...QNBFS Daily Technical Trader Qatar - May 05, 2021 التحليل الفني اليومي لبورصة...
QNBFS Daily Technical Trader Qatar - May 05, 2021 التحليل الفني اليومي لبورصة...QNB Group
 
QNBFS Daily Technical Trader Qatar - October 18, 2021 التحليل الفني اليومي لب...
QNBFS Daily Technical Trader Qatar - October 18, 2021 التحليل الفني اليومي لب...QNBFS Daily Technical Trader Qatar - October 18, 2021 التحليل الفني اليومي لب...
QNBFS Daily Technical Trader Qatar - October 18, 2021 التحليل الفني اليومي لب...QNB Group
 
QNBFS Daily Technical Trader Qatar - November 12 2019 التحليل الفني اليومي لب...
QNBFS Daily Technical Trader Qatar - November 12 2019 التحليل الفني اليومي لب...QNBFS Daily Technical Trader Qatar - November 12 2019 التحليل الفني اليومي لب...
QNBFS Daily Technical Trader Qatar - November 12 2019 التحليل الفني اليومي لب...QNB Group
 
QNBFS Daily Technical Trader Qatar - August 12, 2021 التحليل الفني اليومي لبو...
QNBFS Daily Technical Trader Qatar - August 12, 2021 التحليل الفني اليومي لبو...QNBFS Daily Technical Trader Qatar - August 12, 2021 التحليل الفني اليومي لبو...
QNBFS Daily Technical Trader Qatar - August 12, 2021 التحليل الفني اليومي لبو...QNB Group
 
QNBFS Daily Technical Trader - Qatar for December 27, 2018 التحليل الفني اليو...
QNBFS Daily Technical Trader - Qatar for December 27, 2018 التحليل الفني اليو...QNBFS Daily Technical Trader - Qatar for December 27, 2018 التحليل الفني اليو...
QNBFS Daily Technical Trader - Qatar for December 27, 2018 التحليل الفني اليو...QNB Group
 
QNBFS Daily Technical Trader Qatar - November 28 2019 التحليل الفني اليومي لب...
QNBFS Daily Technical Trader Qatar - November 28 2019 التحليل الفني اليومي لب...QNBFS Daily Technical Trader Qatar - November 28 2019 التحليل الفني اليومي لب...
QNBFS Daily Technical Trader Qatar - November 28 2019 التحليل الفني اليومي لب...QNB Group
 
QNBFS Daily Technical Trader Qatar - June 17, 2021 التحليل الفني اليومي لبورص...
QNBFS Daily Technical Trader Qatar - June 17, 2021 التحليل الفني اليومي لبورص...QNBFS Daily Technical Trader Qatar - June 17, 2021 التحليل الفني اليومي لبورص...
QNBFS Daily Technical Trader Qatar - June 17, 2021 التحليل الفني اليومي لبورص...QNB Group
 
QNBFS Daily Technical Trader - Qatar for December 20, 2018 التحليل الفني اليو...
QNBFS Daily Technical Trader - Qatar for December 20, 2018 التحليل الفني اليو...QNBFS Daily Technical Trader - Qatar for December 20, 2018 التحليل الفني اليو...
QNBFS Daily Technical Trader - Qatar for December 20, 2018 التحليل الفني اليو...QNB Group
 
QNBFS Daily Technical Trader - Qatar for December 23, 2018 التحليل الفني اليو...
QNBFS Daily Technical Trader - Qatar for December 23, 2018 التحليل الفني اليو...QNBFS Daily Technical Trader - Qatar for December 23, 2018 التحليل الفني اليو...
QNBFS Daily Technical Trader - Qatar for December 23, 2018 التحليل الفني اليو...QNB Group
 
QNBFS Daily Technical Trader Qatar - August 23, 2021 التحليل الفني اليومي لبو...
QNBFS Daily Technical Trader Qatar - August 23, 2021 التحليل الفني اليومي لبو...QNBFS Daily Technical Trader Qatar - August 23, 2021 التحليل الفني اليومي لبو...
QNBFS Daily Technical Trader Qatar - August 23, 2021 التحليل الفني اليومي لبو...QNB Group
 
QNBFS Daily Technical Trader - Qatar for December 19, 2018 التحليل الفني اليو...
QNBFS Daily Technical Trader - Qatar for December 19, 2018 التحليل الفني اليو...QNBFS Daily Technical Trader - Qatar for December 19, 2018 التحليل الفني اليو...
QNBFS Daily Technical Trader - Qatar for December 19, 2018 التحليل الفني اليو...QNB Group
 
QNBFS Daily Technical Trader Qatar - February 16, 2021 التحليل الفني اليومي ل...
QNBFS Daily Technical Trader Qatar - February 16, 2021 التحليل الفني اليومي ل...QNBFS Daily Technical Trader Qatar - February 16, 2021 التحليل الفني اليومي ل...
QNBFS Daily Technical Trader Qatar - February 16, 2021 التحليل الفني اليومي ل...QNB Group
 
QNBFS Daily Technical Trader Qatar - November 20 2019 التحليل الفني اليومي لب...
QNBFS Daily Technical Trader Qatar - November 20 2019 التحليل الفني اليومي لب...QNBFS Daily Technical Trader Qatar - November 20 2019 التحليل الفني اليومي لب...
QNBFS Daily Technical Trader Qatar - November 20 2019 التحليل الفني اليومي لب...QNB Group
 

Similaire à Trading divergences (20)

Technical analysis
Technical analysisTechnical analysis
Technical analysis
 
Rsi pro forex trading system cash back forex rebaitess ( pdf drive ) (2)
Rsi pro forex trading system   cash back forex rebaitess ( pdf drive ) (2)Rsi pro forex trading system   cash back forex rebaitess ( pdf drive ) (2)
Rsi pro forex trading system cash back forex rebaitess ( pdf drive ) (2)
 
QNBFS Daily Technical Trader Qatar - November 14, 2021 التحليل الفني اليومي ل...
QNBFS Daily Technical Trader Qatar - November 14, 2021 التحليل الفني اليومي ل...QNBFS Daily Technical Trader Qatar - November 14, 2021 التحليل الفني اليومي ل...
QNBFS Daily Technical Trader Qatar - November 14, 2021 التحليل الفني اليومي ل...
 
QNBFS Daily Technical Trader Qatar - December 04 2019 التحليل الفني اليومي لب...
QNBFS Daily Technical Trader Qatar - December 04 2019 التحليل الفني اليومي لب...QNBFS Daily Technical Trader Qatar - December 04 2019 التحليل الفني اليومي لب...
QNBFS Daily Technical Trader Qatar - December 04 2019 التحليل الفني اليومي لب...
 
QNBFS Daily Technical Trader Qatar - September 05, 2021 التحليل الفني اليومي ...
QNBFS Daily Technical Trader Qatar - September 05, 2021 التحليل الفني اليومي ...QNBFS Daily Technical Trader Qatar - September 05, 2021 التحليل الفني اليومي ...
QNBFS Daily Technical Trader Qatar - September 05, 2021 التحليل الفني اليومي ...
 
QNBFS Daily Technical Trader Qatar - November 25 2019 التحليل الفني اليومي لب...
QNBFS Daily Technical Trader Qatar - November 25 2019 التحليل الفني اليومي لب...QNBFS Daily Technical Trader Qatar - November 25 2019 التحليل الفني اليومي لب...
QNBFS Daily Technical Trader Qatar - November 25 2019 التحليل الفني اليومي لب...
 
QNBFS Daily Technical Trader Qatar - December 05 2019 التحليل الفني اليومي لب...
QNBFS Daily Technical Trader Qatar - December 05 2019 التحليل الفني اليومي لب...QNBFS Daily Technical Trader Qatar - December 05 2019 التحليل الفني اليومي لب...
QNBFS Daily Technical Trader Qatar - December 05 2019 التحليل الفني اليومي لب...
 
QNBFS Daily Technical Trader Qatar - May 05, 2021 التحليل الفني اليومي لبورصة...
QNBFS Daily Technical Trader Qatar - May 05, 2021 التحليل الفني اليومي لبورصة...QNBFS Daily Technical Trader Qatar - May 05, 2021 التحليل الفني اليومي لبورصة...
QNBFS Daily Technical Trader Qatar - May 05, 2021 التحليل الفني اليومي لبورصة...
 
QNBFS Daily Technical Trader Qatar - October 18, 2021 التحليل الفني اليومي لب...
QNBFS Daily Technical Trader Qatar - October 18, 2021 التحليل الفني اليومي لب...QNBFS Daily Technical Trader Qatar - October 18, 2021 التحليل الفني اليومي لب...
QNBFS Daily Technical Trader Qatar - October 18, 2021 التحليل الفني اليومي لب...
 
QNBFS Daily Technical Trader Qatar - November 12 2019 التحليل الفني اليومي لب...
QNBFS Daily Technical Trader Qatar - November 12 2019 التحليل الفني اليومي لب...QNBFS Daily Technical Trader Qatar - November 12 2019 التحليل الفني اليومي لب...
QNBFS Daily Technical Trader Qatar - November 12 2019 التحليل الفني اليومي لب...
 
QNBFS Daily Technical Trader Qatar - August 12, 2021 التحليل الفني اليومي لبو...
QNBFS Daily Technical Trader Qatar - August 12, 2021 التحليل الفني اليومي لبو...QNBFS Daily Technical Trader Qatar - August 12, 2021 التحليل الفني اليومي لبو...
QNBFS Daily Technical Trader Qatar - August 12, 2021 التحليل الفني اليومي لبو...
 
QNBFS Daily Technical Trader - Qatar for December 27, 2018 التحليل الفني اليو...
QNBFS Daily Technical Trader - Qatar for December 27, 2018 التحليل الفني اليو...QNBFS Daily Technical Trader - Qatar for December 27, 2018 التحليل الفني اليو...
QNBFS Daily Technical Trader - Qatar for December 27, 2018 التحليل الفني اليو...
 
QNBFS Daily Technical Trader Qatar - November 28 2019 التحليل الفني اليومي لب...
QNBFS Daily Technical Trader Qatar - November 28 2019 التحليل الفني اليومي لب...QNBFS Daily Technical Trader Qatar - November 28 2019 التحليل الفني اليومي لب...
QNBFS Daily Technical Trader Qatar - November 28 2019 التحليل الفني اليومي لب...
 
QNBFS Daily Technical Trader Qatar - June 17, 2021 التحليل الفني اليومي لبورص...
QNBFS Daily Technical Trader Qatar - June 17, 2021 التحليل الفني اليومي لبورص...QNBFS Daily Technical Trader Qatar - June 17, 2021 التحليل الفني اليومي لبورص...
QNBFS Daily Technical Trader Qatar - June 17, 2021 التحليل الفني اليومي لبورص...
 
QNBFS Daily Technical Trader - Qatar for December 20, 2018 التحليل الفني اليو...
QNBFS Daily Technical Trader - Qatar for December 20, 2018 التحليل الفني اليو...QNBFS Daily Technical Trader - Qatar for December 20, 2018 التحليل الفني اليو...
QNBFS Daily Technical Trader - Qatar for December 20, 2018 التحليل الفني اليو...
 
QNBFS Daily Technical Trader - Qatar for December 23, 2018 التحليل الفني اليو...
QNBFS Daily Technical Trader - Qatar for December 23, 2018 التحليل الفني اليو...QNBFS Daily Technical Trader - Qatar for December 23, 2018 التحليل الفني اليو...
QNBFS Daily Technical Trader - Qatar for December 23, 2018 التحليل الفني اليو...
 
QNBFS Daily Technical Trader Qatar - August 23, 2021 التحليل الفني اليومي لبو...
QNBFS Daily Technical Trader Qatar - August 23, 2021 التحليل الفني اليومي لبو...QNBFS Daily Technical Trader Qatar - August 23, 2021 التحليل الفني اليومي لبو...
QNBFS Daily Technical Trader Qatar - August 23, 2021 التحليل الفني اليومي لبو...
 
QNBFS Daily Technical Trader - Qatar for December 19, 2018 التحليل الفني اليو...
QNBFS Daily Technical Trader - Qatar for December 19, 2018 التحليل الفني اليو...QNBFS Daily Technical Trader - Qatar for December 19, 2018 التحليل الفني اليو...
QNBFS Daily Technical Trader - Qatar for December 19, 2018 التحليل الفني اليو...
 
QNBFS Daily Technical Trader Qatar - February 16, 2021 التحليل الفني اليومي ل...
QNBFS Daily Technical Trader Qatar - February 16, 2021 التحليل الفني اليومي ل...QNBFS Daily Technical Trader Qatar - February 16, 2021 التحليل الفني اليومي ل...
QNBFS Daily Technical Trader Qatar - February 16, 2021 التحليل الفني اليومي ل...
 
QNBFS Daily Technical Trader Qatar - November 20 2019 التحليل الفني اليومي لب...
QNBFS Daily Technical Trader Qatar - November 20 2019 التحليل الفني اليومي لب...QNBFS Daily Technical Trader Qatar - November 20 2019 التحليل الفني اليومي لب...
QNBFS Daily Technical Trader Qatar - November 20 2019 التحليل الفني اليومي لب...
 

Dernier

House of Commons ; CDC schemes overview document
House of Commons ; CDC schemes overview documentHouse of Commons ; CDC schemes overview document
House of Commons ; CDC schemes overview documentHenry Tapper
 
government_intervention_in_business_ownership[1].pdf
government_intervention_in_business_ownership[1].pdfgovernment_intervention_in_business_ownership[1].pdf
government_intervention_in_business_ownership[1].pdfshaunmashale756
 
Vp Girls near me Delhi Call Now or WhatsApp
Vp Girls near me Delhi Call Now or WhatsAppVp Girls near me Delhi Call Now or WhatsApp
Vp Girls near me Delhi Call Now or WhatsAppmiss dipika
 
(中央兰开夏大学毕业证学位证成绩单-案例)
(中央兰开夏大学毕业证学位证成绩单-案例)(中央兰开夏大学毕业证学位证成绩单-案例)
(中央兰开夏大学毕业证学位证成绩单-案例)twfkn8xj
 
NO1 Certified Black Magic Specialist Expert In Bahawalpur, Sargodha, Sialkot,...
NO1 Certified Black Magic Specialist Expert In Bahawalpur, Sargodha, Sialkot,...NO1 Certified Black Magic Specialist Expert In Bahawalpur, Sargodha, Sialkot,...
NO1 Certified Black Magic Specialist Expert In Bahawalpur, Sargodha, Sialkot,...Amil baba
 
PMFBY , Pradhan Mantri Fasal bima yojna
PMFBY , Pradhan Mantri  Fasal bima yojnaPMFBY , Pradhan Mantri  Fasal bima yojna
PMFBY , Pradhan Mantri Fasal bima yojnaDharmendra Kumar
 
BPPG response - Options for Defined Benefit schemes - 19Apr24.pdf
BPPG response - Options for Defined Benefit schemes - 19Apr24.pdfBPPG response - Options for Defined Benefit schemes - 19Apr24.pdf
BPPG response - Options for Defined Benefit schemes - 19Apr24.pdfHenry Tapper
 
Overview of Inkel Unlisted Shares Price.
Overview of Inkel Unlisted Shares Price.Overview of Inkel Unlisted Shares Price.
Overview of Inkel Unlisted Shares Price.Precize Formely Leadoff
 
(办理学位证)加拿大萨省大学毕业证成绩单原版一比一
(办理学位证)加拿大萨省大学毕业证成绩单原版一比一(办理学位证)加拿大萨省大学毕业证成绩单原版一比一
(办理学位证)加拿大萨省大学毕业证成绩单原版一比一S SDS
 
AnyConv.com__FSS Advance Retail & Distribution - 15.06.17.ppt
AnyConv.com__FSS Advance Retail & Distribution - 15.06.17.pptAnyConv.com__FSS Advance Retail & Distribution - 15.06.17.ppt
AnyConv.com__FSS Advance Retail & Distribution - 15.06.17.pptPriyankaSharma89719
 
(办理原版一样)QUT毕业证昆士兰科技大学毕业证学位证留信学历认证成绩单补办
(办理原版一样)QUT毕业证昆士兰科技大学毕业证学位证留信学历认证成绩单补办(办理原版一样)QUT毕业证昆士兰科技大学毕业证学位证留信学历认证成绩单补办
(办理原版一样)QUT毕业证昆士兰科技大学毕业证学位证留信学历认证成绩单补办fqiuho152
 
The Core Functions of the Bangko Sentral ng Pilipinas
The Core Functions of the Bangko Sentral ng PilipinasThe Core Functions of the Bangko Sentral ng Pilipinas
The Core Functions of the Bangko Sentral ng PilipinasCherylouCamus
 
Governor Olli Rehn: Dialling back monetary restraint
Governor Olli Rehn: Dialling back monetary restraintGovernor Olli Rehn: Dialling back monetary restraint
Governor Olli Rehn: Dialling back monetary restraintSuomen Pankki
 
Unveiling Business Expansion Trends in 2024
Unveiling Business Expansion Trends in 2024Unveiling Business Expansion Trends in 2024
Unveiling Business Expansion Trends in 2024Champak Jhagmag
 
letter-from-the-chair-to-the-fca-relating-to-british-steel-pensions-scheme-15...
letter-from-the-chair-to-the-fca-relating-to-british-steel-pensions-scheme-15...letter-from-the-chair-to-the-fca-relating-to-british-steel-pensions-scheme-15...
letter-from-the-chair-to-the-fca-relating-to-british-steel-pensions-scheme-15...Henry Tapper
 
SBP-Market-Operations and market managment
SBP-Market-Operations and market managmentSBP-Market-Operations and market managment
SBP-Market-Operations and market managmentfactical
 
magnetic-pensions-a-new-blueprint-for-the-dc-landscape.pdf
magnetic-pensions-a-new-blueprint-for-the-dc-landscape.pdfmagnetic-pensions-a-new-blueprint-for-the-dc-landscape.pdf
magnetic-pensions-a-new-blueprint-for-the-dc-landscape.pdfHenry Tapper
 
2024 Q1 Crypto Industry Report | CoinGecko
2024 Q1 Crypto Industry Report | CoinGecko2024 Q1 Crypto Industry Report | CoinGecko
2024 Q1 Crypto Industry Report | CoinGeckoCoinGecko
 

Dernier (20)

🔝+919953056974 🔝young Delhi Escort service Pusa Road
🔝+919953056974 🔝young Delhi Escort service Pusa Road🔝+919953056974 🔝young Delhi Escort service Pusa Road
🔝+919953056974 🔝young Delhi Escort service Pusa Road
 
House of Commons ; CDC schemes overview document
House of Commons ; CDC schemes overview documentHouse of Commons ; CDC schemes overview document
House of Commons ; CDC schemes overview document
 
Monthly Economic Monitoring of Ukraine No 231, April 2024
Monthly Economic Monitoring of Ukraine No 231, April 2024Monthly Economic Monitoring of Ukraine No 231, April 2024
Monthly Economic Monitoring of Ukraine No 231, April 2024
 
government_intervention_in_business_ownership[1].pdf
government_intervention_in_business_ownership[1].pdfgovernment_intervention_in_business_ownership[1].pdf
government_intervention_in_business_ownership[1].pdf
 
Vp Girls near me Delhi Call Now or WhatsApp
Vp Girls near me Delhi Call Now or WhatsAppVp Girls near me Delhi Call Now or WhatsApp
Vp Girls near me Delhi Call Now or WhatsApp
 
(中央兰开夏大学毕业证学位证成绩单-案例)
(中央兰开夏大学毕业证学位证成绩单-案例)(中央兰开夏大学毕业证学位证成绩单-案例)
(中央兰开夏大学毕业证学位证成绩单-案例)
 
NO1 Certified Black Magic Specialist Expert In Bahawalpur, Sargodha, Sialkot,...
NO1 Certified Black Magic Specialist Expert In Bahawalpur, Sargodha, Sialkot,...NO1 Certified Black Magic Specialist Expert In Bahawalpur, Sargodha, Sialkot,...
NO1 Certified Black Magic Specialist Expert In Bahawalpur, Sargodha, Sialkot,...
 
PMFBY , Pradhan Mantri Fasal bima yojna
PMFBY , Pradhan Mantri  Fasal bima yojnaPMFBY , Pradhan Mantri  Fasal bima yojna
PMFBY , Pradhan Mantri Fasal bima yojna
 
BPPG response - Options for Defined Benefit schemes - 19Apr24.pdf
BPPG response - Options for Defined Benefit schemes - 19Apr24.pdfBPPG response - Options for Defined Benefit schemes - 19Apr24.pdf
BPPG response - Options for Defined Benefit schemes - 19Apr24.pdf
 
Overview of Inkel Unlisted Shares Price.
Overview of Inkel Unlisted Shares Price.Overview of Inkel Unlisted Shares Price.
Overview of Inkel Unlisted Shares Price.
 
(办理学位证)加拿大萨省大学毕业证成绩单原版一比一
(办理学位证)加拿大萨省大学毕业证成绩单原版一比一(办理学位证)加拿大萨省大学毕业证成绩单原版一比一
(办理学位证)加拿大萨省大学毕业证成绩单原版一比一
 
AnyConv.com__FSS Advance Retail & Distribution - 15.06.17.ppt
AnyConv.com__FSS Advance Retail & Distribution - 15.06.17.pptAnyConv.com__FSS Advance Retail & Distribution - 15.06.17.ppt
AnyConv.com__FSS Advance Retail & Distribution - 15.06.17.ppt
 
(办理原版一样)QUT毕业证昆士兰科技大学毕业证学位证留信学历认证成绩单补办
(办理原版一样)QUT毕业证昆士兰科技大学毕业证学位证留信学历认证成绩单补办(办理原版一样)QUT毕业证昆士兰科技大学毕业证学位证留信学历认证成绩单补办
(办理原版一样)QUT毕业证昆士兰科技大学毕业证学位证留信学历认证成绩单补办
 
The Core Functions of the Bangko Sentral ng Pilipinas
The Core Functions of the Bangko Sentral ng PilipinasThe Core Functions of the Bangko Sentral ng Pilipinas
The Core Functions of the Bangko Sentral ng Pilipinas
 
Governor Olli Rehn: Dialling back monetary restraint
Governor Olli Rehn: Dialling back monetary restraintGovernor Olli Rehn: Dialling back monetary restraint
Governor Olli Rehn: Dialling back monetary restraint
 
Unveiling Business Expansion Trends in 2024
Unveiling Business Expansion Trends in 2024Unveiling Business Expansion Trends in 2024
Unveiling Business Expansion Trends in 2024
 
letter-from-the-chair-to-the-fca-relating-to-british-steel-pensions-scheme-15...
letter-from-the-chair-to-the-fca-relating-to-british-steel-pensions-scheme-15...letter-from-the-chair-to-the-fca-relating-to-british-steel-pensions-scheme-15...
letter-from-the-chair-to-the-fca-relating-to-british-steel-pensions-scheme-15...
 
SBP-Market-Operations and market managment
SBP-Market-Operations and market managmentSBP-Market-Operations and market managment
SBP-Market-Operations and market managment
 
magnetic-pensions-a-new-blueprint-for-the-dc-landscape.pdf
magnetic-pensions-a-new-blueprint-for-the-dc-landscape.pdfmagnetic-pensions-a-new-blueprint-for-the-dc-landscape.pdf
magnetic-pensions-a-new-blueprint-for-the-dc-landscape.pdf
 
2024 Q1 Crypto Industry Report | CoinGecko
2024 Q1 Crypto Industry Report | CoinGecko2024 Q1 Crypto Industry Report | CoinGecko
2024 Q1 Crypto Industry Report | CoinGecko
 

Trading divergences

  • 2. Topics:  RSI  RSI Math's  Internal Characteristics  Ratio Analysis  Trend Determination  Range Shift  Various patterns n their Reliability.  Math Error/Divergence  Classification of Divergence.  Simple Divergence  Calculation of Divergence.  Cheat sheet of Simple Divergence  Hidden Divergence  Cheat Sheet of Hidden Divergence  Multiple Divergence  Cheat Sheet of multiple Divergence  Conclusion
  • 3. Relative Strength Index(RSI)  In June 1978, Welles Wilder introduced the Relative Strength Index.  It represents a ratio of the average 'gains' to the average 'losses' calculated over a number of time periods.  It is a formula based indicator which is usually assume to test the strength and movement in the market.  It is a range bound Oscillator which has upper boundary at 100 & lower boundary at 0.  RSI is considered overbought when above 70 and oversold when below 30.  Signals can also be generated by looking for divergences, failure swings and centerline crossovers.  RSI can also be used to identify the general trend.
  • 4. RSI MATHS  RSI Formula can be defined as RSI = 100 - 100 (1+RS) RS is defined as ratio between average gain to average loss over a certain period of time Average Gain over “n” period of times Average Loss over “n” period of times Where n can be defined by user Generally it is used as 14 days of period.
  • 6. Ratio Analysis  The RSI behaves like a logarithmic curve.  Anytime the ratio exceeds 10: 1 , the market has been experiencing a very strong move up.  Anytime the ratio exceeds 1 : 10, the market has been experiencing a very strong down move.  The largest increase or decrease in the RSI value occurs when the ratio changes from 1 : 1 to the next whole number (2: 1 or 1 :2).  The RSI value experiences its largest changes in value as it oscillates between the index values of 40 and 60.  In other words the RSI is most sensitive to price change when the RSI is oscillating between 40 and 60.  When the ratio is 20: 1 , The RSI value at this time is only 95.24/4.76. This is a market condition that almost never occurs when the look back period is 14 bars.
  • 7.
  • 8. Determination Of Trend  In a Bull market RSI value tends to travel in between 40-80 zones.  In a Bear Market RSI value tends to travel in Between 60-20 zones.  In Sideways market RSI Value tends to travel in between 40-65 zones.  In extreme or very strong Bull market RSI bound in 60-90 levels.  In extreme or very strong Bear market RSI bound in 40-10 levels.  Value above 95 and below 5 are very rare. As above or below this this level RSI behave logarithmically means change in RS is very minute to notice .  Above levels are applicable in any timeframe.
  • 9.
  • 10.
  • 11.
  • 12.
  • 13.
  • 14.
  • 15.
  • 16. Range Shift  Range Shift simply means when a security changes its trend . 1. From uptrend to downtrend. 2. From Downtrend to uptrend. 3. From Sideways to uptrend/downtrend. 4. From Uptrend/Downtrend to Sideways.
  • 17.
  • 18.
  • 19.
  • 20.
  • 21.
  • 22. Various Patterns n Their Reliability  M pattern  W pattern  V pattern  Double Top/Bottom  Head n Shoulder  Flag  Triangles  Spring  Wedges
  • 23.
  • 24.
  • 25.
  • 26.
  • 27.
  • 28.
  • 29.
  • 30. Math's Error or Divergence  It can be define as whenever there is a misunderstanding b/w price n indicator they used to get divert from each other and moved in opposite direction to each other.
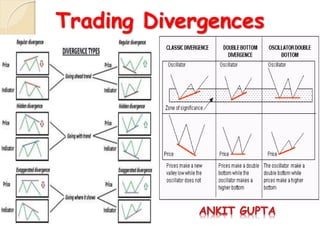
  • 31. Classification Of Divergence Divergence Simple or Classic Bullish Bearish Multiple Bullish & Bearish Simple / Hidden Hidden Bullish Bearish
  • 32. Simple or Classic Divergence  Whenever price makes a higher high n RSI makes lower high then it is said to be Simple Bearish Divergence.  Whenever price makes a lower low n RSI makes higher low then it is said to be Simple Bullish Divergence.  Simple Bullish Divergence occur in bear market, commonly known as short covering.  Simple Bearish Divergence occur in bull market, commonly known as retracement or correction.
  • 33.
  • 34. Calculation of Divergence For Bullish Divergence: D=(P–T) DT=(P+D) Where , P =Value of peak in b/w 2 troughs, T=Lowest value of trough, D = Difference of P & T, DT = Divergence Target. For Bearish Divergence: D=(P–T) DT=(T-D) Where , P=Highest Value of Peak, T=Value of valley in b/w 2 peaks, D = Difference of P & T , DT = Divergence Target.
  • 35.
  • 36.
  • 37.
  • 38.
  • 39.
  • 40.
  • 41. Key Points For Simple Divergence  A simple bullish divergence is more reliable when RSI value lies between 40 to 10 .  A simple bearish divergence is more reliable when RSI value lies between 80 to 65 .  Lesser the no. of candles between 2 troughs or peaks more powerful will be reversal in terms of price n time both.
  • 42. Hidden Divergence  Whenever RSI makes a Higher high & price makes a lower high then it is said to be Bearish Hidden Divergence.  Whenever RSI makes a lower low & price makes a higher low then it is said to be Bullish Hidden Divergence.
  • 43.
  • 44.
  • 45.
  • 46.
  • 47.
  • 48.
  • 49. Key Points For Hidden Divergence  Hidden divergence mostly occur between 40 to 65 level as RSI value.  A bullish hidden divergence is strongest when it occur near 40 level with W or double bottom pattern.  A bearish hidden divergence is strongest when it occur near 65 level with M or double top pattern.  Usually highest volume is witness in reversal candle as compared to last 5-8 candles near its resistance at 65 or support at 40 in RSI .
  • 50. Multiple Divergence  Whenever price makes a series of lower low n RSI makes a series of higher low it known to be Multiple Simple Bullish Divergence.  Whenever price makers a series of higher high n RSI makes a series of lower high it is known to be Multiple Simple Bearish Divergence.  Whenever RSI makes a series of lower low n Price makes a series of higher low it is known to be Multiple Hidden Bullish Divergence.  Whenever RSI makes a series of Higher high n Price makes a series of lower high it is known to be Multiple Hidden Bearish Divergence.
  • 51.
  • 52.
  • 53.
  • 54.
  • 55.
  • 56.
  • 57. Key Points For Multiple Divergence  Multiple Bullish Divergence are more reliable when RSI value lies between 40 -10 along with triple bottom , falling wedge , H &S formation formed either in RSI or in price.  Multiple Bearish Divergence are more reliable when RSI value lies between 65-80 along with triple top , rising wedge, H&S formation formed wither in RSI or in price.  Multiple hidden divergence are more reliable when RSI value lies between 40-65 along with spring ,triangle, flag or combination of three is formed either in Price or RSI.  Multiple Divergence are the strongest & most reliable trend reversal signal .  Valid for all timeframe.
  • 59.