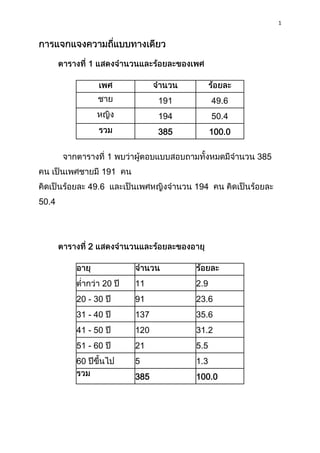
SlideShare a Scribd company logo
1 of 48
1


                           191         49.6
                           194         50.4
                           385         100.0

                                               385
               191
           96                    94
0.4


           2


               20    11          2.9
      20 - 30        91          23.6
      31 - 40        137         35.6
      41 - 50        120         31.2
      51 - 60        21          5.5
      60             5           1.3
                     385         100.0
2


         2                                         385
        20            11                     2.9    20-30
 91                          23.6   31-40          137
        35.6         41-50          120                  31.2
51-60            21                   5.5          60
 5                     1.3


        3


             5,000
                       6              1.6

      5,000 – 10,000
                       16             4.2

      10,001 –
                       101            26.2
      15,000
      15,001 –
                       140            36.4
      20,000
      20,000
                       122            31.7

                       385            100.0
3


                                    3
385                                 5,000                           6                   1.6
      5,000-10,000                                  16                           4.2
10.001-15,000                                 101                              26.2
15,001-20,000                               140                           36.4
20,000                                  122                             31.7


           4


                            /
                                        137                     35.6

                                        81                      21.0
                    /
                                        115                     29.9

                                        24                      6.2
                        /
                                        12                      3.1

                                        7                       1.8
                                        9                       2.3
                                        385                     100.0

                            4                                                          385
                                /                             137                      35.6
                                                         81                            21.0
                /                                        115                           29.9
4


                       24                               6.2
         /             12                 3.1
7                1.8                                9
        2.3
5


                              3           2.5
                             69          57.0
                             25          20.7
                             24          19.8
                            121         100.0
    4                                     121


                                    8             6.6
                                   91            75.2
                                   22            18.2
         Total                    121           100.0
5


5                  121


              22    18.2
              51    42.1
              48    39.7
     Total   121   100.0
6                  121


               6         5.0
              16      13.2
              70      57.9
              29      24.0
    Total    121     100.0
6                  121
6


              5           4.1
             32          26.4
             58          47.9
             26          21.5
    Total   121         100.0
7                 121
7


              1                .8
             10               8.3
             23              19.0
             52              43.0
             35              28.9
    Total   121             100.0
8                     121


                  3                 2.5
              16                13.2
              36                29.8
              48                39.7
              18                14.9
Total        121               100.0
9                     121
8


           1           .8
          14         11.6
          36         29.8
          52         43.0
          18         14.9
 Total   121     100.0
10             121
9


           1            .8
          10           8.3
          42          34.7
          60          49.6
           8           6.6
 Total   121         100.0
11             121


           7          5.8
          15         12.4
          43         35.5
          30         24.8
          26         21.5
 Total   121     100.0
10


12            121


          4          3.3
         15         12.4
         39         32.2
         44         36.4
         19         15.7
Total   121     100.0
13            121
11


          8           6.6
         20          16.5
         24          19.8
         50          41.3
         19          15.7
Total   121         100.0
14                  121


               11           9.1
               12           9.9
               39      32.2
               37      30.6
               22      18.2
Total         121     100.0
15                  121
12


          8           6.6
         21          17.4
         42          34.7
         35          28.9
         15          12.4
Total   121         100.0
16            121
13


2
14


           1

               เพศ * รายได้ตอเดือน Crosstabulation
                            ่
                                            รายได้ตอ เดือน
                                                   ่
                           ต่่ากว่า 5000 - 10001 - 15001 - 20000
                         5000 บาท    10000 บาท15000 บาท 20000 บาท นไป Total
                                                                 บาทขึ้
เพศ ชาย Count                       3       9        64       63     52 191
           % within เพศ        1.6%     4.7% 33.5% 33.0% 27.2%100.0%
           % within รายได้ต50.0% 56.3% 63.4% 45.0% 42.6% 49.6%
                            ่อ เดือน
           % of Total            .8%    2.3% 16.6% 16.4% 13.5% 49.6%
      หญิง Count                    3       7        37       77     70 194
           % within เพศ        1.5%     3.6% 19.1% 39.7% 36.1%100.0%
           % within รายได้ต50.0% 43.8% 36.6% 55.0% 57.4% 50.4%
                             ่อ เดือน
           % of Total            .8%    1.8%     9.6% 20.0% 18.2% 50.4%
Total      Count                    6      16      101      140     122 385
           % within เพศ        1.6%     4.2% 26.2% 36.4% 31.7%100.0%
           % within รายได้100.0% 100.0% 100.0% 100.0%100.0%100.0%
                          ต่อ เดือน
           % of Total          1.6%     4.2% 26.2% 36.4% 31.7%100.0%

                                                                  5,000
                3                      1.6                           50
                                0.8                      5,000-10,000
               9                       4.7                         56.3
                               2.3                      10,001-15,000
               64                      33.5                        63.4
                                     16.6                      15,001-
  20,000               63                     33
  45                                  16.4                      20,000
15


                    52                      27.2
42.6                                13.5
                                                                  5,000
             3                         1.5                          50
                              0.8                          5,000-10,000
             7                       3.6                           43.8
                          1.8                             10,001-15,000
             37                      19.1                          36.6
                              9.6                         15,001-20,000
             77                       39.7                          55
                                            20
20,000                   70                                36.1
                 57.4                              18.2


         2
16


                            เพศ * อาชีพ Crosstabulation
                                                  อาชีพ
                    รับราชการพนักงานเ ค้าขาย /
                                /                           นักเรียน /
                    รัฐวิส าหกิจ อกชน ธุรกิ จส่วนตัวรับจ้าง นักศึกษา เกษตรกร ื่ นๆ........ Total
                                                                            อ
เพศ ชาย Count               62     37          61       17         5      5          4      191
           % within เพศ32.5% 19.4% 31.9% 8.9% 2.6% 2.6% 2.1%100.0%
           % within อาชีพ
                       45.3% 45.7% 53.0% 70.8% 41.7% 71.4% 44.4% 49.6%
           % of Total 16.1% 9.6% 15.8% 4.4% 1.3% 1.3% 1.0% 49.6%
      หญิง Count            75     44          54         7        7      2          5      194
           % within เพศ38.7% 22.7% 27.8% 3.6% 3.6% 1.0% 2.6%100.0%
           % within อาชีพ
                       54.7% 54.3% 47.0% 29.2% 58.3% 28.6% 55.6% 50.4%
           % of Total 19.5% 11.4% 14.0% 1.8% 1.8%                      .5% 1.3% 50.4%
Total      Count           137     81         115       24        12      7          9      385
           % within เพศ35.6% 21.0% 29.9% 6.2% 3.1% 1.8% 2.3%100.0%
           % within อาชีพ
                      100.0%100.0% 100.0%100.0%100.0%100.0%100.0%100.0%
           % of Total 35.6% 21.0% 29.9% 6.2% 3.1% 1.8% 2.3%100.0%


                                                                              /
              62                             132.5                                     43.3
                                          16.1
              37                             19.4                                      45.7
                                         9.6                                /
              61                                  31.9                                    53
                                         15.8                                       17
                        8.9                                             70.8
                           4.4                                /                       5
                          2.6                                          41.7
                              1.3                                                     5
                          2.6                                          71.4
                           1.3                                     4
17


2.1                    44.4                                     1


                                                       /
      75                      38.7                         54.7
                        19.5
      44                      22.7                         54.3
                        11.4                        /
      54                        27.8                           47
                        14                                 7
           3.6                                    29.2
               1.8                     /                   7
               3.6                              58.3
                 1.8                                       2
           1                               28.6
               0.5                          5
2.6                    55.6                                    1.3
18


           3
                      เพศ * อายุ Crosstabulation
                                             อายุ
                  ต่่ากว่า 20 20 - 30 ปี - 40 ปี - 50 ปี - 60 60 ปีขึ้นไป Total
                              ปี       31      41      51      ปี
เพศ ชาย Count               5       27      64      79      12        4    191
           % within เพศ2.6% 14.1% 33.5% 41.4% 6.3% 2.1%100.0%
           % within อายุ
                      45.5% 29.7% 46.7% 65.8% 57.1% 80.0% 49.6%
           % of Total 1.3% 7.0% 16.6% 20.5% 3.1% 1.0% 49.6%
      หญิง Count            6       64      73      41       9        1    194
           % within เพศ3.1% 33.0% 37.6% 21.1% 4.6%                .5%100.0%
           % within อายุ
                      54.5% 70.3% 53.3% 34.2% 42.9% 20.0% 50.4%
           % of Total 1.6% 16.6% 19.0% 10.6% 2.3%                 .3% 50.4%
Total      Count           11       91    137     120       21        5    385
           % within เพศ2.9% 23.6% 35.6% 31.2% 5.5% 1.3%100.0%
19


                     20         5
2.6             45.5
      1.3     20-25         27
14.1            29.7
      7      31-40         64
33.5            46.7
      16.6     41-50            79
41.4            65.8
      20.5     51-60            12
6.3            57.1
      3.1     60                 4
2.1            80
      1
                      20        6
3.1             54.5
      1.6     20-25         64
33            70.3
      16.6     31-40            73
20


    37.6           53.3
          19     41-50    41
    21.1           34.2
          10.6    51-60    9
    4.6           42.9
          2.3    60            1
    0.5           20
          0.3

4
21


                                 อายุ * อาชีพ Crosstabulation
                                                         อาชีพ
                         รับราชการพนั กงานเ ค้าขาย /
                                     /                             นั กเรียน /
                         รัฐวิส าหกิจ อกชน ธุรกิ จส่ วนตัวรับจ้ าง นั กศึกษา เกษตรกร ื่ นๆ........ Total
                                                                                    อ
อายุ ต่่ากว่า 20Count
                  ปี              6       2            2         0         1      0          0       11
                % within อายุ
                            54.5% 18.2% 18.2%               .0% 9.1%           .0%       .0%100.0%
                % within อาชี4.4% 2.5%
                              พ                  1.7%       .0% 8.3%           .0%       .0% 2.9%
                % of Total 1.6%        .5%        .5%       .0%        .3%     .0%       .0% 2.9%
      20 - 30 ปีCount            58      19          13          0         1      0          0       91
                % within อายุ
                            63.7% 20.9% 14.3%               .0% 1.1%           .0%       .0%100.0%
                % within อาชีพ
                            42.3% 23.5% 11.3%               .0% 8.3%           .0%       .0% 23.6%
                % of Total 15.1% 4.9%            3.4%       .0%        .3%     .0%       .0% 23.6%
      31 - 40 ปีCount            46      20          53          7         5      2          4      137
                % within อายุ
                            33.6% 14.6% 38.7% 5.1% 3.6% 1.5% 2.9%100.0%
                % within อาชีพ
                            33.6% 24.7% 46.1% 29.2% 41.7% 28.6% 44.4% 35.6%
                % of Total 11.9% 5.2% 13.8% 1.8% 1.3%                          .5% 1.0% 35.6%
      41 - 50 ปีCount            24      34          36       16           0      5          5      120
                % within อายุ
                            20.0% 28.3% 30.0% 13.3%                    .0% 4.2% 4.2%100.0%
                % within อาชีพ
                            17.5% 42.0% 31.3% 66.7%                    .0% 71.4% 55.6% 31.2%
                % of Total 6.2% 8.8%             9.4% 4.2%             .0% 1.3% 1.3% 31.2%
      51 - 60 ปีCount             3       6            8         1         3      0          0       21
                % within อายุ
                            14.3% 28.6% 38.1% 4.8% 14.3%                       .0%       .0%100.0%
                % within อาชี2.2% 7.4%
                              พ                  7.0% 4.2% 25.0%               .0%       .0% 5.5%
                % of Total     .8% 1.6%          2.1%       .3%        .8%     .0%       .0% 5.5%
      60 ปีขึ้นไป
                Count             0       0            3         0         2      0          0         5
                % within อายุ .0%      .0% 60.0%            .0% 40.0%          .0%       .0%100.0%
                % within อาชีพ .0%     .0%       2.6%       .0% 16.7%          .0%       .0% 1.3%
                % of Total     .0%     .0%        .8%       .0%        .5%     .0%       .0% 1.3%
Total           Count           137      81        115        24          12      7          9      385
                % within อายุ
                            35.6% 21.0% 29.9% 6.2% 3.1% 1.8% 2.3%100.0%
                % within อาชีพ
                           100.0%100.0% 100.0%100.0%100.0%100.0%100.0%100.0%
                % of Total 35.6% 21.0% 29.9% 6.2% 3.1% 1.8% 2.3%100.0%


                                                                             20
                             /                            6                                54.5
                                             4.4
22


1.6                                                2                          18.2
                                   2.5
0.5                  /                                 2                      18.2
                                   2.5
0.5                                 0                           0
              0                                                                    0
                     /                             1                              9.1
                                   8.3
0.3                                        0                        0
              0                                                                    0
                         0                         0
0                                  0
      20-30                                    /                        58
              63.7                                         42.3
               15.1                                                          19
         20.9                                              23.5
               4.9                                     /                          13
               14.3                                            11.3
              3.4                                          0
0                                   0                                              0
                     /                             1                              1.1
                             8.3                                                  0.3
                                       0                        0
         0                                                 0
23


        0                            0                                      0
                              0
      31-40                              /                       46
              33.6                                    33.6
                  11.9                                                20
            14.6                                      24.7
                  5.2                        /                             53
                  38.7                                    46.1
                   13.8                                               7
            5.1                                      29.2
                  1.8                            /                     5
             3.6                                 41.7
                        3.1                                           2
             1.5                                 28.6
                  0.5                                 4
2.9                               44.4                                      1


      41-50                              /                       24
              20                                     17.5
                  6.2                                                 34
            28.3                                     42
                  8.8                        /                             36
                  30                                  31.3
                  9.4                                            16
            3.3                                      66.7
24


               4.2                                        /                              0
         0                                0
0                               5                                      4.2
         71.4                                                  4.3
     5                              4.2                                                  55.6
                          1.3
    51-60                                 /                                      3
             14.3                                               2.2
               0.8                                                                       6
         28.6                                                 7.4
              1.6                                 /                                      8
         38.1                                                      7
                2.1                                                              1
         4.8                                                  4.2
               0.3                                    /                              3
             14.3                                             25
                   0.8                                                       0
         0                                                0
              0                                           0                                  0
                      0                                                 0
    60                                        /                                      0
         0                                                0
               0                                                                     0
         0                                                0
               0                                  /                                      3
25


                 60                                          2.6
                        0.8                                                0
                 0                                       0
                      0                              /                         2
                   40                                    16.7
                          0.5                                          0
                 0                                       0
                      0                                  0                         0
                              0                                    0


          5


                  อายุ * รายได้ตอเดือน Crosstabulation
                                ่
                                               รายได้ตอ เดือน
                                                      ่
                                ต่่ากว่า 5000 - 10001 - 15001 - 20000
                              5000 บาท  10000 บาท
                                                15000 บาท 20000 บาท บาทขึนไป Total
                                                                         ้
อายุ ต่่ากว่า 20Count
                 ปี                    0       0         2        3        6   11
                % within อายุ       .0%     .0% 18.2% 27.3% 54.5%100.0%
                % within รายได้ต่อ เดือน
                                    .0%     .0%     2.0%      2.1% 4.9% 2.9%
                % of Total          .0%     .0%      .5%       .8% 1.6% 2.9%
     20 - 30 ปี Count                  2       6         5       57     21     91
                % within อายุ     2.2%     6.6%     5.5% 62.6% 23.1%100.0%
26


           20
5000   0        0
27


               0                                           0
       5000-10000              0                           0
               0                                               0
       10001-15000                 2                           18.2
               2.0                                              0.5
                     15001-20000                 3
27.3                        2.1
                     0.8                      20000                        6
                     54.5                        4.9
                     1.6
         20-30                     5000                    2
               2.2                            33.3
                     0.5                      5000-10000               6
               6.6                            37.5
                     1.6                      10001-15000
5                     5.5                            5.0
                                       1.3                            15001-
20000           57                     62.6
40.7                                           14.8
       20000                   21                          23.1
               17.2
5.5
         31-40                     5000                    4
               2.9                            66.7
                     1.0                  5000-10000                       8
28


                 5.8                            50.0
                                   2.1                          10001-
15000        43                   31.4
42.6                                        11.2
       15001-20000        37                           27.0
            26.4                                              9.6
                  20000                      45
32.8                      36.9
                 11.7
         41-50                   5000                   0
             0                          0
                 0                  5000-10000                       2
                 1.7                            12.5
                                   0.5                          10001-
15000        45                   37.5
44.6                                        11.7
       15001-20000        40                           33.3
            28.6                                              10.4
                  20000                      33
27.5                      27.0
                 8.6
         51-60                   5000                   0
             0                          0
                 0                  5000-10000                       0
                 0                          0
29


                  0             10001-15000              5
              23.8                    5.0
                  1.3                15001-20000             3
                  14.3                      2.1
                               0.8
      20000              13                       61.9
              10.7
3.4
        60                    5000                0
              0                  0
                  0             5000-10000                   0
                  0                   0
                  0             10001-15000              1
              20.0                    1.0
                  0.3                15001-20000             0
                  0                   0
                  0             20000                        4
                  80.0                    3.3
                  1.0
30


    1


         N   Mean


1       385 2.0130

2       385 4.1740
        385 3.0935

3       385 4.0701

4       385 3.9610
5       385 3.9558
6       385 4.0026
31


                                385 3.9974

 7                              385 3.8761

 8                              385 3.8983
 9                              385 3.5377
 10                             385 3.3403
                                385 3.6656

 11                             385 3.4130

 12                             385 3.3455
 13                             385 3.3247
 14                             385 3.1117
                                385 3.2987
                                385 3.5138


         4.50 - 5.00
         3.50 - 4.49
         2.50 - 3.49
         1.50 - 2.49
         1.00 - 1.49


                       3.5138


3.0935
32


4.1740                     2.0130


3.9974
                                             4.0701


                  4.0026
                                             3.9610
                              3.9558


         3.6656


                                    3.8983


3.8983                                          3.5
377                            3.3403


         3.2987


                  3.4130
                       3.3455
                                             3.3247
                                                3.1
117
33


     2


         5000-10000


                      N Mean
                                 D

1                     7 1.0000

2                     7 4.5714
                      7 3.0935

3                     7 4.5714

4                     7 4.1429
5                     7 4.4286
6                     7 4.4286
                      7 3.9974

7                     7 4.4286

8                     7 4.2857
9                     7 3.8571
10                    7 3.2857
                      7 3.6656

11                    7 3.0000

12                    7 2.5714
13                    7 2.5714
34


 14                                                          7 2.0000
                                                             7 3.2987
                                                             7 3.5138


                                           5000-10000
                         3.5138

3.0935


4.5714                            1.0000


3.9974
                                           4.5714
                                   4.4286
         4.4286                                     4.1429


           3.6656


                                      4.4286
                                           4.2857
                                     3.8571
                    3.2857


           3.2987
35


              3.0000


2.5714


2.5714
   2.0000


                   One-Sample Statistics
                                               Std. Error
                          N    MeanStd. DeviationMean
            ด้านการบริ ก าร
                          385 3.0935   .73000 .03720
36


                       One-Sample Test
                              Test Value = 3.0
                                               95% Confidence
                                                Interval of the
                                Sig.    Mean      Difference
                  t       df (2-tailed)
                                      DifferenceLower Upper
     ด้านการบริการ
               2.513      384    .012 .09351 .0204 .1667


                                                         t     Sig.

                       3.0      3.0935        0.73000   2.51   0.01
                                                         3      2


                                         0
               H0: µ1             = 3.0
                       H1: µ1            ≠   3.0
           Sig = 0.012< 0.05
                                    H0
H1
                                               3.0
 0
37


                         (t-test dependent)

                                 Group Statistics

                                                                  Std.        Std.
                                                               Deviatio      Error
                                             N       Mean           n       Mean
                                                     4.002                   .0383
                                             191                 .53001
                                                           6                       5
                                                     3.992                   .0398
                                             194                 .55460
                                                           3                       2


                            Independent Samples Test
                      Levene's Test for
                     Equality of Variances            t-test for Equality of Means
                                                                                  95% Confidence
                                                                                   Interval of the
                                                          Sig.    Mean Std. Error Difference
                            F    Sig.     t        df (2-tailed)Difference
                                                                         DifferenceLower Upper
ด้านการให้บริก variances assumed .499
          Equal            .458          .187      383     .832 .01035 .05500-.09829 .11903
ารของบุคลากร variances not
          Equal
                                         .197382.662       .852 .01035 .05528-.09835 .11905
          assumed


                                                                                                     t

                                             191     4.0026              0.53001              0.187
                                             194     3.9923              0.55460              0.197
38


              H0:σ2     =   σ2
              H1:     ≠σ2

              Sig =    499>α 0.05
                                 H0


             H0 : µ          =µ
    H1 : µ       ≠µ
        Sig. = 0.832>α 0.05
                                                      2


t             0.187                   Sig(2-tailed)

0.832                  α(0.05)                        H0

                                                      H1


                                 ANOVA
39


                  Sum
                   of
              Squar                    Mean
                   es         df       Square       F      Sig.
    Between
                  5.526       3         .854       3.247   .027
    Groups
    Within        107.2
                          378           .387
    Groups         21
     Total        112.7
                          384
                   47


          H   µ                                    =µ

     =µ                                        =

µ

     H


                                   1
     Sig 0.027 > 0.01
              H           H


                                   1
40


                            ANOVA


                Sum
                   of
                Squar                    Mean
                   es       df       Square      F        Sig.
    Between
                   .010          1        .010   .035     .852
    Groups
    Within      112.7
                            383           .294
    Groups          37
    Total       112.7
                            384
                    47


               H        µ                            =µ

       =µ                                   =

µ

       H


                                     1

             Sig 0.852 > 0.01
41


       H         H


                      1


               Correlations
                                       ด้านลักษณะ
                            ด้านการบริก าร
                                      ทางกายภาพ
ด้านการบริก าร Pearson Correlation 1       -.068
               Sig. (2-tailed)              .180
               N                   385       385
ด้านลักษณะทางกายภาพ Correlation
               Pearson           -.068         1
               Sig. (2-tailed)    .180
               N                   385       385
42


H0:  =0
H1 :  ≠ 0
r= -0.068
sig= 0.180>α 0.01
       H0


                                                                    -0.068


                        Correlations
                                  ด้านการให้
                                  บริก ารของ นการส่งเส
                                          ด้า
                                   บุคลากร มการตลาด
                                           ริ
    ด้านการให้บริการของบุค Correlation1
                    Pearson                   -.144**
    ลากร            Sig. (2-tailed)            .005
                    N                  385      385
    ด้านการส่งเสริมการตลาด Correlation
                    Pearson          -.144**      1
                    Sig. (2-tailed) .005
                    N                  385      385
      **.Correlation is significant at the 0.01 level (2-tailed).

H0:  =0
H1 :  ≠ 0
r= -0.144
sig= 0.005<α 0.01
43


H1


     -0.144
44


                        Chi-Square Tests
                                            Asymp. Sig.
                             Value       df (2-sided)
             Pearson Chi-Square a
                             8.139         6    .228
             Continuity Correction
             Likelihood Ratio8.315          6      .216
             Linear-by-Linear
                             2.366          1      .124
             Association
             N of Valid Cases 385
              a.4 cells (28.6%) have expected count less than 5. The
                minimum expected count is 3.47.


H0:


H1:


      Sig 0.228>α0.05

        H0


                                         8.139
45


                                       20


Case Processing Summary
               N    %
  CasesValid    20 100.0
             a
       Excluded 0     .0
       Total    20 100.0
   a.Listwise deletion based on all variables in the procedure.


  Reliability Statistics
    Cronbach's
      Alpha N of Items
        .541      14
46


               Item-Total Statistics
                                     Scale Corrected Cronbach's
                    Scale Mean Variance if
                                  if       Item-Total Alpha if
                    Item Deleted Deleted
                                Item       Correlation Deleted
                                                    Item
มี การให้บรการที่หลากหลา
              ิ
                        47.4500 25.418        -.148      .585
ย
เปิดให้บริการต่างๆตรงตา
                        46.8000 25.116        -.132      .552
มความต้อ งการของลูก ค้า
พนักงานที่มความรูคอยให้
                ี     ้
                        46.6500 22.661         .222      .520
ค่าแนะน่า
ให้บริก ารมีคุณภาพมีม นุษ
                        46.9000 23.463         .072      .548
ย์สัมพันธ์
ดูแลเอาใจใส่ก ระตือ รือ ร้นเ
                        47.1000 22.832         .189      .526
ต็มใจให้บริก าร
พนักงานแต่งกายสุภาพเรีย
                        47.0000 22.842         .151      .533
บร้อ ย
มี สาขาสามารถรับรองความ
                        47.3500 21.713         .172      .532
ต้องการของผูใช้บริก าร
                  ้
ท่าเลที่ตั้งเหมาะสมการเข้า
                        47.3000 22.432         .173      .529
รับบริการสะดวกสบาย
รูปแบบในการตกแต่งสถา
นที่มความโดดเด่นเป็นเอก
      ี                 47.4000 24.253         .022      .552
ลักษณ์
มี ระบบการดูแ ลรัก ษาความ
                        47.3500 21.187         .244      .513
ปลอดภัยที่ดี
มี การโฆษณาผ่านสื47.4000 22.042
                        อ ต่างๆ
                        ่                      .126      .545
มี การให้ขาวสารต่างๆครบ
            ่
                        47.3500 17.503         .537      .419
ท้วนทันสมัย
มี การแจกของขวัญของพิเ
ศษในโอกาสพิเศษหรือ ในเ  47.4500 16.471         .765      .356
ทศกาลต่างๆ
มี การติดประกาศต่างๆของ
ธนาคารเพื่อแจ้งข่าวสารขอ 22.892
                        47.5500                .174      .528
งธนาคาร
47


  Alpha = 0.541


        0.585


                  0.552


                  0.548


0.552


   0.545
48

More Related Content

Featured

How Race, Age and Gender Shape Attitudes Towards Mental Health
How Race, Age and Gender Shape Attitudes Towards Mental HealthHow Race, Age and Gender Shape Attitudes Towards Mental Health
How Race, Age and Gender Shape Attitudes Towards Mental Health
ThinkNow
 
Social Media Marketing Trends 2024 // The Global Indie Insights
Social Media Marketing Trends 2024 // The Global Indie InsightsSocial Media Marketing Trends 2024 // The Global Indie Insights
Social Media Marketing Trends 2024 // The Global Indie Insights
Kurio // The Social Media Age(ncy)
 

Featured (20)

2024 State of Marketing Report – by Hubspot
2024 State of Marketing Report – by Hubspot2024 State of Marketing Report – by Hubspot
2024 State of Marketing Report – by Hubspot
 
Everything You Need To Know About ChatGPT
Everything You Need To Know About ChatGPTEverything You Need To Know About ChatGPT
Everything You Need To Know About ChatGPT
 
Product Design Trends in 2024 | Teenage Engineerings
Product Design Trends in 2024 | Teenage EngineeringsProduct Design Trends in 2024 | Teenage Engineerings
Product Design Trends in 2024 | Teenage Engineerings
 
How Race, Age and Gender Shape Attitudes Towards Mental Health
How Race, Age and Gender Shape Attitudes Towards Mental HealthHow Race, Age and Gender Shape Attitudes Towards Mental Health
How Race, Age and Gender Shape Attitudes Towards Mental Health
 
AI Trends in Creative Operations 2024 by Artwork Flow.pdf
AI Trends in Creative Operations 2024 by Artwork Flow.pdfAI Trends in Creative Operations 2024 by Artwork Flow.pdf
AI Trends in Creative Operations 2024 by Artwork Flow.pdf
 
Skeleton Culture Code
Skeleton Culture CodeSkeleton Culture Code
Skeleton Culture Code
 
PEPSICO Presentation to CAGNY Conference Feb 2024
PEPSICO Presentation to CAGNY Conference Feb 2024PEPSICO Presentation to CAGNY Conference Feb 2024
PEPSICO Presentation to CAGNY Conference Feb 2024
 
Content Methodology: A Best Practices Report (Webinar)
Content Methodology: A Best Practices Report (Webinar)Content Methodology: A Best Practices Report (Webinar)
Content Methodology: A Best Practices Report (Webinar)
 
How to Prepare For a Successful Job Search for 2024
How to Prepare For a Successful Job Search for 2024How to Prepare For a Successful Job Search for 2024
How to Prepare For a Successful Job Search for 2024
 
Social Media Marketing Trends 2024 // The Global Indie Insights
Social Media Marketing Trends 2024 // The Global Indie InsightsSocial Media Marketing Trends 2024 // The Global Indie Insights
Social Media Marketing Trends 2024 // The Global Indie Insights
 
Trends In Paid Search: Navigating The Digital Landscape In 2024
Trends In Paid Search: Navigating The Digital Landscape In 2024Trends In Paid Search: Navigating The Digital Landscape In 2024
Trends In Paid Search: Navigating The Digital Landscape In 2024
 
5 Public speaking tips from TED - Visualized summary
5 Public speaking tips from TED - Visualized summary5 Public speaking tips from TED - Visualized summary
5 Public speaking tips from TED - Visualized summary
 
ChatGPT and the Future of Work - Clark Boyd
ChatGPT and the Future of Work - Clark Boyd ChatGPT and the Future of Work - Clark Boyd
ChatGPT and the Future of Work - Clark Boyd
 
Getting into the tech field. what next
Getting into the tech field. what next Getting into the tech field. what next
Getting into the tech field. what next
 
Google's Just Not That Into You: Understanding Core Updates & Search Intent
Google's Just Not That Into You: Understanding Core Updates & Search IntentGoogle's Just Not That Into You: Understanding Core Updates & Search Intent
Google's Just Not That Into You: Understanding Core Updates & Search Intent
 
How to have difficult conversations
How to have difficult conversations How to have difficult conversations
How to have difficult conversations
 
Introduction to Data Science
Introduction to Data ScienceIntroduction to Data Science
Introduction to Data Science
 
Time Management & Productivity - Best Practices
Time Management & Productivity -  Best PracticesTime Management & Productivity -  Best Practices
Time Management & Productivity - Best Practices
 
The six step guide to practical project management
The six step guide to practical project managementThe six step guide to practical project management
The six step guide to practical project management
 
Beginners Guide to TikTok for Search - Rachel Pearson - We are Tilt __ Bright...
Beginners Guide to TikTok for Search - Rachel Pearson - We are Tilt __ Bright...Beginners Guide to TikTok for Search - Rachel Pearson - We are Tilt __ Bright...
Beginners Guide to TikTok for Search - Rachel Pearson - We are Tilt __ Bright...
 

รวม

  • 1. 1 191 49.6 194 50.4 385 100.0 385 191 96 94 0.4 2 20 11 2.9 20 - 30 91 23.6 31 - 40 137 35.6 41 - 50 120 31.2 51 - 60 21 5.5 60 5 1.3 385 100.0
  • 2. 2 2 385 20 11 2.9 20-30 91 23.6 31-40 137 35.6 41-50 120 31.2 51-60 21 5.5 60 5 1.3 3 5,000 6 1.6 5,000 – 10,000 16 4.2 10,001 – 101 26.2 15,000 15,001 – 140 36.4 20,000 20,000 122 31.7 385 100.0
  • 3. 3 3 385 5,000 6 1.6 5,000-10,000 16 4.2 10.001-15,000 101 26.2 15,001-20,000 140 36.4 20,000 122 31.7 4 / 137 35.6 81 21.0 / 115 29.9 24 6.2 / 12 3.1 7 1.8 9 2.3 385 100.0 4 385 / 137 35.6 81 21.0 / 115 29.9
  • 4. 4 24 6.2 / 12 3.1 7 1.8 9 2.3 5 3 2.5 69 57.0 25 20.7 24 19.8 121 100.0 4 121 8 6.6 91 75.2 22 18.2 Total 121 100.0
  • 5. 5 5 121 22 18.2 51 42.1 48 39.7 Total 121 100.0 6 121 6 5.0 16 13.2 70 57.9 29 24.0 Total 121 100.0 6 121
  • 6. 6 5 4.1 32 26.4 58 47.9 26 21.5 Total 121 100.0 7 121
  • 7. 7 1 .8 10 8.3 23 19.0 52 43.0 35 28.9 Total 121 100.0 8 121 3 2.5 16 13.2 36 29.8 48 39.7 18 14.9 Total 121 100.0 9 121
  • 8. 8 1 .8 14 11.6 36 29.8 52 43.0 18 14.9 Total 121 100.0 10 121
  • 9. 9 1 .8 10 8.3 42 34.7 60 49.6 8 6.6 Total 121 100.0 11 121 7 5.8 15 12.4 43 35.5 30 24.8 26 21.5 Total 121 100.0
  • 10. 10 12 121 4 3.3 15 12.4 39 32.2 44 36.4 19 15.7 Total 121 100.0 13 121
  • 11. 11 8 6.6 20 16.5 24 19.8 50 41.3 19 15.7 Total 121 100.0 14 121 11 9.1 12 9.9 39 32.2 37 30.6 22 18.2 Total 121 100.0 15 121
  • 12. 12 8 6.6 21 17.4 42 34.7 35 28.9 15 12.4 Total 121 100.0 16 121
  • 13. 13 2
  • 14. 14 1 เพศ * รายได้ตอเดือน Crosstabulation ่ รายได้ตอ เดือน ่ ต่่ากว่า 5000 - 10001 - 15001 - 20000 5000 บาท 10000 บาท15000 บาท 20000 บาท นไป Total บาทขึ้ เพศ ชาย Count 3 9 64 63 52 191 % within เพศ 1.6% 4.7% 33.5% 33.0% 27.2%100.0% % within รายได้ต50.0% 56.3% 63.4% 45.0% 42.6% 49.6% ่อ เดือน % of Total .8% 2.3% 16.6% 16.4% 13.5% 49.6% หญิง Count 3 7 37 77 70 194 % within เพศ 1.5% 3.6% 19.1% 39.7% 36.1%100.0% % within รายได้ต50.0% 43.8% 36.6% 55.0% 57.4% 50.4% ่อ เดือน % of Total .8% 1.8% 9.6% 20.0% 18.2% 50.4% Total Count 6 16 101 140 122 385 % within เพศ 1.6% 4.2% 26.2% 36.4% 31.7%100.0% % within รายได้100.0% 100.0% 100.0% 100.0%100.0%100.0% ต่อ เดือน % of Total 1.6% 4.2% 26.2% 36.4% 31.7%100.0% 5,000 3 1.6 50 0.8 5,000-10,000 9 4.7 56.3 2.3 10,001-15,000 64 33.5 63.4 16.6 15,001- 20,000 63 33 45 16.4 20,000
  • 15. 15 52 27.2 42.6 13.5 5,000 3 1.5 50 0.8 5,000-10,000 7 3.6 43.8 1.8 10,001-15,000 37 19.1 36.6 9.6 15,001-20,000 77 39.7 55 20 20,000 70 36.1 57.4 18.2 2
  • 16. 16 เพศ * อาชีพ Crosstabulation อาชีพ รับราชการพนักงานเ ค้าขาย / / นักเรียน / รัฐวิส าหกิจ อกชน ธุรกิ จส่วนตัวรับจ้าง นักศึกษา เกษตรกร ื่ นๆ........ Total อ เพศ ชาย Count 62 37 61 17 5 5 4 191 % within เพศ32.5% 19.4% 31.9% 8.9% 2.6% 2.6% 2.1%100.0% % within อาชีพ 45.3% 45.7% 53.0% 70.8% 41.7% 71.4% 44.4% 49.6% % of Total 16.1% 9.6% 15.8% 4.4% 1.3% 1.3% 1.0% 49.6% หญิง Count 75 44 54 7 7 2 5 194 % within เพศ38.7% 22.7% 27.8% 3.6% 3.6% 1.0% 2.6%100.0% % within อาชีพ 54.7% 54.3% 47.0% 29.2% 58.3% 28.6% 55.6% 50.4% % of Total 19.5% 11.4% 14.0% 1.8% 1.8% .5% 1.3% 50.4% Total Count 137 81 115 24 12 7 9 385 % within เพศ35.6% 21.0% 29.9% 6.2% 3.1% 1.8% 2.3%100.0% % within อาชีพ 100.0%100.0% 100.0%100.0%100.0%100.0%100.0%100.0% % of Total 35.6% 21.0% 29.9% 6.2% 3.1% 1.8% 2.3%100.0% / 62 132.5 43.3 16.1 37 19.4 45.7 9.6 / 61 31.9 53 15.8 17 8.9 70.8 4.4 / 5 2.6 41.7 1.3 5 2.6 71.4 1.3 4
  • 17. 17 2.1 44.4 1 / 75 38.7 54.7 19.5 44 22.7 54.3 11.4 / 54 27.8 47 14 7 3.6 29.2 1.8 / 7 3.6 58.3 1.8 2 1 28.6 0.5 5 2.6 55.6 1.3
  • 18. 18 3 เพศ * อายุ Crosstabulation อายุ ต่่ากว่า 20 20 - 30 ปี - 40 ปี - 50 ปี - 60 60 ปีขึ้นไป Total ปี 31 41 51 ปี เพศ ชาย Count 5 27 64 79 12 4 191 % within เพศ2.6% 14.1% 33.5% 41.4% 6.3% 2.1%100.0% % within อายุ 45.5% 29.7% 46.7% 65.8% 57.1% 80.0% 49.6% % of Total 1.3% 7.0% 16.6% 20.5% 3.1% 1.0% 49.6% หญิง Count 6 64 73 41 9 1 194 % within เพศ3.1% 33.0% 37.6% 21.1% 4.6% .5%100.0% % within อายุ 54.5% 70.3% 53.3% 34.2% 42.9% 20.0% 50.4% % of Total 1.6% 16.6% 19.0% 10.6% 2.3% .3% 50.4% Total Count 11 91 137 120 21 5 385 % within เพศ2.9% 23.6% 35.6% 31.2% 5.5% 1.3%100.0%
  • 19. 19 20 5 2.6 45.5 1.3 20-25 27 14.1 29.7 7 31-40 64 33.5 46.7 16.6 41-50 79 41.4 65.8 20.5 51-60 12 6.3 57.1 3.1 60 4 2.1 80 1 20 6 3.1 54.5 1.6 20-25 64 33 70.3 16.6 31-40 73
  • 20. 20 37.6 53.3 19 41-50 41 21.1 34.2 10.6 51-60 9 4.6 42.9 2.3 60 1 0.5 20 0.3 4
  • 21. 21 อายุ * อาชีพ Crosstabulation อาชีพ รับราชการพนั กงานเ ค้าขาย / / นั กเรียน / รัฐวิส าหกิจ อกชน ธุรกิ จส่ วนตัวรับจ้ าง นั กศึกษา เกษตรกร ื่ นๆ........ Total อ อายุ ต่่ากว่า 20Count ปี 6 2 2 0 1 0 0 11 % within อายุ 54.5% 18.2% 18.2% .0% 9.1% .0% .0%100.0% % within อาชี4.4% 2.5% พ 1.7% .0% 8.3% .0% .0% 2.9% % of Total 1.6% .5% .5% .0% .3% .0% .0% 2.9% 20 - 30 ปีCount 58 19 13 0 1 0 0 91 % within อายุ 63.7% 20.9% 14.3% .0% 1.1% .0% .0%100.0% % within อาชีพ 42.3% 23.5% 11.3% .0% 8.3% .0% .0% 23.6% % of Total 15.1% 4.9% 3.4% .0% .3% .0% .0% 23.6% 31 - 40 ปีCount 46 20 53 7 5 2 4 137 % within อายุ 33.6% 14.6% 38.7% 5.1% 3.6% 1.5% 2.9%100.0% % within อาชีพ 33.6% 24.7% 46.1% 29.2% 41.7% 28.6% 44.4% 35.6% % of Total 11.9% 5.2% 13.8% 1.8% 1.3% .5% 1.0% 35.6% 41 - 50 ปีCount 24 34 36 16 0 5 5 120 % within อายุ 20.0% 28.3% 30.0% 13.3% .0% 4.2% 4.2%100.0% % within อาชีพ 17.5% 42.0% 31.3% 66.7% .0% 71.4% 55.6% 31.2% % of Total 6.2% 8.8% 9.4% 4.2% .0% 1.3% 1.3% 31.2% 51 - 60 ปีCount 3 6 8 1 3 0 0 21 % within อายุ 14.3% 28.6% 38.1% 4.8% 14.3% .0% .0%100.0% % within อาชี2.2% 7.4% พ 7.0% 4.2% 25.0% .0% .0% 5.5% % of Total .8% 1.6% 2.1% .3% .8% .0% .0% 5.5% 60 ปีขึ้นไป Count 0 0 3 0 2 0 0 5 % within อายุ .0% .0% 60.0% .0% 40.0% .0% .0%100.0% % within อาชีพ .0% .0% 2.6% .0% 16.7% .0% .0% 1.3% % of Total .0% .0% .8% .0% .5% .0% .0% 1.3% Total Count 137 81 115 24 12 7 9 385 % within อายุ 35.6% 21.0% 29.9% 6.2% 3.1% 1.8% 2.3%100.0% % within อาชีพ 100.0%100.0% 100.0%100.0%100.0%100.0%100.0%100.0% % of Total 35.6% 21.0% 29.9% 6.2% 3.1% 1.8% 2.3%100.0% 20 / 6 54.5 4.4
  • 22. 22 1.6 2 18.2 2.5 0.5 / 2 18.2 2.5 0.5 0 0 0 0 / 1 9.1 8.3 0.3 0 0 0 0 0 0 0 0 20-30 / 58 63.7 42.3 15.1 19 20.9 23.5 4.9 / 13 14.3 11.3 3.4 0 0 0 0 / 1 1.1 8.3 0.3 0 0 0 0
  • 23. 23 0 0 0 0 31-40 / 46 33.6 33.6 11.9 20 14.6 24.7 5.2 / 53 38.7 46.1 13.8 7 5.1 29.2 1.8 / 5 3.6 41.7 3.1 2 1.5 28.6 0.5 4 2.9 44.4 1 41-50 / 24 20 17.5 6.2 34 28.3 42 8.8 / 36 30 31.3 9.4 16 3.3 66.7
  • 24. 24 4.2 / 0 0 0 0 5 4.2 71.4 4.3 5 4.2 55.6 1.3 51-60 / 3 14.3 2.2 0.8 6 28.6 7.4 1.6 / 8 38.1 7 2.1 1 4.8 4.2 0.3 / 3 14.3 25 0.8 0 0 0 0 0 0 0 0 60 / 0 0 0 0 0 0 0 0 / 3
  • 25. 25 60 2.6 0.8 0 0 0 0 / 2 40 16.7 0.5 0 0 0 0 0 0 0 0 5 อายุ * รายได้ตอเดือน Crosstabulation ่ รายได้ตอ เดือน ่ ต่่ากว่า 5000 - 10001 - 15001 - 20000 5000 บาท 10000 บาท 15000 บาท 20000 บาท บาทขึนไป Total ้ อายุ ต่่ากว่า 20Count ปี 0 0 2 3 6 11 % within อายุ .0% .0% 18.2% 27.3% 54.5%100.0% % within รายได้ต่อ เดือน .0% .0% 2.0% 2.1% 4.9% 2.9% % of Total .0% .0% .5% .8% 1.6% 2.9% 20 - 30 ปี Count 2 6 5 57 21 91 % within อายุ 2.2% 6.6% 5.5% 62.6% 23.1%100.0%
  • 26. 26 20 5000 0 0
  • 27. 27 0 0 5000-10000 0 0 0 0 10001-15000 2 18.2 2.0 0.5 15001-20000 3 27.3 2.1 0.8 20000 6 54.5 4.9 1.6 20-30 5000 2 2.2 33.3 0.5 5000-10000 6 6.6 37.5 1.6 10001-15000 5 5.5 5.0 1.3 15001- 20000 57 62.6 40.7 14.8 20000 21 23.1 17.2 5.5 31-40 5000 4 2.9 66.7 1.0 5000-10000 8
  • 28. 28 5.8 50.0 2.1 10001- 15000 43 31.4 42.6 11.2 15001-20000 37 27.0 26.4 9.6 20000 45 32.8 36.9 11.7 41-50 5000 0 0 0 0 5000-10000 2 1.7 12.5 0.5 10001- 15000 45 37.5 44.6 11.7 15001-20000 40 33.3 28.6 10.4 20000 33 27.5 27.0 8.6 51-60 5000 0 0 0 0 5000-10000 0 0 0
  • 29. 29 0 10001-15000 5 23.8 5.0 1.3 15001-20000 3 14.3 2.1 0.8 20000 13 61.9 10.7 3.4 60 5000 0 0 0 0 5000-10000 0 0 0 0 10001-15000 1 20.0 1.0 0.3 15001-20000 0 0 0 0 20000 4 80.0 3.3 1.0
  • 30. 30 1 N Mean 1 385 2.0130 2 385 4.1740 385 3.0935 3 385 4.0701 4 385 3.9610 5 385 3.9558 6 385 4.0026
  • 31. 31 385 3.9974 7 385 3.8761 8 385 3.8983 9 385 3.5377 10 385 3.3403 385 3.6656 11 385 3.4130 12 385 3.3455 13 385 3.3247 14 385 3.1117 385 3.2987 385 3.5138 4.50 - 5.00 3.50 - 4.49 2.50 - 3.49 1.50 - 2.49 1.00 - 1.49 3.5138 3.0935
  • 32. 32 4.1740 2.0130 3.9974 4.0701 4.0026 3.9610 3.9558 3.6656 3.8983 3.8983 3.5 377 3.3403 3.2987 3.4130 3.3455 3.3247 3.1 117
  • 33. 33 2 5000-10000 N Mean D 1 7 1.0000 2 7 4.5714 7 3.0935 3 7 4.5714 4 7 4.1429 5 7 4.4286 6 7 4.4286 7 3.9974 7 7 4.4286 8 7 4.2857 9 7 3.8571 10 7 3.2857 7 3.6656 11 7 3.0000 12 7 2.5714 13 7 2.5714
  • 34. 34 14 7 2.0000 7 3.2987 7 3.5138 5000-10000 3.5138 3.0935 4.5714 1.0000 3.9974 4.5714 4.4286 4.4286 4.1429 3.6656 4.4286 4.2857 3.8571 3.2857 3.2987
  • 35. 35 3.0000 2.5714 2.5714 2.0000 One-Sample Statistics Std. Error N MeanStd. DeviationMean ด้านการบริ ก าร 385 3.0935 .73000 .03720
  • 36. 36 One-Sample Test Test Value = 3.0 95% Confidence Interval of the Sig. Mean Difference t df (2-tailed) DifferenceLower Upper ด้านการบริการ 2.513 384 .012 .09351 .0204 .1667 t Sig. 3.0 3.0935 0.73000 2.51 0.01 3 2 0 H0: µ1 = 3.0 H1: µ1 ≠ 3.0 Sig = 0.012< 0.05 H0 H1 3.0 0
  • 37. 37 (t-test dependent) Group Statistics Std. Std. Deviatio Error N Mean n Mean 4.002 .0383 191 .53001 6 5 3.992 .0398 194 .55460 3 2 Independent Samples Test Levene's Test for Equality of Variances t-test for Equality of Means 95% Confidence Interval of the Sig. Mean Std. Error Difference F Sig. t df (2-tailed)Difference DifferenceLower Upper ด้านการให้บริก variances assumed .499 Equal .458 .187 383 .832 .01035 .05500-.09829 .11903 ารของบุคลากร variances not Equal .197382.662 .852 .01035 .05528-.09835 .11905 assumed t 191 4.0026 0.53001 0.187 194 3.9923 0.55460 0.197
  • 38. 38 H0:σ2 = σ2 H1: ≠σ2 Sig = 499>α 0.05 H0 H0 : µ =µ H1 : µ ≠µ Sig. = 0.832>α 0.05 2 t 0.187 Sig(2-tailed) 0.832 α(0.05) H0 H1 ANOVA
  • 39. 39 Sum of Squar Mean es df Square F Sig. Between 5.526 3 .854 3.247 .027 Groups Within 107.2 378 .387 Groups 21 Total 112.7 384 47 H µ =µ =µ = µ H 1 Sig 0.027 > 0.01 H H 1
  • 40. 40 ANOVA Sum of Squar Mean es df Square F Sig. Between .010 1 .010 .035 .852 Groups Within 112.7 383 .294 Groups 37 Total 112.7 384 47 H µ =µ =µ = µ H 1 Sig 0.852 > 0.01
  • 41. 41 H H 1 Correlations ด้านลักษณะ ด้านการบริก าร ทางกายภาพ ด้านการบริก าร Pearson Correlation 1 -.068 Sig. (2-tailed) .180 N 385 385 ด้านลักษณะทางกายภาพ Correlation Pearson -.068 1 Sig. (2-tailed) .180 N 385 385
  • 42. 42 H0:  =0 H1 :  ≠ 0 r= -0.068 sig= 0.180>α 0.01 H0 -0.068 Correlations ด้านการให้ บริก ารของ นการส่งเส ด้า บุคลากร มการตลาด ริ ด้านการให้บริการของบุค Correlation1 Pearson -.144** ลากร Sig. (2-tailed) .005 N 385 385 ด้านการส่งเสริมการตลาด Correlation Pearson -.144** 1 Sig. (2-tailed) .005 N 385 385 **.Correlation is significant at the 0.01 level (2-tailed). H0:  =0 H1 :  ≠ 0 r= -0.144 sig= 0.005<α 0.01
  • 43. 43 H1 -0.144
  • 44. 44 Chi-Square Tests Asymp. Sig. Value df (2-sided) Pearson Chi-Square a 8.139 6 .228 Continuity Correction Likelihood Ratio8.315 6 .216 Linear-by-Linear 2.366 1 .124 Association N of Valid Cases 385 a.4 cells (28.6%) have expected count less than 5. The minimum expected count is 3.47. H0: H1: Sig 0.228>α0.05 H0 8.139
  • 45. 45 20 Case Processing Summary N % CasesValid 20 100.0 a Excluded 0 .0 Total 20 100.0 a.Listwise deletion based on all variables in the procedure. Reliability Statistics Cronbach's Alpha N of Items .541 14
  • 46. 46 Item-Total Statistics Scale Corrected Cronbach's Scale Mean Variance if if Item-Total Alpha if Item Deleted Deleted Item Correlation Deleted Item มี การให้บรการที่หลากหลา ิ 47.4500 25.418 -.148 .585 ย เปิดให้บริการต่างๆตรงตา 46.8000 25.116 -.132 .552 มความต้อ งการของลูก ค้า พนักงานที่มความรูคอยให้ ี ้ 46.6500 22.661 .222 .520 ค่าแนะน่า ให้บริก ารมีคุณภาพมีม นุษ 46.9000 23.463 .072 .548 ย์สัมพันธ์ ดูแลเอาใจใส่ก ระตือ รือ ร้นเ 47.1000 22.832 .189 .526 ต็มใจให้บริก าร พนักงานแต่งกายสุภาพเรีย 47.0000 22.842 .151 .533 บร้อ ย มี สาขาสามารถรับรองความ 47.3500 21.713 .172 .532 ต้องการของผูใช้บริก าร ้ ท่าเลที่ตั้งเหมาะสมการเข้า 47.3000 22.432 .173 .529 รับบริการสะดวกสบาย รูปแบบในการตกแต่งสถา นที่มความโดดเด่นเป็นเอก ี 47.4000 24.253 .022 .552 ลักษณ์ มี ระบบการดูแ ลรัก ษาความ 47.3500 21.187 .244 .513 ปลอดภัยที่ดี มี การโฆษณาผ่านสื47.4000 22.042 อ ต่างๆ ่ .126 .545 มี การให้ขาวสารต่างๆครบ ่ 47.3500 17.503 .537 .419 ท้วนทันสมัย มี การแจกของขวัญของพิเ ศษในโอกาสพิเศษหรือ ในเ 47.4500 16.471 .765 .356 ทศกาลต่างๆ มี การติดประกาศต่างๆของ ธนาคารเพื่อแจ้งข่าวสารขอ 22.892 47.5500 .174 .528 งธนาคาร
  • 47. 47 Alpha = 0.541 0.585 0.552 0.548 0.552 0.545
  • 48. 48