SlideShare une entreprise Scribd logo
1  sur  7
Télécharger pour lire hors ligne
Carbon Footprint Analysis of Gasoline and Diesel from Forest
Residues and Corn Stover using Integrated Hydropyrolysis and
Hydroconversion
Jiqing Fan,*,†
John Gephart,‡
Terry Marker,§
Daniel Stover,∥
Ben Updike,†
and David R. Shonnard†
†
Department of Chemical Engineering and the Sustainable Futures Institute, Michigan Technological University, 1400 Townsend
Drive, Houghton, Michigan 49931, United States
‡
North Shore Forest Products, 5322 Grand Avenue, Duluth, Minnesota 55807, United States
§
Gas Technology Institute, 1700 S Mount Prospect Road, Des Plaines, Illinois 60018, United States
∥
Cargill Inc, Minneapolis, Minnesota 55440, United States
*S Supporting Information
ABSTRACT: With an increasing focus on renewable fuels, it
is vital to understand the environmental impacts from various
alternative transportation fuel products and processes under
development. This study analyzes greenhouse gas (GHG)
emissions of renewable gasoline and diesel produced by the
integrated hydropyrolysis and hydroconversion (IH2
) process
at an existing petroleum refinery in Memphis, TN, USA. In
this study, we considered forest residues from the southeastern
US and corn stover from the Midwest as the two feedstocks.
H2 required for the process is either imported from a steam
methane reformer using natural gas or produced from C1−C3
gas coproducts of the IH2
process. Life cycle GHG emission
savings of 67−86% were calculated for IH2
gasoline and diesel compared to their fossil counterparts, depending on feedstock,
transport and H2 sources. Monte Carlo simulations were conducted to assess the impact of input parameter uncertainty on the
final GHG emission results. The impact of applying biochar coproduct as a soil amendment and soil carbon change due to
residue harvest were also studied.
KEYWORDS: Hydropyrolysis, Hydroconversion, Forest residue, Corn stover, Greenhouse gas, Life cycle assessment
■ INTRODUCTION
Integrated Hydropyrolysis and Hydroconversion. Fast
pyrolysis has been extensively studied as a thermochemical
technology to convert lignocellulosic biomass to liquid biofuels,
which could be directly burned to generate heat and electricity,
or transported to refineries for upgrading to hydrocarbon
fuels.1−4
However, biofuels produced by fast pyrolysis possess
many undesirable properties, such as high total acid number
(TAN), low heating value, high oxygen and water content, and
chemical instability. Therefore, fast pyrolysis biofuels require
further upgrading through hydrotreating and hydroconversion
before substitution of fossil fuels, which is carried out at low
space velocity and requires high temperature and high
hydrogen pressure.1,5,6
In addition, pyrolysis oil has a high
TAN and is not miscible with petroleum fractions and,
therefore, requires a separate feed system and hydroconversion
equipment with special metallurgy when introduced into
existing refinery (hydrotreaters or hydrocrackers) for upgrad-
ing; ebullated beds may also be required to achieve sufficiently
long run times and avoid reactor plugging.7
Catalytic hydropyrolysis or integrated hydropyrolysis and
hydroconversion (IH2
) provides an alternative approach to
directly convert biomass to hydrocarbon gasoline and diesel.
Catalytic hydropyrolysis is carried out in a fluidized bed at
relatively low hydrogen pressure (20−35 bar) and moderate
temperature (350−480 °C). This process yields a dark and
opaque liquid with low oxygen content (3−6 wt %) and TAN
(<20), which can be further polished in an integrated
hydrotreating reactor to produce drop-in hydrocarbon fuels.
A schematic flow diagram of the IH2
process is illustrated in
Figure 1.
Biomass feedstock is introduced into the fluidized bed
hydropyrolysis reactor via a lockhopper. The reactor operates at
temperatures of 350−480 °C and H2 pressures of 20−35 bar,
where biomass is devolatilized, and the oxygen in the
devolalitized vapor is converted to H2O and COx, producing
a light hydrocarbon vapor product, C1−C3 gases, and biochar.
Received: September 28, 2015
Revised: November 11, 2015
Published: November 19, 2015
Research Article
pubs.acs.org/journal/ascecg
© 2015 American Chemical Society 284 DOI: 10.1021/acssuschemeng.5b01173
ACS Sustainable Chem. Eng. 2016, 4, 284−290
The biochar is continuously removed by a cyclone, which can
be collected and sold as soil amendment, or burned internally
to generate heat (for feedstock drying and process startup) and
electricity (to export to grid). Hydropyrolysis vapors directly
enter a fixed bed hydroconversion reactor with catalyst, where
the hydrocarbon vapors are fully deoxygenated and all
heteroatoms (sulfur, nitrogen) are removed by hydrogenation
(sulfate reducing and nitrate reducing). The catalyst con-
sumption rate is approximately 2% (0.0025 kg/kg liquid
product) in the demonstration plant and expected to be lower
for commercial operation. The hydrotreating catalyst has a 2 y
lifetime and could be recycled by the company CRI if needed.
The pure hydrocarbon products are recovered by condensation
and finally separated to gasoline and diesel fractions in a
distillation column. The diesel fraction has low cetane number
because of high aromatic content, but can be further
hydrotreated through aromatic saturation to improve the
cetane to meet the US diesel specification of 40. C1−C3 fuel
gas is either burned to generate steam and electricity, or fed to
an integrated steam reformer to produce H2, which is circulated
back to the hydropyrolysis reactor using a compressor.
Ammonia and hydrogen sulfide in the process condensate are
stripped and oxidized to make aqueous ammonia/ammonium
sulfate product, which can be used as a fertilizer. For low sulfur
feedstock such as wood, the amount of H2S is so small that not
worth recovering, H2S is just absorbed in the ammonia/water
stream. In the cases IH2
process is integrated with a petroleum
refinery, the H2S would go to the normal amine scrubbers
system and ultimately to refinery Claus system where it is
recovered as sulfur. Contrary to pyrolysis, which is endothermic
in nature, catalytic hydropyrolysis and hydroconversion are
exothermic processes thus eliminating the need for recirculation
of solid heat carrier and produce high levels of steam.
Research Objectives. Life cycle assessment (LCA) is an
ideal method to quantify human health and environmental
impacts associated with a product, and it has been applied to
assess numerous biofuel conversion technologies. However,
hydropyrolysis and hydroconversion of biomass is a relatively
new reaction route, with only one prior LCA reported in the
literature.8
In that study, a standalone IH2
process with H2
produced on-site from C1−C3 coproducts was analyzed,
greenhouse gas (GHG) emission savings for IH2
gasoline and
diesel blend ranged between 30 and 96% compared to
comparable fossil fuel depending on feedstock types. However,
hydroprocessing facilities integrated with existing petroleum
refineries would likely to benefit from the on-site H2
production.9
IH2
process can be integrated with petroleum
refineries with no hydrogen costs or capital costs.10
Therefore,
our main objective in this current study is to understand the
environmental implications of producing renewable gasoline
and diesel by IH2
process integrated with one candidate Valero
refinery in Memphis, TN. One goal of this study is to
determine the cradle to gate life cycle GHG emissions of diesel
and gasoline produced by the IH2
processes utilizing forest
residues and corn stover as feedstock. Another goal is to
explore the impacts of model parameter uncertainty in the
calculation of GHG emissions by Monte Carlo simulation. A
series of model assumptions and inputs such as forest residues
fuel use, fertilizers application, IH2
process H2 requirements,
and biochar use will probe the sensitivity of the GHG
emissions. Finally, depletion of soil C from the forest landscape
due to harvest residues removal may cause a delay of several
decades for the benefits of biofuels displacing fossil fuels to be
felt.11
Large quantity of stover removal is found to negatively
affect soil carbon.12
It is important to understand the impact of
indirect CO2 emissions due to residues harvest, and integrate
into the life cycle emissions of renewable fuels produced from
these feedstocks.
■ METHODS
System Overview. The LCA was conducted following the ISO
14040 guidelines.13
The GHG impact was calculated using a 100 year
global warming potential (GWP) according to the IPCC guidelines14
of gram CO2 equivalents of 1 for CO2, 28 for CH4, and 265 for N2O.
The system boundary includes feedstock collection, transport, storage
and processing (size reduction and drying), IH2
fuel production, waste
treatment, and distribution and vehicular use of final fuel product. The
functional unit of the study for reporting of results is 1 MJ of final fuel
product, but all the input data were calculated based on different bases
(Tables 1 and 2) and entered into SimaPro 8.0 for simulation. GHG
credits of the coproducts such as electricity and ammonia/ammonium
sulfate were dealt with using system expansion (displacement)
method, the recommended method by ISO 1404115
and U.S EPA.16
Forest Residues. Woody biomass from forestland can sustainably
supply feedstock for a future biobased economy and achieve forest-
based economic prosperity and ecosystem quality through sustainable
management.17
Forest residues and waste woods are predicted to
provide 102 million t (MT) of dry biomass on an annual basis in 2030
at a price of $60 per dry t, which can yield approximately 26.5 billion L
of biofuel, assuming a conversion rate of 320 L/dry t and 20% biomass
loss in hauling, storing, and handling.18
A forest feedstock supply study was carried out to understand the
economic feasibility of supplying forest residues to an IH2
processing
facility next to an existing refiner. Two Valero refineries located in St.
Charles, Louisiana, and Memphis, Tennessee, were evaluated. The St.
Charles site was ruled out because of limited local feedstock supply
Figure 1. Schematic flow diagram of the IH2
process.
ACS Sustainable Chemistry & Engineering Research Article
DOI: 10.1021/acssuschemeng.5b01173
ACS Sustainable Chem. Eng. 2016, 4, 284−290
285
and lack of space for an expansion that would accommodate the
handling and storage of feedstock. It was determined that efforts would
be focused on the Valero Memphis, Tennessee, location.
While the chemical composition of different tree species (softwoods
and hardwoods) and tree components (bole, bark, tops) differ, the IH2
process is not limited to any one specie or species group. Feedstock
sources are grouped into three categories: logging residues,
unmerchantable roundwood (forest species currently not in demand
by other forest industries), and mill residues. Logging residues are
collected using conventional logging equipment, converted at roadside
into chips, and hauled to the receiving location. Roundwood is
processed into 8 ft and tree length logs using conventional logging
equipment, transported to the receiving facility, and then converted
into chips. Mill residues are collected in a sawmill facility, which
include bark from round logs and pulpwood, sawdust and sawmill
chips, and slabs. All feedstock is delivered to Memphis by truck,
assuming fuel efficiency of 5 miles per gal (2.13 km/L diesel) and load
capacity of 24 green t (12 bone dry t/truck). Three plant sizes of 250,
500, and 1000 short t (227, 454, and 908 t) per day were evaluated to
investigate its effect on feedstock supply chain. The hauling distances
vary from 113 to 132 km depending on the plant capacity. The
residues feedstocks are pretreated (size reduction and drying) before
being fed into the IH2 process. The inputs of forest residues feedstock
supply are tabulated in Table 1.
Corn Stover. Corn stover is a potential feedstock to produce
biofuel and bioproducts at a relatively low cost.19
The U.S Department
of Energy (DOE)18
estimates corn stover supply of 140 Mt (dry) in
2030 at the simulated price of $60/t. Corn stover yield has the
potential to double in 2030, assuming a much larger fraction of no-
until corn cultivation (57% vs 23% in baseline), and corn yields reach a
national average of 655 bu/ha (vs baseline 497 bu/ha).18
Corn stover was studied by Cargill Inc. to optimize process
economics for the IH2
process to be performed at one of Valero’s
ethanol plants or refinery facilities across the United States.
Information related to the corn stover supply chain components of
harvesting, local storage, transportation, nutrient replacement, and
grinding were collected from published models and literature of similar
scope. The inputs of corn stover listed in Table 2 were primarily
obtained from the supply chain study by Cargill and supplemented
with the GREET 2014 model.20
The main inputs are diesel for stover
collection and loading, and synthetic fertilizers used to displace the
nutrients in the corn stover which are removed from the corn field. N
fertilizer is assumed to be a combination of ammonia (31%), urea
(23%), urea and ammonium nitrate solution (UAN) (32%),
ammonium nitrate (4%), diammonium phosphate (6%), and
monoammonium phosphate (4%).20
Fossil C in urea (CO(NH2)2)
is assumed to be released into atmosphere as CO2 from soil. IPCC21
estimates that 1.325% of N in fertilizer and 1.225% of N in crop
residues are emitted to atmosphere as N2O. Therefore, an additional
0.1% of N is emitted as N2O when N fertilizer are applied to soil to
replace the nutrients removed in corn stover. N2O emission at stover
storage was presented in the GREET model20
using the formula 0.048
× 0.0077 × 0.01 × 1 000 000 × 44/28/(1 − 0.048)/(1 − 0.02) = 6.23
g, where dry matter loss at storage is 4.8%, nitrogen accounts for
0.77% of biomass dry matter, 1% of nitrogen is assumed to be
converted to N2O, and 2% of dry matter is lost at transport. Any
potential emissions due to land management in corn/corn stover
feedstock is not considered in this study. CH4 is produced only under
anaerobic conditions at high temperature and can be oxidized in the
surface area,22
so it is neglected in this study for corn stover stored in
large square bales. The transport distance for corn stover (moisture
content 15 wt %) to the Memphis facility is predicted as 153 km by
Cargill. Cargill also investigated corn stover suppliers across the U.S
and found that the shortest draw radius for corn stover supply is 53 km
for Welcome, MN, and longest draw radius is 1842 km for
Wilmington, CA. However, the Wilmington case was not included
in this study because it is not environmentally and economically
feasible to haul feedstock for such a long distance.
IH2
Process. Various types of feedstocks have been tested in the
IH2
system. All experiments were run at mild conditions with
temperatures in the first stage from 340 to 470 °C and 370 to 400 °C
in the second stage, with pressures range from 14 to 23 bar.33
H2 can
be produced by reforming the CO and C1−C3 hydrocarbon gas
product. If there is not enough H2 to meet the process requirement, it
can be balanced by increasing the reactor temperature to make more
light ends and less biochar. The results demonstrated that IH2
process
directly converts the biomass feedstock to high quality hydrocarbon
gasoline and diesel at high yields. Liquid IH2
gasoline and diesel blend
yields from wood range from 25 to 28% (wt) under optimal processing
conditions. Corn stover has lower liquid yields (21%) because of high
ash content. It also presents more challenge than wood because of high
chlorine and metals content. The typical yield and properties of IH2
products from wood and corn stover are presented in Table S1 of the
Supporting Information.
The liquid products were further analyzed after separating into
gasoline, diesel, and vacuum gasoil cuts by distillation. IH2
gasoline
Table 1. Inputs of Forest Residues Collection, Transport,
and Processinga
227 t/day
(bone
dry)
454 t/day
(bone
dry)
908 t/day
(bone
dry)
raw material
processing in the
woods
diesel 2727 4860 8812
lubricating oil 19 39 80
hydraulic fluid 19 41 83
grease 51 108 220
gasoline 53 112 226
trucking from
woods to facility
dieselb
1999 4186 9444
lubricating oil 3 7 16
grease 1 2 5
yard equipment diesel 344 688 1376
lubricating oil 15 30 59
hydraulic fluid 15 31 62
grease 41 81 163
feedstock
processing and
dryingc
electricity (kW
h; size
reduction)
7460 14920 29840
electricity (kW
h; drying)
6378 12757 25513
a
In liters unless stated otherwise. b
Diesel use includes trucks empty
return, assuming the same miles per gallon. c
Feedstock size reduction
uses electricity from the grid, and feedstock drying uses excess heat
from the IH2
process steam.
Table 2. Inputs of Corn Stovera
Materials
diesel, low-sulfur (corn stover collection)20
4.95 kg
diesel, low-sulfur (corn stover loading)20
0.11 kg
fertilizer (N) 7.71 kg
fertilizer (K2O) 14.29 kg
fertilizer (P2O5) 2.36 kg
HDPE pipes (corn stover storage)20
0.34 kg
Processes
CO2 emissions from diesel/gasoline
combustion
(4.95 + 0.11) ×
3.172
kg
CO2 emissions from urea application (fossil C
in urea)
7.71 × 0.55 ×
44/60
kg
additional N2O emissions from N fertilizers 7.71 × 0.001 ×
44/28
kg
N2O emission at corn stover storage 6.23 g
transport, truck 10−20 t 150 km
transport, truck 10−20 t, empty return 150 km
a
On 1 t dry basis as transported. The ratio of stover collected and
transported is 1.04, which was based on handling mass loss 2%, storage
loss 4.8%, and transport loss 2%.
ACS Sustainable Chemistry & Engineering Research Article
DOI: 10.1021/acssuschemeng.5b01173
ACS Sustainable Chem. Eng. 2016, 4, 284−290
286
contains the same types of components as petroleum gasoline but has
fewer olefins and more naphthenes. The properties of IH2
gasoline
fraction is compared to petroleum gasoline and the results are
tabulated in Table 3. The IH2
gasoline is very similar to petroleum
gasoline but has a higher octane and a slightly higher Reid vapor
pressure (RVP).
The IH2
processing data for this LCA study was based on 1000 t/
day capacity (Table 4) and provided by GTI and engineering design
data from Kellogg Brown & Root (KBR) LLC. Two cases were
analyzed for the IH2
process from forest residues: In case one, the IH2
process is integrated with an existing petroleum refinery, where an on-
site steam methane reforming (SMR) unit provides the H2 required
for hydropyrolysis and hydroconversion. Biochar and C1−C3
coproducts are combusted to provide steam (heat) for feedstock
drying, IH2
process, and electricity generation. Case two assumes a
stand-alone IH2
facility, where H2 is produced internally using C1−C3
coproducts. Combustion of biochar and electricity imported from TN
grid provide the heat and power for feedstock drying and IH2
process.
The IH2
process also includes a third stage reactor where the diesel
fraction is further hydrotreated to increase cetane index from 25 to 43.
Two cases of IH2
process from corn stover were analyzed as well. In
case one, corn stover is transported to the Memphis refinery where the
feedstock is used to produce renewable fuel blend with H2 from an on-
site SMR unit and excess electricity exported to the grid. In case two,
corn stover is processed at Welcome, MN, which was selected because
it has the lowest corn ethanol production cost. In case two, the IH2
facility is integrated with a third stage reactor where renewable diesel is
further hydrotreated, and H2 is produced internally using the C1−C3
coproducts. The utilities used for corn stover processing is expected to
be about the same as the forest residues processing, but the amount of
final fuel product would be approximately73% of the fuels produced in
the case of the forest residues. The difference in liquid yield is going to
biochar, where the biochar yield increase is assumed to be the same as
decrease in liquid fuel yield (mass balance). C footprint of catalyst is
assumed to be negligible because its environmental impact was found
minimal in a recent study.8
The Tennessee (TN) and Minnesota
(MN) electricity mix profiles were created in SimaPro using State
resource mix data from eGRID.23
The inventory of electricity inputs
are tabulated in Table S2 of the Supporting Information.
The final fuel products are assumed to be distributed to the adjacent
Valero fuel terminal at Memphis, which are to be blended with fossil
gasoline and diesel. Therefore, we assume that the fuel transport
emissions are the same as their fossil counterparts.
The IH2
process also produces a water−ammonia stream, which is
sold as N fertilizer. Energy and GHG credits were assigned to this
water−ammonia stream based on the environmental burden of
synthetic N fertilizer. Ash is trucked and disposed of. Ash content in
corn stover is approximately 10%, as compared to 0.5% in forest
residues. Thus, more ash needs to be disposed of by landfill when the
feedstock is corn stover. Cooling tower blowdown and storm/oily
water are treated at the refinery wastewater treatment plant. GHG
emissions of waste treatment were estimated in SimaPro as well.
■ RESULTS AND DISCUSSION
GHG emissions of the two feedstocks, forest residues, and corn
stover, as delivered to the Memphis refinery, are illustrated in
Figure 2. Corn stover bears more environmental burden (98.4
vs 70.1 kg CO2 equiv/t), due to the synthetic fertilizer needed
to replace the nutrients on corn fields, and longer transport
distance to the processing facility. Feedstock transport is the
top GHG contributor, accounting for over 50% of total GHG
burdens of feedstock.
GHG emission results of IH2
renewable fuel blend from
forest residues and corn stover are tabulated in Table 5 and are
compared to petroleum diesel and gasoline. Fuel production
emissions are categorized into GHG from H2 production,
utilities, credits from electricity, and ammonia/ammonium
sulfate. In accordance with the EPA Renewable Fuel Standard
(RFS)16
and the Low Carbon Fuels Standard (LCFS) of
California,24
the net CO2 emissions of renewable fuels at the
combustion stage are considered carbon neutral because CO2 is
sequestered by photosynthesis during the growth of biomass.
GHG emissions of IH2
fuel blend from forest residues are
26.59, and 12.75 g CO2 equiv/MJ, for case 1 and 2 respectively.
Table 3. Properties of Typical IH2
Gasoline Fraction and
Petroleum Gasoline33
IH2
gasoline from wood petroleum gasoline
% C 87.9 86.9
% H 12.1 13.1
wt % n-paraffins 10.9 18.5
wt % i-paraffins 4.5 34.4
wt % aromatics 25.4 31
wt % napthenes 31 9.1
wt % oxygenates 0.0 0.09
RVP at 100 °F 9.5 8.8
octane number 88.3 84.7
density 0.761 0.722
Table 4. Materials and Energy Flow of the IH2
Facility Using
Forest Residues As Feedstock
case 1 case 2
Inputs
biomass feedstock 1000 1000 t
H2 from SMR 52150 0 kg
electricity 0 60 MWh
cooling water 6160 3085 t
boiler feedwater 5630 5630 t
inerting gas (N2) 7200 120a
kg
Outputs
renewable gasoline 175800 169040 kg
renewable diesel 83640 80420 kg
electricity 576 0 MW h
ammonia/ammonium sulfate 2000 2000 kg
Waste Stream
sour water 538 538 t
cooling tower blowdown 1329 1329 t
ash 3840 3840 kg
a
CO2 recovered from the H2 plant is used as inerting gas, instead of
N2, thus less N2 required
Figure 2. GHG emissions of forest residues and corn stover (as
delivered to the Memphis refinery).
ACS Sustainable Chemistry & Engineering Research Article
DOI: 10.1021/acssuschemeng.5b01173
ACS Sustainable Chem. Eng. 2016, 4, 284−290
287
Case 1 has higher GHG emission because of its H2 source,
which is produced from fossil natural gas in SMR. However, it
also benefits from the GHG credits from electricity exported to
the grid. IH2
fuel blends from corn stover case 1 have higher
GHG emissions than those produced from forest residues.
With lower liquid yield, more biomass and utilities are used to
produce the same amount of fuel products. However, corn
stover cases benefit from electricity credits from burning
coproduct biochar. Corn stover case 2 shows the lowest GHG
emission result because feedstock transportation distance is the
lowest, H2 is provided from C1−C3 coproducts, and electricity
is provided by burning the biochar. Environmental burdens
from waste treatment are higher for corn stover because of
larger amount of ash disposed of. Overall, the IH2
fuels from
forest residues and corn stover meet the 60% GHG reduction
target mandated by the RFS standard to quality as advanced
biofuel and as cellulosic biofuel.
■ SENSITIVITY ANALYSES
Monte Carlo Simulation. Monte Carlo analysis is an ideal
method to quantify parameter uncertainty in LCA.25
Therefore,
a Monte Carlo simulation was carried out to determine
responses to variations in inputs such as forest residues fuel use,
fertilizers application, and IH2
process H2 requirements.
Dias,26
Fan et al.,2
and Yoshioka et al.27
studied the use of
forest residues as an energy resource. Fuel use for residue
collection, chipping, and loading were obtained from
aforementioned studies.
The amounts of fertilizers applied to the corn field, especially
nitrogen, play a major role in the GHG emissions of corn stover
feedstock. The GREET model20
reports similar fertilizer
requirements compared to those estimated by Cargill. The
lower limit of fertilizers needed was calculated by the nutrient
composition of removed corn stoverestimated by DOE.18
H2 is the most significant contributor to the life cycle GHG
of IH2
fuels. The H2 requirement is estimated by KBR to
increase by as high as 20% if pressure swing adsorption (PSA)
is used for H2 recovery instead of a membrane.
A Monte Carlo simulation was conducted for forest residues
case 1 and corn stover case 1, as these two cases assume H2
comes from an external source (SMR), and thus carry GHG
burden from H2 production. Standard deviations of the inputs
parameters were calculated from the numbers reported in the
aforementioned sources, and tabulated in Table S3 of the
Supporting Information. GHG results by Monte Carlo
simulation are illustrated in Figure S1 and S2 of the Supporting
Information, which show a near normal distribution for IH2
fuels from both feedstocks. GHG emissions of IH2
fuels from
forest residues have a 97.5% probability to reside within a range
from 18.2 to 33 g CO2 equiv/MJ, with standard deviation of
3.76. IH2
fuels from corn stover have a 97.5% probability to
range between 19.4 and 39.9 g CO2 equiv/MJ with standard
deviation of 5.11.
Soil Carbon Change Due to Feedstock Harvest. Forest
harvest residue removal is found to introduce indirect CO2
emissions due to decrease of C flux into soil and litter pools.
Palosuo et al.28
and Repo et al.29
estimated approximately 200
and 350 kg CO2/dry t residues due to decreasing soil carbon by
residues removal within a 100-year rotation length, which could
be an order of magnitude larger than the emissions from the
residues production chain (collecting, chipping, transport). In
order to estimate the impact of soil carbon change on
renewable gasoline and diesel produced from forest residues,
this range of indirect CO2 emissions were incorporated into our
life cycle study. Life cycle GHG emissions of IH2
fuels increase
significantly as shown in Table 6, due to the large amount of
indirect CO2 emissions from soil C decrease. However, the IH2
fuels still show favorable GHG emissions compared to fossil
fuels.
A large quantity of stover removal is found to negatively
affect soil carbon. Kim et al.12
used the DAYCENT model to
compare the soil organic carbon in corn grain harvest to that in
corn grain and stover harvest system. Their simulation
indicated that soil carbon decreases by 95 to 290 kg CO2
equiv/ha if stover is harvested in additional to grain harvest,
depending on the locations of corn field. This indirect CO2
emission due to soil carbon decrease were integrated into this
study. Assuming a harvest index of 50%, stover yields (dry)
Table 5. Life Cycle GHG Emissions of IH2
Renewable Fuel Blend
g co2 equiv/mj forest residues case 1 forest residues case 2 corn stover case 1 corn stover case 2 petroleum dieselc
petroleum gasolinec
feedstock 8.05 8.37 11.81 7.97 7.54 8.3
fuel production (net) 17.63 3.47 16.71 −0.26 9.05 9.27
h2 51.00 0.00 69.87 0.00
other inputsa
0.33 3.80 0.45 7.92
credit from electricity −33.39 0.00 −53.18 −7.73
credit from ammonia −0.31 −0.32 −0.43 −0.44
waste treatment 0.06 0.06 0.13 0.13
fuel transport 0.85 0.85 0.85 0.85 0.85 1.03
fuel use 72.7 72.6
total 26.59 12.75 29.50 8.69 90 91.3
ghg reductionb
70% 86% 67% 90%
a
Other inputs include electricity, water, inerting gas, etc. b
GHG reductions are compared to petroleum gasoline because IH2
fuel blend is 75%
gasoline fraction c
Data source: NETL DOE/NETL-2009/1346.34
Table 6. Life Cycle GHG Emissions of IH2
Fuel, Including Indirect CO2 Emissions from Soil C Decrease
g CO2 eq/MJ
case 1
baseline
w/indirect CO2 emission
(low)
w/indirect CO2 emission
(high)
case 2
baseline
w/indirect CO2 emission
(low)
w/indirect CO2 emission
(high)
forest residues 26.59 44.11 57.25 12.75 30.97 44.64
corn stover 29.50 31.31 34.21 8.69 10.57 13.59
ACS Sustainable Chemistry & Engineering Research Article
DOI: 10.1021/acssuschemeng.5b01173
ACS Sustainable Chem. Eng. 2016, 4, 284−290
288
range from 5930 to 9050 kg/ha in the eight counties studied by
Kim et al., which indicates that indirect CO2 emission due to
stover harvest range from 15 to 40 kg CO2 eq/dry t. Life cycle
GHG emissions of IH2
fuels from corn stover tabulated in
Table 6. The indirect CO2 emissions are lower than those for
forest residues.
As shown in Table 6, indirect CO2 emissions due to residue
removal are significant. It is feasible to estimate these landscape
effects through the use of appropriate carbon dynamic models,
in forest landscapes using a model such as the Carbon Budget
Model of the Canadian Forest System (CBM-CFS), and in
agricultural settings using the DAYCENT or iEPIC models.
Future model simulations are warranted to better understand
the life cycle impact of IH2
fuel produced from forest residues
and corn stover.
Biochar as a Soil Amendment. Biochar produced from
pyrolysis and hydropyrolysis reactions is recognized as a
promising soil amendment, which improves soil fertility and
sequesters carbon.30,31
Therefore, we investigated the carbon
implication of applying biochar coproduct from IH2
processing
of corn stover as soil amendment. In the base case, biochar is
combusted to generate electricity for internal use and exported
to the grid. If biochar is used as soil amendment, additional
electricity is used to compensate the energy in biochar, but C in
the biochar is sequestered in soil. C ratio of biochar is assumed
to be 51.2%, of which 80% is assumed to be sequestered.20
In
addition, nutrients in biochar can offset fertilizers use. The N, P,
and K composition in biochar from corn stover pyrolysis was
reported by Mullen et al.31
The amount of fertilizers (N, P2O5,
K2O) avoided were calculated as 0.12, 0.25, and 0.24 g/MJ fuel,
respectively. Associated GHG emissions avoided by applying
biochar were calculated by multiplying the quantities of
fertilizers avoided and their corresponding emission factors.
The life cycle GHG emissions of IH2
fuels from corn stover
reduce by 6.3 and 6.0 CO2 equiv/MJ, respectively, for case 1
and case 2. This indicates that biochar from IH2
of corn stover
has a higher GHG mitigation capacity if used as a soil
amendment than combusted to replace electricity. Moreover,
additional GHG mitigation can be achieved by applying biochar
to soil as it is found to reduce soil N2O emission.32
■ ASSOCIATED CONTENT
*S Supporting Information
The Supporting Information is available free of charge on the
ACS Publications website at DOI: 10.1021/acssusche-
meng.5b01173.
Details of IH2
fuel properties and yield, TN and MN
electricity generation mix, and Monte Carlo simulation
(PDF)
■ AUTHOR INFORMATION
Corresponding Author
*E-mail: jiqingf@mtu.edu. Tel.: 906-487-1092. Fax: 906-487-
3213.
Notes
The authors declare no competing financial interest.
■ REFERENCES
(1) Czernik, S.; Bridgwater, A. V. Overview of applications of
biomass fast pyrolysis oil. Energy Fuels 2004, 18 (2), 590−598.
(2) Fan, J. Q.; Kalnes, T. N.; Alward, M.; Klinger, J.; Sadehvandi, A.;
Shonnard, D. R. Life cycle assessment of electricity generation using
fast pyrolysis bio-oil. Renewable Energy 2011, 36 (2), 632−641.
(3) Mohan, D.; Pittman, C. U.; Steele, P. H. Pyrolysis of wood/
biomass for bio-oil: A critical review. Energy Fuels 2006, 20 (3), 848−
889.
(4) Bridgwater, A. V. Upgrading Biomass Fast Pyrolysis Liquids.
Environ. Prog. Sustainable Energy 2012, 31 (2), 261−268.
(5) Zhang, Q.; Chang, J.; Wang, T. J.; Xu, Y. Review of biomass
pyrolysis oil properties and upgrading research. Energy Convers.
Manage. 2007, 48 (1), 87−92.
(6) Oasmaa, A.; Czernik, S. Fuel oil quality of biomass pyrolysis oils -
State of the art for the end user. Energy Fuels 1999, 13 (4), 914−921.
(7) Marker, T. L.; Felix, L. G.; Linck, M. B.; Roberts, M. J. Integrated
Hydropyrolysis and Hydroconversion (IH2) for the Direct Production
of Gasoline and Diesel Fuels or Blending Components from Biomass,
Part 1: Proof of Principle Testing. Environ. Prog. Sustainable Energy
2012, 31 (2), 191−199.
(8) Maleche, E.; Glaser, R.; Marker, T.; Shonnard, D. A Preliminary
Life Cycle Assessment of Biofuels Produced by the IH2 (TM) Process.
Environ. Prog. Sustainable Energy 2014, 33 (1), 322−329.
(9) Stratton, R. W. Life cycle assessment of greenhouse gas emissions
and non-CO2 combustion effects from alternative jet fuels. MS. thesis,
Massachusetts Institute of Technology, 2010.
(10) Tan, E. C. D.; Marker, T. L.; Roberts, M. J. Direct Production of
Gasoline and Diesel Fuels from Biomass via Integrated Hydropyrolysis
and Hydroconversion Process-A Techno- economic Analysis. Environ.
Prog. Sustainable Energy 2014, 33 (2), 609−617.
(11) Mckechnie, J.; Colombo, S.; Chen, J. X.; Mabee, W.; Maclean,
H. L. Forest Bioenergy or Forest Carbon? Assessing Trade-Offs in
Greenhouse Gas Mitigation with Wood-Based Fuels. Environ. Sci.
Technol. 2011, 45 (2), 789−795.
(12) Kim, S.; Dale, B. E.; Jenkins, R. Life cycle assessment of corn
grain and corn stover in the United States. Int. J. Life Cycle Assess. 2009,
14 (2), 160−174.
(13) International Organization for Standardization (ISO). ISO
14040: Environmental management−Life cycle assessment−Principles and
framework; Geneva, Switzerland, 2006.
(14) Intergovernmental Panel on Climate Change. Climate Change
2007: The Physical Science Basis. Contribution of Working Group I to the
Fourth Assessment Report; Cambridge University Press: Cambridge,
United Kingdom, and New York, NY, USA, 2007; p 996.
(15) International Organization for Standardization (ISO). Environ-
mental management-Life cycle assessment-Goal and scope definition
and inventory analysis. In ISO 14041:1998(E); Geneva, Switzerland,
1998.
(16) U.S Environmental Protection Agency. Regulatory Impact
Analysis: Renewable Fuel Standard Program Chapter 6, Life cycle Impacts
on Fossil Energy and Greenhouse Gases, EPA420-R-07-004; 2007.
(17) Zhu, J. Y.; Pan, X. J.; Zalesny, R. S. Pretreatment of woody
biomass for biofuel production: energy efficiency, technologies, and
recalcitrance. Appl. Microbiol. Biotechnol. 2010, 87 (3), 847−857.
(18) U.S. Department of Energy, U.S. Billion-Ton Update: Biomass
Supply for a Bioenergy and Bioproducts Industry; Oak Ridge National
Laboratory: Oak Ridge TN, 2011; p 227.
(19) Graham, R. L.; Nelson, R.; Sheehan, J.; Perlack, R. D.; Wright, L.
L. Current and potential US corn stover supplies. Agron. J. 2007, 99
(1), 1−11.
(20) Wang, M. GREET 1 2014 The Greenhouse Gases, Regulated
Emissions, and Energy Use in Transportation Model; Argonne National
Laboratory, 2014.
(21) De Klein, C.; Novoam, R.; Ogle, S.; Smith, K. A.; Rochette, P.;
Wirth, T. C.; McConkey, B. G.; Mosier, A.; Rypdal, K.; Walsh, M.;
Williams, S. A. N2O emissions from managed soils, and CO2 emissions
from lime and urea application; Intergovernmental Panel for Climate
Change (IPCC), 2006; Vol. 4.
(22) Wihersaari, M. Evaluation of greenhouse gas emission risks from
storage of wood residue. Biomass Bioenergy 2005, 28 (5), 444−453.
ACS Sustainable Chemistry & Engineering Research Article
DOI: 10.1021/acssuschemeng.5b01173
ACS Sustainable Chem. Eng. 2016, 4, 284−290
289
(23) EPA. U. S. eGRID Year 2010 Summary Tables. http://www.
epa.gov/cleanenergy/documents/egridzips/eGRID_9th_edition_V1-
0_year_2010_Summary_Tables.pdf.
(24) California Air Resources Board. Proposed Regulation to
Implement the Low Carbon Fuel Standard; Sacramento CA, 2009; p
374.
(25) Peters, G. P. Efficient algorithms for life cycle assessment, input-
output analysis, and Monte-Carlo analysis. Int. J. Life Cycle Assess.
2007, 12 (6), 373−380.
(26) Dias, A. C. Life cycle assessment of fuel chip production from
eucalypt forest residues. Int. J. Life Cycle Assess. 2014, 19 (3), 705−717.
(27) Yoshioka, T.; Aruga, K.; Nitami, T.; Kobayashi, H.; Sakai, H.
Energy and carbon dioxide (CO2) balance of logging residues as
alternative energy resources: system analysis based on the method of a
life cycle inventory (LCI) analysis. J. For. Res. 2005, 10 (2), 125−134.
(28) Palosuo, T.; Wihersaari, M.; Liski, J. Net greenhouse gas
emissions due to energy use of forest residuesimpact of soil carbon
balance. EFI proceedings, Joensuu, Finland, September 25−28, 2000;
2001; pp 115−130.
(29) Repo, A.; Tuomi, M.; Liski, J. Indirect carbon dioxide emissions
from producing bioenergy from forest harvest residues. GCB Bioenergy
2011, 3 (2), 107−115.
(30) Singh, B.; Singh, B. P.; Cowie, A. L. Characterisation and
evaluation of biochars for their application as a soil amendment. Aust.
J. Soil Res. 2010, 48 (6−7), 516−525.
(31) Mullen, C. A.; Boateng, A. A.; Goldberg, N. M.; Lima, I. M.;
Laird, D. A.; Hicks, K. B. Bio-oil and bio-char production from corn
cobs and stover by fast pyrolysis. Biomass Bioenergy 2010, 34 (1), 67−
74.
(32) Cayuela, M. L.; van Zwieten, L.; Singh, B. P.; Jeffery, S.; Roig,
A.; Sanchez-Monedero, M. A. Biochar’s role in mitigating soil nitrous
oxide emissions: A review and meta-analysis. Agric., Ecosyst. Environ.
2014, 191, 5−16.
(33) Roberts, M.; Marker, T. Biomass to Gasoline and Diesel Using
Integrated Hydropyrolysis and Hydroconversion; Gas Technology
Institute, Dec 28, 2012; p 128.
(34) Gerdes, K. J.; Skone, T. J. Development of Baseline Data and
Analysis of Life Cycle Greenhouse Gas Emissions of Petroleum-Based Fuels;
National Energy Technology Laboratory, Nov 26, 2008; p 310.
ACS Sustainable Chemistry & Engineering Research Article
DOI: 10.1021/acssuschemeng.5b01173
ACS Sustainable Chem. Eng. 2016, 4, 284−290
290

Contenu connexe

Tendances

IRJET- Hydrothermal Liquefaction Process (HTL) of Sugarcane Bagasse for the P...
IRJET- Hydrothermal Liquefaction Process (HTL) of Sugarcane Bagasse for the P...IRJET- Hydrothermal Liquefaction Process (HTL) of Sugarcane Bagasse for the P...
IRJET- Hydrothermal Liquefaction Process (HTL) of Sugarcane Bagasse for the P...IRJET Journal
 
Biomass gassification based ammonia plant
Biomass gassification based ammonia plantBiomass gassification based ammonia plant
Biomass gassification based ammonia plantDeepak Kumar Ojha, PhD
 
Bionic µFuel Catalytic Microwave Depolymerisation
Bionic µFuel Catalytic Microwave DepolymerisationBionic µFuel Catalytic Microwave Depolymerisation
Bionic µFuel Catalytic Microwave DepolymerisationBIONIC PALM Limited, Ghana
 
A review on optimization production and upgrading
A review on optimization production and upgradingA review on optimization production and upgrading
A review on optimization production and upgradingMarco Del Valle Montero
 
Biomass Gasification Technology in Eastern Africa
Biomass Gasification Technology in Eastern AfricaBiomass Gasification Technology in Eastern Africa
Biomass Gasification Technology in Eastern AfricaACX
 
IJSRED-V2I1P18
IJSRED-V2I1P18IJSRED-V2I1P18
IJSRED-V2I1P18IJSRED
 
G10 Final
G10 FinalG10 Final
G10 FinalYe Yuan
 
A REVIEW ON LIGNOCELLULOSIC BIOMASS CONVERSION TO DIESEL COMPATIBLE AND USEFU...
A REVIEW ON LIGNOCELLULOSIC BIOMASS CONVERSION TO DIESEL COMPATIBLE AND USEFU...A REVIEW ON LIGNOCELLULOSIC BIOMASS CONVERSION TO DIESEL COMPATIBLE AND USEFU...
A REVIEW ON LIGNOCELLULOSIC BIOMASS CONVERSION TO DIESEL COMPATIBLE AND USEFU...IAEME Publication
 
2014 krishnamurthy ai_ch_ej_pilotplant
2014 krishnamurthy ai_ch_ej_pilotplant2014 krishnamurthy ai_ch_ej_pilotplant
2014 krishnamurthy ai_ch_ej_pilotplantkyrilluskameel
 
Fuel for today’s energy transition and the future
Fuel for today’s energy transition and the futureFuel for today’s energy transition and the future
Fuel for today’s energy transition and the futureMed Seghair
 
IRJET- Biogas Production from Municipal Solid Waste:- A Review
IRJET- Biogas Production from Municipal Solid Waste:- A ReviewIRJET- Biogas Production from Municipal Solid Waste:- A Review
IRJET- Biogas Production from Municipal Solid Waste:- A ReviewIRJET Journal
 
Anaerobic co-digestion of defatted hydrolyzed meat processing dissolved air f...
Anaerobic co-digestion of defatted hydrolyzed meat processing dissolved air f...Anaerobic co-digestion of defatted hydrolyzed meat processing dissolved air f...
Anaerobic co-digestion of defatted hydrolyzed meat processing dissolved air f...Otago Energy Research Centre (OERC)
 
4.15 - "Technologies of Biomass Gasification" - Aleksander Sobolewski, Sławom...
4.15 - "Technologies of Biomass Gasification" - Aleksander Sobolewski, Sławom...4.15 - "Technologies of Biomass Gasification" - Aleksander Sobolewski, Sławom...
4.15 - "Technologies of Biomass Gasification" - Aleksander Sobolewski, Sławom...Pomcert
 
Be475 final j b version 3
Be475 final j b version 3Be475 final j b version 3
Be475 final j b version 3jketchu
 
Biofuels and analysis pc
Biofuels and analysis pcBiofuels and analysis pc
Biofuels and analysis pcYogesh Patil
 

Tendances (20)

IRJET- Hydrothermal Liquefaction Process (HTL) of Sugarcane Bagasse for the P...
IRJET- Hydrothermal Liquefaction Process (HTL) of Sugarcane Bagasse for the P...IRJET- Hydrothermal Liquefaction Process (HTL) of Sugarcane Bagasse for the P...
IRJET- Hydrothermal Liquefaction Process (HTL) of Sugarcane Bagasse for the P...
 
Biomass gassification based ammonia plant
Biomass gassification based ammonia plantBiomass gassification based ammonia plant
Biomass gassification based ammonia plant
 
Bionic µFuel Catalytic Microwave Depolymerisation
Bionic µFuel Catalytic Microwave DepolymerisationBionic µFuel Catalytic Microwave Depolymerisation
Bionic µFuel Catalytic Microwave Depolymerisation
 
A review on optimization production and upgrading
A review on optimization production and upgradingA review on optimization production and upgrading
A review on optimization production and upgrading
 
Ijmet 10 01_139
Ijmet 10 01_139Ijmet 10 01_139
Ijmet 10 01_139
 
Biomass Gasification Technology in Eastern Africa
Biomass Gasification Technology in Eastern AfricaBiomass Gasification Technology in Eastern Africa
Biomass Gasification Technology in Eastern Africa
 
IJSRED-V2I1P18
IJSRED-V2I1P18IJSRED-V2I1P18
IJSRED-V2I1P18
 
G10 Final
G10 FinalG10 Final
G10 Final
 
A REVIEW ON LIGNOCELLULOSIC BIOMASS CONVERSION TO DIESEL COMPATIBLE AND USEFU...
A REVIEW ON LIGNOCELLULOSIC BIOMASS CONVERSION TO DIESEL COMPATIBLE AND USEFU...A REVIEW ON LIGNOCELLULOSIC BIOMASS CONVERSION TO DIESEL COMPATIBLE AND USEFU...
A REVIEW ON LIGNOCELLULOSIC BIOMASS CONVERSION TO DIESEL COMPATIBLE AND USEFU...
 
Anaerobic digestion
Anaerobic digestionAnaerobic digestion
Anaerobic digestion
 
Biomass conversion technologies
Biomass conversion technologiesBiomass conversion technologies
Biomass conversion technologies
 
2014 krishnamurthy ai_ch_ej_pilotplant
2014 krishnamurthy ai_ch_ej_pilotplant2014 krishnamurthy ai_ch_ej_pilotplant
2014 krishnamurthy ai_ch_ej_pilotplant
 
Fuel for today’s energy transition and the future
Fuel for today’s energy transition and the futureFuel for today’s energy transition and the future
Fuel for today’s energy transition and the future
 
Biomass Pyrolysis
Biomass PyrolysisBiomass Pyrolysis
Biomass Pyrolysis
 
IRJET- Biogas Production from Municipal Solid Waste:- A Review
IRJET- Biogas Production from Municipal Solid Waste:- A ReviewIRJET- Biogas Production from Municipal Solid Waste:- A Review
IRJET- Biogas Production from Municipal Solid Waste:- A Review
 
Anaerobic co-digestion of defatted hydrolyzed meat processing dissolved air f...
Anaerobic co-digestion of defatted hydrolyzed meat processing dissolved air f...Anaerobic co-digestion of defatted hydrolyzed meat processing dissolved air f...
Anaerobic co-digestion of defatted hydrolyzed meat processing dissolved air f...
 
4.15 - "Technologies of Biomass Gasification" - Aleksander Sobolewski, Sławom...
4.15 - "Technologies of Biomass Gasification" - Aleksander Sobolewski, Sławom...4.15 - "Technologies of Biomass Gasification" - Aleksander Sobolewski, Sławom...
4.15 - "Technologies of Biomass Gasification" - Aleksander Sobolewski, Sławom...
 
COW DUNG
COW DUNGCOW DUNG
COW DUNG
 
Be475 final j b version 3
Be475 final j b version 3Be475 final j b version 3
Be475 final j b version 3
 
Biofuels and analysis pc
Biofuels and analysis pcBiofuels and analysis pc
Biofuels and analysis pc
 

Similaire à Undergrad Research Publication

PRESENTATION ON PLANT DESIGN FOR MANUFACTURING OF HYDROGEN
PRESENTATION ON PLANT DESIGN FOR MANUFACTURING OF HYDROGENPRESENTATION ON PLANT DESIGN FOR MANUFACTURING OF HYDROGEN
PRESENTATION ON PLANT DESIGN FOR MANUFACTURING OF HYDROGENPriyam Jyoti Borah
 
White hydrogen
White hydrogenWhite hydrogen
White hydrogenRecupera
 
bridgwater2006 (1).pdf
bridgwater2006 (1).pdfbridgwater2006 (1).pdf
bridgwater2006 (1).pdfBerkcan Arslan
 
Production of Syngas from Biomass
Production of Syngas from Biomass  Production of Syngas from Biomass
Production of Syngas from Biomass Awais Chaudhary
 
DDCranfield-ThesisPoster-Luc Girard-Madoux-Promo2014
DDCranfield-ThesisPoster-Luc Girard-Madoux-Promo2014DDCranfield-ThesisPoster-Luc Girard-Madoux-Promo2014
DDCranfield-ThesisPoster-Luc Girard-Madoux-Promo2014Luc Girard-Madoux
 
White hydrogen
White hydrogenWhite hydrogen
White hydrogenRecupera
 
Biomass to olefins cracking of renewable naphtha
Biomass to olefins    cracking of renewable naphthaBiomass to olefins    cracking of renewable naphtha
Biomass to olefins cracking of renewable naphthapxguru
 
Single-atom catalysts for biomass-derived drop-in chemicals
Single-atom catalysts for biomass-derived drop-in chemicalsSingle-atom catalysts for biomass-derived drop-in chemicals
Single-atom catalysts for biomass-derived drop-in chemicalsPawan Kumar
 
Hydrogen generation by cascading hydrothermal liquefaction of cotton with pho...
Hydrogen generation by cascading hydrothermal liquefaction of cotton with pho...Hydrogen generation by cascading hydrothermal liquefaction of cotton with pho...
Hydrogen generation by cascading hydrothermal liquefaction of cotton with pho...Richa Tungal
 
Conversion of plastic into fuel
Conversion of plastic into fuelConversion of plastic into fuel
Conversion of plastic into fuelMicheal Ashwanth
 
Hydrothermal Treatment Of Solid Waste
Hydrothermal Treatment Of Solid WasteHydrothermal Treatment Of Solid Waste
Hydrothermal Treatment Of Solid WasteKetan Wadodkar
 
Cathal Renewable gas presentation 12.11.10
Cathal Renewable gas presentation 12.11.10Cathal Renewable gas presentation 12.11.10
Cathal Renewable gas presentation 12.11.10BallyhouraCountry
 
AP-122-Hetero-Polyaromatic-Ring-Opening-Reactions-in-scCO21
AP-122-Hetero-Polyaromatic-Ring-Opening-Reactions-in-scCO21AP-122-Hetero-Polyaromatic-Ring-Opening-Reactions-in-scCO21
AP-122-Hetero-Polyaromatic-Ring-Opening-Reactions-in-scCO21Greg Curtis
 
Seminar defences 2
Seminar defences 2Seminar defences 2
Seminar defences 2Majur Mading
 
Biomass and Sludge Gasification for Syngas Synthesis and CHP - Final
Biomass and Sludge Gasification for Syngas Synthesis and CHP - FinalBiomass and Sludge Gasification for Syngas Synthesis and CHP - Final
Biomass and Sludge Gasification for Syngas Synthesis and CHP - FinalJad Halawi
 
Activation Of Carbon Produced From Coconut Shell By Using Fluidized Bed ...
Activation Of Carbon Produced From Coconut      Shell By Using Fluidized Bed ...Activation Of Carbon Produced From Coconut      Shell By Using Fluidized Bed ...
Activation Of Carbon Produced From Coconut Shell By Using Fluidized Bed ...Ratan Kumar
 

Similaire à Undergrad Research Publication (20)

PRESENTATION ON PLANT DESIGN FOR MANUFACTURING OF HYDROGEN
PRESENTATION ON PLANT DESIGN FOR MANUFACTURING OF HYDROGENPRESENTATION ON PLANT DESIGN FOR MANUFACTURING OF HYDROGEN
PRESENTATION ON PLANT DESIGN FOR MANUFACTURING OF HYDROGEN
 
White hydrogen
White hydrogenWhite hydrogen
White hydrogen
 
bridgwater2006 (1).pdf
bridgwater2006 (1).pdfbridgwater2006 (1).pdf
bridgwater2006 (1).pdf
 
Production of Syngas from Biomass
Production of Syngas from Biomass  Production of Syngas from Biomass
Production of Syngas from Biomass
 
DDCranfield-ThesisPoster-Luc Girard-Madoux-Promo2014
DDCranfield-ThesisPoster-Luc Girard-Madoux-Promo2014DDCranfield-ThesisPoster-Luc Girard-Madoux-Promo2014
DDCranfield-ThesisPoster-Luc Girard-Madoux-Promo2014
 
White hydrogen
White hydrogenWhite hydrogen
White hydrogen
 
Biomass to olefins cracking of renewable naphtha
Biomass to olefins    cracking of renewable naphthaBiomass to olefins    cracking of renewable naphtha
Biomass to olefins cracking of renewable naphtha
 
Pyrolysis of-biomass
Pyrolysis of-biomassPyrolysis of-biomass
Pyrolysis of-biomass
 
Single-atom catalysts for biomass-derived drop-in chemicals
Single-atom catalysts for biomass-derived drop-in chemicalsSingle-atom catalysts for biomass-derived drop-in chemicals
Single-atom catalysts for biomass-derived drop-in chemicals
 
Hydrogen generation by cascading hydrothermal liquefaction of cotton with pho...
Hydrogen generation by cascading hydrothermal liquefaction of cotton with pho...Hydrogen generation by cascading hydrothermal liquefaction of cotton with pho...
Hydrogen generation by cascading hydrothermal liquefaction of cotton with pho...
 
Bio-Mass Energy -2.docx
Bio-Mass Energy -2.docxBio-Mass Energy -2.docx
Bio-Mass Energy -2.docx
 
Bio-gasifier Coupled Engine
Bio-gasifier Coupled EngineBio-gasifier Coupled Engine
Bio-gasifier Coupled Engine
 
Conversion of plastic into fuel
Conversion of plastic into fuelConversion of plastic into fuel
Conversion of plastic into fuel
 
Hydrothermal Treatment Of Solid Waste
Hydrothermal Treatment Of Solid WasteHydrothermal Treatment Of Solid Waste
Hydrothermal Treatment Of Solid Waste
 
Cathal Renewable gas presentation 12.11.10
Cathal Renewable gas presentation 12.11.10Cathal Renewable gas presentation 12.11.10
Cathal Renewable gas presentation 12.11.10
 
AP-122-Hetero-Polyaromatic-Ring-Opening-Reactions-in-scCO21
AP-122-Hetero-Polyaromatic-Ring-Opening-Reactions-in-scCO21AP-122-Hetero-Polyaromatic-Ring-Opening-Reactions-in-scCO21
AP-122-Hetero-Polyaromatic-Ring-Opening-Reactions-in-scCO21
 
Seminar defences 2
Seminar defences 2Seminar defences 2
Seminar defences 2
 
Biomass and Sludge Gasification for Syngas Synthesis and CHP - Final
Biomass and Sludge Gasification for Syngas Synthesis and CHP - FinalBiomass and Sludge Gasification for Syngas Synthesis and CHP - Final
Biomass and Sludge Gasification for Syngas Synthesis and CHP - Final
 
Activation Of Carbon Produced From Coconut Shell By Using Fluidized Bed ...
Activation Of Carbon Produced From Coconut      Shell By Using Fluidized Bed ...Activation Of Carbon Produced From Coconut      Shell By Using Fluidized Bed ...
Activation Of Carbon Produced From Coconut Shell By Using Fluidized Bed ...
 
HYDROGEN GAS PRODUCTION BY PARTIAL OXIDATION OF HEAVY FUEL OIL
HYDROGEN GAS PRODUCTION BY PARTIAL OXIDATION OF HEAVY FUEL OILHYDROGEN GAS PRODUCTION BY PARTIAL OXIDATION OF HEAVY FUEL OIL
HYDROGEN GAS PRODUCTION BY PARTIAL OXIDATION OF HEAVY FUEL OIL
 

Undergrad Research Publication

  • 1. Carbon Footprint Analysis of Gasoline and Diesel from Forest Residues and Corn Stover using Integrated Hydropyrolysis and Hydroconversion Jiqing Fan,*,† John Gephart,‡ Terry Marker,§ Daniel Stover,∥ Ben Updike,† and David R. Shonnard† † Department of Chemical Engineering and the Sustainable Futures Institute, Michigan Technological University, 1400 Townsend Drive, Houghton, Michigan 49931, United States ‡ North Shore Forest Products, 5322 Grand Avenue, Duluth, Minnesota 55807, United States § Gas Technology Institute, 1700 S Mount Prospect Road, Des Plaines, Illinois 60018, United States ∥ Cargill Inc, Minneapolis, Minnesota 55440, United States *S Supporting Information ABSTRACT: With an increasing focus on renewable fuels, it is vital to understand the environmental impacts from various alternative transportation fuel products and processes under development. This study analyzes greenhouse gas (GHG) emissions of renewable gasoline and diesel produced by the integrated hydropyrolysis and hydroconversion (IH2 ) process at an existing petroleum refinery in Memphis, TN, USA. In this study, we considered forest residues from the southeastern US and corn stover from the Midwest as the two feedstocks. H2 required for the process is either imported from a steam methane reformer using natural gas or produced from C1−C3 gas coproducts of the IH2 process. Life cycle GHG emission savings of 67−86% were calculated for IH2 gasoline and diesel compared to their fossil counterparts, depending on feedstock, transport and H2 sources. Monte Carlo simulations were conducted to assess the impact of input parameter uncertainty on the final GHG emission results. The impact of applying biochar coproduct as a soil amendment and soil carbon change due to residue harvest were also studied. KEYWORDS: Hydropyrolysis, Hydroconversion, Forest residue, Corn stover, Greenhouse gas, Life cycle assessment ■ INTRODUCTION Integrated Hydropyrolysis and Hydroconversion. Fast pyrolysis has been extensively studied as a thermochemical technology to convert lignocellulosic biomass to liquid biofuels, which could be directly burned to generate heat and electricity, or transported to refineries for upgrading to hydrocarbon fuels.1−4 However, biofuels produced by fast pyrolysis possess many undesirable properties, such as high total acid number (TAN), low heating value, high oxygen and water content, and chemical instability. Therefore, fast pyrolysis biofuels require further upgrading through hydrotreating and hydroconversion before substitution of fossil fuels, which is carried out at low space velocity and requires high temperature and high hydrogen pressure.1,5,6 In addition, pyrolysis oil has a high TAN and is not miscible with petroleum fractions and, therefore, requires a separate feed system and hydroconversion equipment with special metallurgy when introduced into existing refinery (hydrotreaters or hydrocrackers) for upgrad- ing; ebullated beds may also be required to achieve sufficiently long run times and avoid reactor plugging.7 Catalytic hydropyrolysis or integrated hydropyrolysis and hydroconversion (IH2 ) provides an alternative approach to directly convert biomass to hydrocarbon gasoline and diesel. Catalytic hydropyrolysis is carried out in a fluidized bed at relatively low hydrogen pressure (20−35 bar) and moderate temperature (350−480 °C). This process yields a dark and opaque liquid with low oxygen content (3−6 wt %) and TAN (<20), which can be further polished in an integrated hydrotreating reactor to produce drop-in hydrocarbon fuels. A schematic flow diagram of the IH2 process is illustrated in Figure 1. Biomass feedstock is introduced into the fluidized bed hydropyrolysis reactor via a lockhopper. The reactor operates at temperatures of 350−480 °C and H2 pressures of 20−35 bar, where biomass is devolatilized, and the oxygen in the devolalitized vapor is converted to H2O and COx, producing a light hydrocarbon vapor product, C1−C3 gases, and biochar. Received: September 28, 2015 Revised: November 11, 2015 Published: November 19, 2015 Research Article pubs.acs.org/journal/ascecg © 2015 American Chemical Society 284 DOI: 10.1021/acssuschemeng.5b01173 ACS Sustainable Chem. Eng. 2016, 4, 284−290
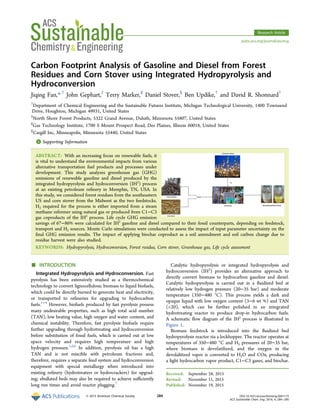
  • 2. The biochar is continuously removed by a cyclone, which can be collected and sold as soil amendment, or burned internally to generate heat (for feedstock drying and process startup) and electricity (to export to grid). Hydropyrolysis vapors directly enter a fixed bed hydroconversion reactor with catalyst, where the hydrocarbon vapors are fully deoxygenated and all heteroatoms (sulfur, nitrogen) are removed by hydrogenation (sulfate reducing and nitrate reducing). The catalyst con- sumption rate is approximately 2% (0.0025 kg/kg liquid product) in the demonstration plant and expected to be lower for commercial operation. The hydrotreating catalyst has a 2 y lifetime and could be recycled by the company CRI if needed. The pure hydrocarbon products are recovered by condensation and finally separated to gasoline and diesel fractions in a distillation column. The diesel fraction has low cetane number because of high aromatic content, but can be further hydrotreated through aromatic saturation to improve the cetane to meet the US diesel specification of 40. C1−C3 fuel gas is either burned to generate steam and electricity, or fed to an integrated steam reformer to produce H2, which is circulated back to the hydropyrolysis reactor using a compressor. Ammonia and hydrogen sulfide in the process condensate are stripped and oxidized to make aqueous ammonia/ammonium sulfate product, which can be used as a fertilizer. For low sulfur feedstock such as wood, the amount of H2S is so small that not worth recovering, H2S is just absorbed in the ammonia/water stream. In the cases IH2 process is integrated with a petroleum refinery, the H2S would go to the normal amine scrubbers system and ultimately to refinery Claus system where it is recovered as sulfur. Contrary to pyrolysis, which is endothermic in nature, catalytic hydropyrolysis and hydroconversion are exothermic processes thus eliminating the need for recirculation of solid heat carrier and produce high levels of steam. Research Objectives. Life cycle assessment (LCA) is an ideal method to quantify human health and environmental impacts associated with a product, and it has been applied to assess numerous biofuel conversion technologies. However, hydropyrolysis and hydroconversion of biomass is a relatively new reaction route, with only one prior LCA reported in the literature.8 In that study, a standalone IH2 process with H2 produced on-site from C1−C3 coproducts was analyzed, greenhouse gas (GHG) emission savings for IH2 gasoline and diesel blend ranged between 30 and 96% compared to comparable fossil fuel depending on feedstock types. However, hydroprocessing facilities integrated with existing petroleum refineries would likely to benefit from the on-site H2 production.9 IH2 process can be integrated with petroleum refineries with no hydrogen costs or capital costs.10 Therefore, our main objective in this current study is to understand the environmental implications of producing renewable gasoline and diesel by IH2 process integrated with one candidate Valero refinery in Memphis, TN. One goal of this study is to determine the cradle to gate life cycle GHG emissions of diesel and gasoline produced by the IH2 processes utilizing forest residues and corn stover as feedstock. Another goal is to explore the impacts of model parameter uncertainty in the calculation of GHG emissions by Monte Carlo simulation. A series of model assumptions and inputs such as forest residues fuel use, fertilizers application, IH2 process H2 requirements, and biochar use will probe the sensitivity of the GHG emissions. Finally, depletion of soil C from the forest landscape due to harvest residues removal may cause a delay of several decades for the benefits of biofuels displacing fossil fuels to be felt.11 Large quantity of stover removal is found to negatively affect soil carbon.12 It is important to understand the impact of indirect CO2 emissions due to residues harvest, and integrate into the life cycle emissions of renewable fuels produced from these feedstocks. ■ METHODS System Overview. The LCA was conducted following the ISO 14040 guidelines.13 The GHG impact was calculated using a 100 year global warming potential (GWP) according to the IPCC guidelines14 of gram CO2 equivalents of 1 for CO2, 28 for CH4, and 265 for N2O. The system boundary includes feedstock collection, transport, storage and processing (size reduction and drying), IH2 fuel production, waste treatment, and distribution and vehicular use of final fuel product. The functional unit of the study for reporting of results is 1 MJ of final fuel product, but all the input data were calculated based on different bases (Tables 1 and 2) and entered into SimaPro 8.0 for simulation. GHG credits of the coproducts such as electricity and ammonia/ammonium sulfate were dealt with using system expansion (displacement) method, the recommended method by ISO 1404115 and U.S EPA.16 Forest Residues. Woody biomass from forestland can sustainably supply feedstock for a future biobased economy and achieve forest- based economic prosperity and ecosystem quality through sustainable management.17 Forest residues and waste woods are predicted to provide 102 million t (MT) of dry biomass on an annual basis in 2030 at a price of $60 per dry t, which can yield approximately 26.5 billion L of biofuel, assuming a conversion rate of 320 L/dry t and 20% biomass loss in hauling, storing, and handling.18 A forest feedstock supply study was carried out to understand the economic feasibility of supplying forest residues to an IH2 processing facility next to an existing refiner. Two Valero refineries located in St. Charles, Louisiana, and Memphis, Tennessee, were evaluated. The St. Charles site was ruled out because of limited local feedstock supply Figure 1. Schematic flow diagram of the IH2 process. ACS Sustainable Chemistry & Engineering Research Article DOI: 10.1021/acssuschemeng.5b01173 ACS Sustainable Chem. Eng. 2016, 4, 284−290 285
  • 3. and lack of space for an expansion that would accommodate the handling and storage of feedstock. It was determined that efforts would be focused on the Valero Memphis, Tennessee, location. While the chemical composition of different tree species (softwoods and hardwoods) and tree components (bole, bark, tops) differ, the IH2 process is not limited to any one specie or species group. Feedstock sources are grouped into three categories: logging residues, unmerchantable roundwood (forest species currently not in demand by other forest industries), and mill residues. Logging residues are collected using conventional logging equipment, converted at roadside into chips, and hauled to the receiving location. Roundwood is processed into 8 ft and tree length logs using conventional logging equipment, transported to the receiving facility, and then converted into chips. Mill residues are collected in a sawmill facility, which include bark from round logs and pulpwood, sawdust and sawmill chips, and slabs. All feedstock is delivered to Memphis by truck, assuming fuel efficiency of 5 miles per gal (2.13 km/L diesel) and load capacity of 24 green t (12 bone dry t/truck). Three plant sizes of 250, 500, and 1000 short t (227, 454, and 908 t) per day were evaluated to investigate its effect on feedstock supply chain. The hauling distances vary from 113 to 132 km depending on the plant capacity. The residues feedstocks are pretreated (size reduction and drying) before being fed into the IH2 process. The inputs of forest residues feedstock supply are tabulated in Table 1. Corn Stover. Corn stover is a potential feedstock to produce biofuel and bioproducts at a relatively low cost.19 The U.S Department of Energy (DOE)18 estimates corn stover supply of 140 Mt (dry) in 2030 at the simulated price of $60/t. Corn stover yield has the potential to double in 2030, assuming a much larger fraction of no- until corn cultivation (57% vs 23% in baseline), and corn yields reach a national average of 655 bu/ha (vs baseline 497 bu/ha).18 Corn stover was studied by Cargill Inc. to optimize process economics for the IH2 process to be performed at one of Valero’s ethanol plants or refinery facilities across the United States. Information related to the corn stover supply chain components of harvesting, local storage, transportation, nutrient replacement, and grinding were collected from published models and literature of similar scope. The inputs of corn stover listed in Table 2 were primarily obtained from the supply chain study by Cargill and supplemented with the GREET 2014 model.20 The main inputs are diesel for stover collection and loading, and synthetic fertilizers used to displace the nutrients in the corn stover which are removed from the corn field. N fertilizer is assumed to be a combination of ammonia (31%), urea (23%), urea and ammonium nitrate solution (UAN) (32%), ammonium nitrate (4%), diammonium phosphate (6%), and monoammonium phosphate (4%).20 Fossil C in urea (CO(NH2)2) is assumed to be released into atmosphere as CO2 from soil. IPCC21 estimates that 1.325% of N in fertilizer and 1.225% of N in crop residues are emitted to atmosphere as N2O. Therefore, an additional 0.1% of N is emitted as N2O when N fertilizer are applied to soil to replace the nutrients removed in corn stover. N2O emission at stover storage was presented in the GREET model20 using the formula 0.048 × 0.0077 × 0.01 × 1 000 000 × 44/28/(1 − 0.048)/(1 − 0.02) = 6.23 g, where dry matter loss at storage is 4.8%, nitrogen accounts for 0.77% of biomass dry matter, 1% of nitrogen is assumed to be converted to N2O, and 2% of dry matter is lost at transport. Any potential emissions due to land management in corn/corn stover feedstock is not considered in this study. CH4 is produced only under anaerobic conditions at high temperature and can be oxidized in the surface area,22 so it is neglected in this study for corn stover stored in large square bales. The transport distance for corn stover (moisture content 15 wt %) to the Memphis facility is predicted as 153 km by Cargill. Cargill also investigated corn stover suppliers across the U.S and found that the shortest draw radius for corn stover supply is 53 km for Welcome, MN, and longest draw radius is 1842 km for Wilmington, CA. However, the Wilmington case was not included in this study because it is not environmentally and economically feasible to haul feedstock for such a long distance. IH2 Process. Various types of feedstocks have been tested in the IH2 system. All experiments were run at mild conditions with temperatures in the first stage from 340 to 470 °C and 370 to 400 °C in the second stage, with pressures range from 14 to 23 bar.33 H2 can be produced by reforming the CO and C1−C3 hydrocarbon gas product. If there is not enough H2 to meet the process requirement, it can be balanced by increasing the reactor temperature to make more light ends and less biochar. The results demonstrated that IH2 process directly converts the biomass feedstock to high quality hydrocarbon gasoline and diesel at high yields. Liquid IH2 gasoline and diesel blend yields from wood range from 25 to 28% (wt) under optimal processing conditions. Corn stover has lower liquid yields (21%) because of high ash content. It also presents more challenge than wood because of high chlorine and metals content. The typical yield and properties of IH2 products from wood and corn stover are presented in Table S1 of the Supporting Information. The liquid products were further analyzed after separating into gasoline, diesel, and vacuum gasoil cuts by distillation. IH2 gasoline Table 1. Inputs of Forest Residues Collection, Transport, and Processinga 227 t/day (bone dry) 454 t/day (bone dry) 908 t/day (bone dry) raw material processing in the woods diesel 2727 4860 8812 lubricating oil 19 39 80 hydraulic fluid 19 41 83 grease 51 108 220 gasoline 53 112 226 trucking from woods to facility dieselb 1999 4186 9444 lubricating oil 3 7 16 grease 1 2 5 yard equipment diesel 344 688 1376 lubricating oil 15 30 59 hydraulic fluid 15 31 62 grease 41 81 163 feedstock processing and dryingc electricity (kW h; size reduction) 7460 14920 29840 electricity (kW h; drying) 6378 12757 25513 a In liters unless stated otherwise. b Diesel use includes trucks empty return, assuming the same miles per gallon. c Feedstock size reduction uses electricity from the grid, and feedstock drying uses excess heat from the IH2 process steam. Table 2. Inputs of Corn Stovera Materials diesel, low-sulfur (corn stover collection)20 4.95 kg diesel, low-sulfur (corn stover loading)20 0.11 kg fertilizer (N) 7.71 kg fertilizer (K2O) 14.29 kg fertilizer (P2O5) 2.36 kg HDPE pipes (corn stover storage)20 0.34 kg Processes CO2 emissions from diesel/gasoline combustion (4.95 + 0.11) × 3.172 kg CO2 emissions from urea application (fossil C in urea) 7.71 × 0.55 × 44/60 kg additional N2O emissions from N fertilizers 7.71 × 0.001 × 44/28 kg N2O emission at corn stover storage 6.23 g transport, truck 10−20 t 150 km transport, truck 10−20 t, empty return 150 km a On 1 t dry basis as transported. The ratio of stover collected and transported is 1.04, which was based on handling mass loss 2%, storage loss 4.8%, and transport loss 2%. ACS Sustainable Chemistry & Engineering Research Article DOI: 10.1021/acssuschemeng.5b01173 ACS Sustainable Chem. Eng. 2016, 4, 284−290 286
  • 4. contains the same types of components as petroleum gasoline but has fewer olefins and more naphthenes. The properties of IH2 gasoline fraction is compared to petroleum gasoline and the results are tabulated in Table 3. The IH2 gasoline is very similar to petroleum gasoline but has a higher octane and a slightly higher Reid vapor pressure (RVP). The IH2 processing data for this LCA study was based on 1000 t/ day capacity (Table 4) and provided by GTI and engineering design data from Kellogg Brown & Root (KBR) LLC. Two cases were analyzed for the IH2 process from forest residues: In case one, the IH2 process is integrated with an existing petroleum refinery, where an on- site steam methane reforming (SMR) unit provides the H2 required for hydropyrolysis and hydroconversion. Biochar and C1−C3 coproducts are combusted to provide steam (heat) for feedstock drying, IH2 process, and electricity generation. Case two assumes a stand-alone IH2 facility, where H2 is produced internally using C1−C3 coproducts. Combustion of biochar and electricity imported from TN grid provide the heat and power for feedstock drying and IH2 process. The IH2 process also includes a third stage reactor where the diesel fraction is further hydrotreated to increase cetane index from 25 to 43. Two cases of IH2 process from corn stover were analyzed as well. In case one, corn stover is transported to the Memphis refinery where the feedstock is used to produce renewable fuel blend with H2 from an on- site SMR unit and excess electricity exported to the grid. In case two, corn stover is processed at Welcome, MN, which was selected because it has the lowest corn ethanol production cost. In case two, the IH2 facility is integrated with a third stage reactor where renewable diesel is further hydrotreated, and H2 is produced internally using the C1−C3 coproducts. The utilities used for corn stover processing is expected to be about the same as the forest residues processing, but the amount of final fuel product would be approximately73% of the fuels produced in the case of the forest residues. The difference in liquid yield is going to biochar, where the biochar yield increase is assumed to be the same as decrease in liquid fuel yield (mass balance). C footprint of catalyst is assumed to be negligible because its environmental impact was found minimal in a recent study.8 The Tennessee (TN) and Minnesota (MN) electricity mix profiles were created in SimaPro using State resource mix data from eGRID.23 The inventory of electricity inputs are tabulated in Table S2 of the Supporting Information. The final fuel products are assumed to be distributed to the adjacent Valero fuel terminal at Memphis, which are to be blended with fossil gasoline and diesel. Therefore, we assume that the fuel transport emissions are the same as their fossil counterparts. The IH2 process also produces a water−ammonia stream, which is sold as N fertilizer. Energy and GHG credits were assigned to this water−ammonia stream based on the environmental burden of synthetic N fertilizer. Ash is trucked and disposed of. Ash content in corn stover is approximately 10%, as compared to 0.5% in forest residues. Thus, more ash needs to be disposed of by landfill when the feedstock is corn stover. Cooling tower blowdown and storm/oily water are treated at the refinery wastewater treatment plant. GHG emissions of waste treatment were estimated in SimaPro as well. ■ RESULTS AND DISCUSSION GHG emissions of the two feedstocks, forest residues, and corn stover, as delivered to the Memphis refinery, are illustrated in Figure 2. Corn stover bears more environmental burden (98.4 vs 70.1 kg CO2 equiv/t), due to the synthetic fertilizer needed to replace the nutrients on corn fields, and longer transport distance to the processing facility. Feedstock transport is the top GHG contributor, accounting for over 50% of total GHG burdens of feedstock. GHG emission results of IH2 renewable fuel blend from forest residues and corn stover are tabulated in Table 5 and are compared to petroleum diesel and gasoline. Fuel production emissions are categorized into GHG from H2 production, utilities, credits from electricity, and ammonia/ammonium sulfate. In accordance with the EPA Renewable Fuel Standard (RFS)16 and the Low Carbon Fuels Standard (LCFS) of California,24 the net CO2 emissions of renewable fuels at the combustion stage are considered carbon neutral because CO2 is sequestered by photosynthesis during the growth of biomass. GHG emissions of IH2 fuel blend from forest residues are 26.59, and 12.75 g CO2 equiv/MJ, for case 1 and 2 respectively. Table 3. Properties of Typical IH2 Gasoline Fraction and Petroleum Gasoline33 IH2 gasoline from wood petroleum gasoline % C 87.9 86.9 % H 12.1 13.1 wt % n-paraffins 10.9 18.5 wt % i-paraffins 4.5 34.4 wt % aromatics 25.4 31 wt % napthenes 31 9.1 wt % oxygenates 0.0 0.09 RVP at 100 °F 9.5 8.8 octane number 88.3 84.7 density 0.761 0.722 Table 4. Materials and Energy Flow of the IH2 Facility Using Forest Residues As Feedstock case 1 case 2 Inputs biomass feedstock 1000 1000 t H2 from SMR 52150 0 kg electricity 0 60 MWh cooling water 6160 3085 t boiler feedwater 5630 5630 t inerting gas (N2) 7200 120a kg Outputs renewable gasoline 175800 169040 kg renewable diesel 83640 80420 kg electricity 576 0 MW h ammonia/ammonium sulfate 2000 2000 kg Waste Stream sour water 538 538 t cooling tower blowdown 1329 1329 t ash 3840 3840 kg a CO2 recovered from the H2 plant is used as inerting gas, instead of N2, thus less N2 required Figure 2. GHG emissions of forest residues and corn stover (as delivered to the Memphis refinery). ACS Sustainable Chemistry & Engineering Research Article DOI: 10.1021/acssuschemeng.5b01173 ACS Sustainable Chem. Eng. 2016, 4, 284−290 287
  • 5. Case 1 has higher GHG emission because of its H2 source, which is produced from fossil natural gas in SMR. However, it also benefits from the GHG credits from electricity exported to the grid. IH2 fuel blends from corn stover case 1 have higher GHG emissions than those produced from forest residues. With lower liquid yield, more biomass and utilities are used to produce the same amount of fuel products. However, corn stover cases benefit from electricity credits from burning coproduct biochar. Corn stover case 2 shows the lowest GHG emission result because feedstock transportation distance is the lowest, H2 is provided from C1−C3 coproducts, and electricity is provided by burning the biochar. Environmental burdens from waste treatment are higher for corn stover because of larger amount of ash disposed of. Overall, the IH2 fuels from forest residues and corn stover meet the 60% GHG reduction target mandated by the RFS standard to quality as advanced biofuel and as cellulosic biofuel. ■ SENSITIVITY ANALYSES Monte Carlo Simulation. Monte Carlo analysis is an ideal method to quantify parameter uncertainty in LCA.25 Therefore, a Monte Carlo simulation was carried out to determine responses to variations in inputs such as forest residues fuel use, fertilizers application, and IH2 process H2 requirements. Dias,26 Fan et al.,2 and Yoshioka et al.27 studied the use of forest residues as an energy resource. Fuel use for residue collection, chipping, and loading were obtained from aforementioned studies. The amounts of fertilizers applied to the corn field, especially nitrogen, play a major role in the GHG emissions of corn stover feedstock. The GREET model20 reports similar fertilizer requirements compared to those estimated by Cargill. The lower limit of fertilizers needed was calculated by the nutrient composition of removed corn stoverestimated by DOE.18 H2 is the most significant contributor to the life cycle GHG of IH2 fuels. The H2 requirement is estimated by KBR to increase by as high as 20% if pressure swing adsorption (PSA) is used for H2 recovery instead of a membrane. A Monte Carlo simulation was conducted for forest residues case 1 and corn stover case 1, as these two cases assume H2 comes from an external source (SMR), and thus carry GHG burden from H2 production. Standard deviations of the inputs parameters were calculated from the numbers reported in the aforementioned sources, and tabulated in Table S3 of the Supporting Information. GHG results by Monte Carlo simulation are illustrated in Figure S1 and S2 of the Supporting Information, which show a near normal distribution for IH2 fuels from both feedstocks. GHG emissions of IH2 fuels from forest residues have a 97.5% probability to reside within a range from 18.2 to 33 g CO2 equiv/MJ, with standard deviation of 3.76. IH2 fuels from corn stover have a 97.5% probability to range between 19.4 and 39.9 g CO2 equiv/MJ with standard deviation of 5.11. Soil Carbon Change Due to Feedstock Harvest. Forest harvest residue removal is found to introduce indirect CO2 emissions due to decrease of C flux into soil and litter pools. Palosuo et al.28 and Repo et al.29 estimated approximately 200 and 350 kg CO2/dry t residues due to decreasing soil carbon by residues removal within a 100-year rotation length, which could be an order of magnitude larger than the emissions from the residues production chain (collecting, chipping, transport). In order to estimate the impact of soil carbon change on renewable gasoline and diesel produced from forest residues, this range of indirect CO2 emissions were incorporated into our life cycle study. Life cycle GHG emissions of IH2 fuels increase significantly as shown in Table 6, due to the large amount of indirect CO2 emissions from soil C decrease. However, the IH2 fuels still show favorable GHG emissions compared to fossil fuels. A large quantity of stover removal is found to negatively affect soil carbon. Kim et al.12 used the DAYCENT model to compare the soil organic carbon in corn grain harvest to that in corn grain and stover harvest system. Their simulation indicated that soil carbon decreases by 95 to 290 kg CO2 equiv/ha if stover is harvested in additional to grain harvest, depending on the locations of corn field. This indirect CO2 emission due to soil carbon decrease were integrated into this study. Assuming a harvest index of 50%, stover yields (dry) Table 5. Life Cycle GHG Emissions of IH2 Renewable Fuel Blend g co2 equiv/mj forest residues case 1 forest residues case 2 corn stover case 1 corn stover case 2 petroleum dieselc petroleum gasolinec feedstock 8.05 8.37 11.81 7.97 7.54 8.3 fuel production (net) 17.63 3.47 16.71 −0.26 9.05 9.27 h2 51.00 0.00 69.87 0.00 other inputsa 0.33 3.80 0.45 7.92 credit from electricity −33.39 0.00 −53.18 −7.73 credit from ammonia −0.31 −0.32 −0.43 −0.44 waste treatment 0.06 0.06 0.13 0.13 fuel transport 0.85 0.85 0.85 0.85 0.85 1.03 fuel use 72.7 72.6 total 26.59 12.75 29.50 8.69 90 91.3 ghg reductionb 70% 86% 67% 90% a Other inputs include electricity, water, inerting gas, etc. b GHG reductions are compared to petroleum gasoline because IH2 fuel blend is 75% gasoline fraction c Data source: NETL DOE/NETL-2009/1346.34 Table 6. Life Cycle GHG Emissions of IH2 Fuel, Including Indirect CO2 Emissions from Soil C Decrease g CO2 eq/MJ case 1 baseline w/indirect CO2 emission (low) w/indirect CO2 emission (high) case 2 baseline w/indirect CO2 emission (low) w/indirect CO2 emission (high) forest residues 26.59 44.11 57.25 12.75 30.97 44.64 corn stover 29.50 31.31 34.21 8.69 10.57 13.59 ACS Sustainable Chemistry & Engineering Research Article DOI: 10.1021/acssuschemeng.5b01173 ACS Sustainable Chem. Eng. 2016, 4, 284−290 288
  • 6. range from 5930 to 9050 kg/ha in the eight counties studied by Kim et al., which indicates that indirect CO2 emission due to stover harvest range from 15 to 40 kg CO2 eq/dry t. Life cycle GHG emissions of IH2 fuels from corn stover tabulated in Table 6. The indirect CO2 emissions are lower than those for forest residues. As shown in Table 6, indirect CO2 emissions due to residue removal are significant. It is feasible to estimate these landscape effects through the use of appropriate carbon dynamic models, in forest landscapes using a model such as the Carbon Budget Model of the Canadian Forest System (CBM-CFS), and in agricultural settings using the DAYCENT or iEPIC models. Future model simulations are warranted to better understand the life cycle impact of IH2 fuel produced from forest residues and corn stover. Biochar as a Soil Amendment. Biochar produced from pyrolysis and hydropyrolysis reactions is recognized as a promising soil amendment, which improves soil fertility and sequesters carbon.30,31 Therefore, we investigated the carbon implication of applying biochar coproduct from IH2 processing of corn stover as soil amendment. In the base case, biochar is combusted to generate electricity for internal use and exported to the grid. If biochar is used as soil amendment, additional electricity is used to compensate the energy in biochar, but C in the biochar is sequestered in soil. C ratio of biochar is assumed to be 51.2%, of which 80% is assumed to be sequestered.20 In addition, nutrients in biochar can offset fertilizers use. The N, P, and K composition in biochar from corn stover pyrolysis was reported by Mullen et al.31 The amount of fertilizers (N, P2O5, K2O) avoided were calculated as 0.12, 0.25, and 0.24 g/MJ fuel, respectively. Associated GHG emissions avoided by applying biochar were calculated by multiplying the quantities of fertilizers avoided and their corresponding emission factors. The life cycle GHG emissions of IH2 fuels from corn stover reduce by 6.3 and 6.0 CO2 equiv/MJ, respectively, for case 1 and case 2. This indicates that biochar from IH2 of corn stover has a higher GHG mitigation capacity if used as a soil amendment than combusted to replace electricity. Moreover, additional GHG mitigation can be achieved by applying biochar to soil as it is found to reduce soil N2O emission.32 ■ ASSOCIATED CONTENT *S Supporting Information The Supporting Information is available free of charge on the ACS Publications website at DOI: 10.1021/acssusche- meng.5b01173. Details of IH2 fuel properties and yield, TN and MN electricity generation mix, and Monte Carlo simulation (PDF) ■ AUTHOR INFORMATION Corresponding Author *E-mail: jiqingf@mtu.edu. Tel.: 906-487-1092. Fax: 906-487- 3213. Notes The authors declare no competing financial interest. ■ REFERENCES (1) Czernik, S.; Bridgwater, A. V. Overview of applications of biomass fast pyrolysis oil. Energy Fuels 2004, 18 (2), 590−598. (2) Fan, J. Q.; Kalnes, T. N.; Alward, M.; Klinger, J.; Sadehvandi, A.; Shonnard, D. R. Life cycle assessment of electricity generation using fast pyrolysis bio-oil. Renewable Energy 2011, 36 (2), 632−641. (3) Mohan, D.; Pittman, C. U.; Steele, P. H. Pyrolysis of wood/ biomass for bio-oil: A critical review. Energy Fuels 2006, 20 (3), 848− 889. (4) Bridgwater, A. V. Upgrading Biomass Fast Pyrolysis Liquids. Environ. Prog. Sustainable Energy 2012, 31 (2), 261−268. (5) Zhang, Q.; Chang, J.; Wang, T. J.; Xu, Y. Review of biomass pyrolysis oil properties and upgrading research. Energy Convers. Manage. 2007, 48 (1), 87−92. (6) Oasmaa, A.; Czernik, S. Fuel oil quality of biomass pyrolysis oils - State of the art for the end user. Energy Fuels 1999, 13 (4), 914−921. (7) Marker, T. L.; Felix, L. G.; Linck, M. B.; Roberts, M. J. Integrated Hydropyrolysis and Hydroconversion (IH2) for the Direct Production of Gasoline and Diesel Fuels or Blending Components from Biomass, Part 1: Proof of Principle Testing. Environ. Prog. Sustainable Energy 2012, 31 (2), 191−199. (8) Maleche, E.; Glaser, R.; Marker, T.; Shonnard, D. A Preliminary Life Cycle Assessment of Biofuels Produced by the IH2 (TM) Process. Environ. Prog. Sustainable Energy 2014, 33 (1), 322−329. (9) Stratton, R. W. Life cycle assessment of greenhouse gas emissions and non-CO2 combustion effects from alternative jet fuels. MS. thesis, Massachusetts Institute of Technology, 2010. (10) Tan, E. C. D.; Marker, T. L.; Roberts, M. J. Direct Production of Gasoline and Diesel Fuels from Biomass via Integrated Hydropyrolysis and Hydroconversion Process-A Techno- economic Analysis. Environ. Prog. Sustainable Energy 2014, 33 (2), 609−617. (11) Mckechnie, J.; Colombo, S.; Chen, J. X.; Mabee, W.; Maclean, H. L. Forest Bioenergy or Forest Carbon? Assessing Trade-Offs in Greenhouse Gas Mitigation with Wood-Based Fuels. Environ. Sci. Technol. 2011, 45 (2), 789−795. (12) Kim, S.; Dale, B. E.; Jenkins, R. Life cycle assessment of corn grain and corn stover in the United States. Int. J. Life Cycle Assess. 2009, 14 (2), 160−174. (13) International Organization for Standardization (ISO). ISO 14040: Environmental management−Life cycle assessment−Principles and framework; Geneva, Switzerland, 2006. (14) Intergovernmental Panel on Climate Change. Climate Change 2007: The Physical Science Basis. Contribution of Working Group I to the Fourth Assessment Report; Cambridge University Press: Cambridge, United Kingdom, and New York, NY, USA, 2007; p 996. (15) International Organization for Standardization (ISO). Environ- mental management-Life cycle assessment-Goal and scope definition and inventory analysis. In ISO 14041:1998(E); Geneva, Switzerland, 1998. (16) U.S Environmental Protection Agency. Regulatory Impact Analysis: Renewable Fuel Standard Program Chapter 6, Life cycle Impacts on Fossil Energy and Greenhouse Gases, EPA420-R-07-004; 2007. (17) Zhu, J. Y.; Pan, X. J.; Zalesny, R. S. Pretreatment of woody biomass for biofuel production: energy efficiency, technologies, and recalcitrance. Appl. Microbiol. Biotechnol. 2010, 87 (3), 847−857. (18) U.S. Department of Energy, U.S. Billion-Ton Update: Biomass Supply for a Bioenergy and Bioproducts Industry; Oak Ridge National Laboratory: Oak Ridge TN, 2011; p 227. (19) Graham, R. L.; Nelson, R.; Sheehan, J.; Perlack, R. D.; Wright, L. L. Current and potential US corn stover supplies. Agron. J. 2007, 99 (1), 1−11. (20) Wang, M. GREET 1 2014 The Greenhouse Gases, Regulated Emissions, and Energy Use in Transportation Model; Argonne National Laboratory, 2014. (21) De Klein, C.; Novoam, R.; Ogle, S.; Smith, K. A.; Rochette, P.; Wirth, T. C.; McConkey, B. G.; Mosier, A.; Rypdal, K.; Walsh, M.; Williams, S. A. N2O emissions from managed soils, and CO2 emissions from lime and urea application; Intergovernmental Panel for Climate Change (IPCC), 2006; Vol. 4. (22) Wihersaari, M. Evaluation of greenhouse gas emission risks from storage of wood residue. Biomass Bioenergy 2005, 28 (5), 444−453. ACS Sustainable Chemistry & Engineering Research Article DOI: 10.1021/acssuschemeng.5b01173 ACS Sustainable Chem. Eng. 2016, 4, 284−290 289
  • 7. (23) EPA. U. S. eGRID Year 2010 Summary Tables. http://www. epa.gov/cleanenergy/documents/egridzips/eGRID_9th_edition_V1- 0_year_2010_Summary_Tables.pdf. (24) California Air Resources Board. Proposed Regulation to Implement the Low Carbon Fuel Standard; Sacramento CA, 2009; p 374. (25) Peters, G. P. Efficient algorithms for life cycle assessment, input- output analysis, and Monte-Carlo analysis. Int. J. Life Cycle Assess. 2007, 12 (6), 373−380. (26) Dias, A. C. Life cycle assessment of fuel chip production from eucalypt forest residues. Int. J. Life Cycle Assess. 2014, 19 (3), 705−717. (27) Yoshioka, T.; Aruga, K.; Nitami, T.; Kobayashi, H.; Sakai, H. Energy and carbon dioxide (CO2) balance of logging residues as alternative energy resources: system analysis based on the method of a life cycle inventory (LCI) analysis. J. For. Res. 2005, 10 (2), 125−134. (28) Palosuo, T.; Wihersaari, M.; Liski, J. Net greenhouse gas emissions due to energy use of forest residuesimpact of soil carbon balance. EFI proceedings, Joensuu, Finland, September 25−28, 2000; 2001; pp 115−130. (29) Repo, A.; Tuomi, M.; Liski, J. Indirect carbon dioxide emissions from producing bioenergy from forest harvest residues. GCB Bioenergy 2011, 3 (2), 107−115. (30) Singh, B.; Singh, B. P.; Cowie, A. L. Characterisation and evaluation of biochars for their application as a soil amendment. Aust. J. Soil Res. 2010, 48 (6−7), 516−525. (31) Mullen, C. A.; Boateng, A. A.; Goldberg, N. M.; Lima, I. M.; Laird, D. A.; Hicks, K. B. Bio-oil and bio-char production from corn cobs and stover by fast pyrolysis. Biomass Bioenergy 2010, 34 (1), 67− 74. (32) Cayuela, M. L.; van Zwieten, L.; Singh, B. P.; Jeffery, S.; Roig, A.; Sanchez-Monedero, M. A. Biochar’s role in mitigating soil nitrous oxide emissions: A review and meta-analysis. Agric., Ecosyst. Environ. 2014, 191, 5−16. (33) Roberts, M.; Marker, T. Biomass to Gasoline and Diesel Using Integrated Hydropyrolysis and Hydroconversion; Gas Technology Institute, Dec 28, 2012; p 128. (34) Gerdes, K. J.; Skone, T. J. Development of Baseline Data and Analysis of Life Cycle Greenhouse Gas Emissions of Petroleum-Based Fuels; National Energy Technology Laboratory, Nov 26, 2008; p 310. ACS Sustainable Chemistry & Engineering Research Article DOI: 10.1021/acssuschemeng.5b01173 ACS Sustainable Chem. Eng. 2016, 4, 284−290 290