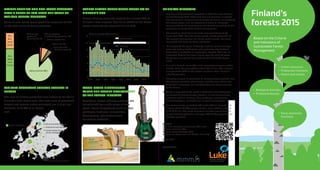
Finland’s forests 2015
•
0 j'aime•1,209 vues

Brochure: Finland´s forests 2015. Load pdf: http://www.biotalous.fi/wp-content/uploads/2016/02/finlands-forests-facts-2015.pdf

Recommandé
Recommandé
Contenu connexe
Tendances
Tendances (20)
Similaire à Finland’s forests 2015
Similaire à Finland’s forests 2015 (20)
Plus de Biotalous.fi
Plus de Biotalous.fi (20)
Dernier
Dernier (20)
Finland’s forests 2015
- 1. Nature tourism and non-wood products have a share of 30% from the value of various forest products Value of non-wood forest products accounts for 6% of the total value of forest products. Wood-based bioproducts widen the future development of the forest industry Traditional forest industry products are being joined by a wide range of new wood-based bioproducts such as fibre packages, biodiesel, composites, biopolymers, pharmaceuticals, cosmetics products. SOURCE: Statistical Yearbook of Forestry, 2014. Luke. Statistics Finland, 2015 National Forest Strategy, 2015. Authors: Jari Parviainen and Markus Lier, Luke www.luke.fi Publishers: Principal messages • The Finnish Government approved in 2015 the new National Forest Strategy 2015–2025 with goals 1) creating a competi- tive operational environment for forest business, 2) renewing the forest sector, and its structure in order to diversify forest products, 3) continuing to use forests according to the principles of sustainable forest management. • The growing stock has increased over past 50 years by more than 40%. Over the same period, wood equivalent to the current tree volume, 2,3 billion cubic metres, has been harvested and used for forest products. • To safeguard biological diversity, close to nature manage- ment, by leaving dead wood and protecting key habitats have been undertaken in commercial forests. The area of protected forests has been tripled over the past 40 years, being now nearly 3 million hectares (13.0 % of the forest area). • Finland’s forests are carbon sink, removing annually carbon dioxide from the atmosphere about 30 million. This amount compensated 40% of the carbon emission from Finland’s industry per year. • Changing climate is estimated to increase forest growth, but the extreme weather phenomena, notably local storm and bark beetle damages will probably become more common in the future. • Wood is expected to be more in demand in the production of renewable forest energy, biofuels, in new bioeconomy products such as clothing, fiber packages, composites, pharmaceuticals, cosmetic and in wood construction. • The forest sector contribute 4% of the GDP of Finland, and employ about 65 000 people. Annual value added in forest is 6.7 € billion. The most important market area of Finnish forest industry products is Europe, 70% of the export of the wooden products. Strictly protected forests largest in Europe The area of strictly protected area accounts for 9% of Finland’s total forest area. The total area of protected forests and forests under restricted use is 3 million hectares, or 13.0% of all forest land. Forest sector contributes about 4% of Finland’s GDP Forest industry products account for almost 20% of Finland’s total exports. The value added of the forest sector accounts for about 6,7 billion EUR. Based on the Criteria and Indicators of Sustainable Forest Management Finland’s forests 2015 • Forest resources • Productive functions • Health and vitality • Biological diversity • Protective forests 0 2 4 6 8 10 12 Share of the GDP (1975–2013), % Forest sector Forestry Wood-products industries Pulp and paper industries 1975 1980 1985 1990 1995 2000 2005 2010 No active intervention Minimum intervention Conservation through active management Scale: 1 million ha Source: State of Europe´s Forests. Lichen, exports <1% Moose etc. 7% Game birds 2% Reindeer meat 2% Nature tourism 88% 30% Non- wood goods 70% Wood from forests Wild berries, purchased by companies 1% Wild mushrooms, purchased by companies <1% • Socio-economic functions
- 2. Wood-based fuels 25% of total energy consumption The use of wood-based fuels has increased in Finland since the 1990s. The share of wood-based fuels of all renewable energy sources accounted for over 85%. Finland – the most extensive forest cover in Europe Some 23 million hectares (76%) is under forests in Finland, representing about 11% of the forest area in Europe (210 million ha). Over 60% of forests are privatly owned Forest ownership category Forest land area Growing stock Annual increment Commercial roundwood removals Share (%) Private 60.1 64.7 72.8 82.1 Companies 8.2 8.7 - - State 25.4 20.8 27.2 17.9 Other (municipalities, 5.4 5.7 - - parishes, associations) Forests sequestrate nearly 40% of the CO2 emissions of Finnish industries Finland’s forests are major carbon sinks, as they absorb large amount of CO2 from the atmosphere. Wood as building material promoted In Finland, wood accounts for about 40% of all building material. 80% of the single family houses and 50% of the linked houses are made of wood as a load bearing material. The aim is to increase the construction of wooden multi-storey apartment buildings from the present share 2% until 10% before the 2020. Growing stock steadily increased over last 50 years According to the latest National Forest Inventory (NFI) the volume of growing stock has increased by more than 40% since 1971, being now 2,332 million m3 . Annual increment exceeded the drain by 30% Since the mid-1970s, wood equivalent to the current volume of the tree stock, about 2,332 million m3 , has been harvested and used. Old and young generation of the family thinking on the management of their own forest property. Forest area in % of land area 1–14 15–23 24–32 33–36 37–48 49–63 64–76 Source: State of Europe´s Forests. mill. m³ 0 10 20 30 40 50 60 70 80 90 100 110 Broadleaves Total increment Drain SpruceIncrement by tree species Pine Annual increment of growing stock and annual drain (1935–2013) 1980 200019901960 197019501940 2010 mill. m³ 0 500 1000 1500 2000 2500 Pine Spruce Broadleaves 1921– 1924 1936– 1938 1951– 1953 1964– 1970 1971– 1976 1977– 1984 1986– 1994 1996– 2003 2004– 2008 2009– 2013 Growing stock volume on forest land, 1921–2013 1990 2000 20101995 2005 0 20 40 60 80 100 120 Consumption of renewable energy sources (TWh), 1970–2013 TWh Other forest industry by-products and waste products Black liquor and other concentrated liquors Small-scale combustion of wood Heating and power plants Hydro power About 2000 m3 of wood were used to build the Metla House in Joensuu. This is equal to a storage of 1900 tons of carbon for at least 200 years. -60 -40 -20 0 20 40 60 80 100 mill. t CO2 -60 -40 -20 0 20 mill. t CO2 Finnish greenhouse removals from forest land carbon pools Finnish greenhouse gas emissions Growing stock Soil, mineral soil Carbon balance between emissions of fossil carbon dioxide and net changes in sequestration of carbon dioxide by forest land Changes of carbon sequestration of forest land by share of wooden biomass, dead organic matter and soil organic matter Soil, peat soils 1990 1995 2000 2005 2010 1990 1995 2000 2005 2010