Top profile Call Girls In dimapur [ 7014168258 ] Call Me For Genuine Models W...
Daily Market Insight-21 July.pdf
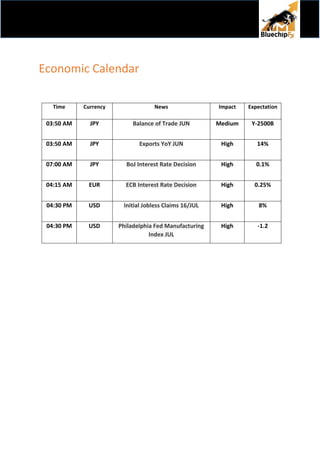
1. Economic Calendar
Time Currency News Impact Expectation
03:50 AM JPY Balance of Trade JUN Medium Y-2500B
03:50 AM JPY Exports YoY JUN High 14%
07:00 AM JPY BoJ Interest Rate Decision High 0.1%
04:15 AM EUR ECB Interest Rate Decision High 0.25%
04:30 PM USD Initial Jobless Claims 16/JUL High 8%
04:30 PM USD Philadelphia Fed Manufacturing
Index JUL
High -1.2
2. AUD/USD TREND: NEUTRAL
Technical Outlook:
On the daily chart, the AUD/USD pair retreated from the previous session highs of 0.6930. The spot
faces resistance near the psychological 0.6900 level. A STORONG GREEN CANDLESTICK INDICATES
THE PRESENCE OF THE BULLS.
Indicators Daily chart Status
RSI 52 Bullish
STOCHASTIC 90 Bullish
MACD Below midline Bearish
200 EMA 0.7162 Bearish
Outlook NEUTRAL
Strategy
Action Entry Target 1 Target 2 Stop Loss
BUY 0.6905 0.6935 0.6965 0.6875
3. NZD/USD TREND: NEUTRAL
Technical Outlook:
NZD/USD started the session on a higher note. But fell swiftly to test intra day low of 0.6215. More
gains if the spot surpass the 0.6240 level during the session.
Indicators Daily chart Status
RSI 50 Bullish
STOCHASTIC 81 Bullish
MACD Below midline Bearish
200 EMA 0.6612 Bearish
Outlook NEUTRAL
Strategy
Action Entry Target 1 Target 2 Stop Loss
BUY 0.6230 0.6260 0.6290 0.6200
4. EUR/USD TREND: NEUTRAL
Technical Outlook:
The EUR/USD pair registered good gains after slipping from the highs of 1.0274 in the last session.
However, a daily acceptance above the mentioned level is required to sustain further gains.
Indicators Daily chart Status
RSI 44 Bearish
STOCHASTIC 51 Bullish
MACD Below midline Bearish
200 EMA 1.0924 Bearish
Outlook NEUTRAL
Strategy
Action Entry Target 1 Target 2 Stop Loss
BUY 1.0215 1.0245 0.0275 1.0185
.
5. GBP/USD TREND: NEUTRAL
Technical Outlook:
GBP/USD hovers in the familiar trading range with mildly bullish bias. The price moves along the
ascending trend line from the lows of 1.1759.
Indicators Daily chart Status
RSI 44 Bearish
STOCHASTIC 67 Bullish
MACD Below midline Bearish
200 EMA 1.2874 Bearish
Outlook NEUTRAL
Strategy
Action Entry Target 1 Target 2 Stop Loss
BUY 1.1990 1.2020 1.2050 1.1960
6. USD/JPY TREND: BULLISH
Technical Outlook:
On the daily chart, the USD/JPY pair retreated from the intraday high of 138.55. However, a vital
support is placed around 138.0. A dip buying opportunity for traders.
Indicators Daily chart Status
RSI 65 Bullish
STOCHASTIC 73 Bullish
MACD Above midline Bullish
200 EMA 123.91 Bullish
Outlook BULLISH
Strategy
Action Entry Target 1 Target 2 Stop Loss
BUY 138.10 138.40 137.70 137.80
7. USD/CAD TREND: NEUTRAL
Technical Outlook:
USD/CAD harness loss as it failed to sustain the previous session’s fragile recovery. A break below
1.2850 would intensify the selling further.
Indicators Daily chart Status
RSI 45 Bearish
STOCHASTIC 6 Bearish
MACD Above midline Bullish
200 EMA 1.2744 Bullish
Outlook NEUTRAL
Strategy
Action Entry Target 1 Target 2 Stop Loss
SELL 1.2870 1.2840 1.2810 1.2900
8. USD/CHF TREND: NEUTRAL
Technical Outlook:
The pair break 0.9700 mark as it continues to follow the larger downside trend extending from the
highs of 1.0066.
Indicators Daily chart Status
RSI 48 Bearish
STOCHASTIC 39 Bearish
MACD Above midline Bullish
200 EMA 0.9473 Bullish
Outlook NEUTRAL
Strategy
Action Entry Target 1 Target 2 Stop Loss
SELL 0.9700 0.9670 0.9640 0.9730
9. GOLD TREND: BEARISH
Technical Outlook:
XAU/USD fresh yearly lows as it breaks below the psychological $1,700 level. The precious metal
offers selling opportunity further. Any bounce back could be a good trading entry for sell.
Indicators Daily chart Status
RSI 23 Bearish
STOCHASTIC 1 Bearish
MACD Below midline Bearish
200 EMA $1,835 Bearish
Outlook BEARISH
Strategy
Action Entry Target 1 Target 2 Stop Loss
SELL $1,695 $1,685 $1,675 $1,705