
Recommended
More Related Content
Similar to Daily Report-April 25 (1).pdf
Similar to Daily Report-April 25 (1).pdf (20)
More from BluechipInvestment
More from BluechipInvestment (20)
Recently uploaded
Recently uploaded (20)
Daily Report-April 25 (1).pdf
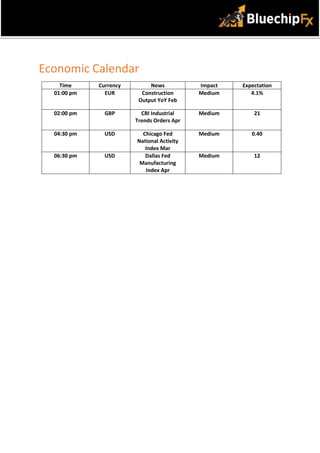
- 1. Economic Calendar Time Currency News Impact Expectation 01:00 pm EUR Construction Output YoY Feb Medium 4.1% 02:00 pm GBP CBI Industrial Trends Orders Apr Medium 21 04:30 pm USD Chicago Fed National Activity Index Mar Medium 0.40 06:30 pm USD Dallas Fed Manufacturing Index Apr Medium 12
- 2. AUD/USD TREND: Bearish Technical Outlook: AUD/USD extends the decline as the fresh trading session begins. The pair follows the footprint of Friday’s sell-off, a massive fall of nearly 100-pip. The strong red candlestick indicates the selling to continue. Indicators Daily chart Status RSI 32 Bearish STOCHASTIC 2.58 Bearish MACD Above midline Bearish 200 EMA 0.7340 Bearish Outlook Bearish Strategy Action Entry Target 1 Target 2 Stop Loss Sell 0.7170 0.7100 0.7070 0.7200
- 3. NZD/USD TREND: Bearish Technical Outlook: NZD/USD is expected to slide down on Monday as the sustained selling pressure pushed the price to test the three-month low around 0.6590. The spot fell nearly 600-pip in the last four-session. Indicators Daily chart Status RSI 36 Bearish STOCHASTIC 1.16 Bearish MACD Below midline Bearish 200 EMA 0.6875 Bearish Outlook Bearish Strategy Action Entry Target 1 Target 2 Stop Loss Sell 0.6600 0.6570 0.6540 0.6630
- 4. EUR/USD TREND: Bearish Technical Outlook: EUR/USD refused to stop falling as can be seen on the daily chart. The spot has breached the crucial support of 1.0800. Now it hovers near multi-month support around 1.0770. Indicators Daily chart Status RSI 37 Bearish STOCHASTIC 10 Bearish MACD Below mid line Bearish 200 EMA 1.1235 Bearish Outlook Bearish Strategy Action Entry Target 1 Target 2 Stop Loss Sell 1.0780 1.0750 1.0720 1.0810 .
- 5. GBP/USD TREND: Bearish Technical Outlook: GBP/USD fell sharply on Friday from the highs of 1.3037 with a fall of more than 200-pip. The spot is on the verge to slip below the 1.2800 mark. If that happens more downside would be possible. Indicators Daily chart Status RSI 42 Bearish STOCHASTIC 29 Bearish MACD Below midline Bearish 200 EMA 1.3470 Bearish Outlook Bearish Strategy Action Entry Target 1 Target 2 Stop Loss Sell 1.2810 1.2780 1.2750 1.2840
- 6. USD/JPY TREND: Bullish Technical Outlook: USD/JPY continues to hover in the range of 128.0 and 129.0 for the past two-three session. The pair could fell few points before marching up. Indicators Daily chart Status RSI 77 Bullish STOCHASTIC 84 Bullish MACD Above midline Bullish 200 EMA 115 Bullish Outlook Bullish Strategy Action Entry Target 1 Target 2 Stop Loss Sell 128.60 128.30 128.0 128.90
- 7. USD/CAD TREND: Bullish Technical Outlook: USD/CAD recovered sharply from the lows of 1.2450 in the previous session. Now, manages to hold around 1.2730 Traders could open the long position with strict stop loss. Indicators Daily chart Status RSI 60 Bullish STOCHASTIC 97 Bullish MACD Below midline Bearish 200 EMA 1.2630 Bullish Outlook Bullish Strategy Action Entry Target 1 Target 2 Stop Loss Buy 1.2730 1.2760 1.2790 1.2700
- 8. USD/CHF TREND: Bullish Technical Outlook: USD/CHF approaches multi-month highs around 0.9600. A daily close above 0.9650 will bring more gains in the spot. A resurgence in the buying pressure formulate a green candlestick in today’s session. Indicators Daily chart Status RSI 72 Bullish STOCHASTIC 95 Bullish MACD Above midline Bullish 200 EMA 0.9230 Bullish Outlook Bullish Strategy Action Entry Target 1 Target 2 Stop Loss Buy 0.9580 0.9610 0.9640 0.9550
- 9. GOLD TREND: Bearish Technical Outlook: XAU/USD broke the downside range of predefined set of $1,920 and $1,950. Further, there is no signs of bearish exhaustion. More downside on the cards. Indicators Daily chart Status RSI 41 Bearish STOCHASTIC 0 Bearish MACD Above midline Bullish 200 EMA $1,831 Bullish Outlook Bearish Strategy Action Entry Target 1 Target 2 Stop Loss Sell $1,920 $1,910 $1,900 $1,930