Recommended

Recommended
More Related Content
What's hot
What's hot (20)
Similar to National annual report
Similar to National annual report (20)
More from CACTUS_JP
More from CACTUS_JP (14)
Recently uploaded
Recently uploaded (20)
National annual report
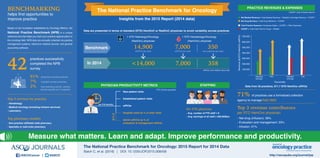
- 1. wRVUs: work relative value units FTE: full-time equivalent Balch C. et al. (2016) | DOI: 10.1200/JOP.2015.008458 The National Practice Benchmark for Oncology: 2015 Report for 2014 Data New patient visits Established patient visits wRVUs per FTE HemOnc Hospital visits as % of total visits Admin wRVUs as % of evaluation & management wRVUs http://ascopubs.org/journal/jop /ASCOCancer | @ASCO Data from 35 practices, 671.7 STD HemOnc wRVUs Insights from the 2015 Report (2014 data) PHYSICIAN PRODUCTIVITY METRICS STAFFING PRACTICE REVENUES & EXPENSES Based on the foundation established by Oncology Metrics, the National Practice Benchmark (NPB) is a unique reference tool that helps you mark your practice against peers in the oncology field. NPB data are annually collected via practice management systems, electronic medical records, and general accounting software. BENCHMARKING helps find opportunities to improve practice practices successfully completed the NPB survey The National Practice Benchmark for Oncology 42 Top 3 services by practice 91% physician-owned practices 3587,000<14,000 7% hospital-owned practices 2% free-standing cancer centers owned equally by 2 hospitals - Hematology - Medical oncology (including infusion services) - Laboratory Top 3 revenue contributors per STD HemOnc physician - Net drug (Infusion): 28% - Evaluation and management: 23% - Infusion: 21% Top pharmacy models - Non-practice–affiliated retail pharmacy - Specialty or mail-order pharmacy Data are presented in terms of standard (STD) HemOnC or RadOnC physician to avoid variability across practices In 2014 1 STD Hematology/Oncology (HemOnc) physician 1 STD Radiology/Oncology (RadOnc) physician 7,000 wRVUs per year 71% of practices use a formalized collection agency to manage bad debt 350 new patients per year 14,900 wRVUs per year Measure what matters. Learn and adapt. Improve performance and productivity. Net Drug Revenue = Total Drug Revenue – COGPF Net Medical Revenue = Total Medical Revenue – Radiation Oncology Revenue – COGPF COGPF = Total Cash Paid for Drugs – Rebate Total Practice Expense = Employee Salary + COGPF + Other Expenses Percentile Adjusted average Adjusted average 75th 75th – 100,000 200,000 300,000 400,000 500,000 600,000 Revenue($)/STDHemOnc(wRVU) 700,000 - Avg. number of FTE staff = 9 Per FTE physician - Avg. earnings of all staff > 500,000$/yr COGPF: Cost of Goods Paid for N E W Benchmark