1. Lake Tahoe Water Clarity Project
Spaky Ching
Student, UC Berkeley
Annie Lu
Student, UC Berkeley
Christine Stontz
Student, UC Berkeley
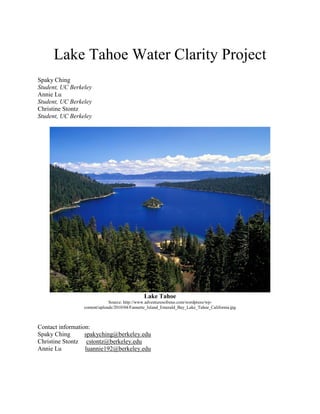
Lake Tahoe
Source: http://www.adventuresofreno.com/wordpress/wp-
content/uploads/2010/04/Fannette_Island_Emerald_Bay_Lake_Tahoe_California.jpg
Contact information:
Spaky Ching spakyching@berkeley.edu
Christine Stontz cstontz@berkeley.edu
Annie Lu luannie192@berkeley.edu
2. Lands that would be impacted:
For this project, the Lake Tahoe basin will be impacted. Both urban and non-urban areas will be
affected by the construction of bioretention ponds and revegetation with native plants. The
region is located on the border of California and Nevada and includes the Tahoe National Forest.
Executive Summary
This document outlines a project that will take place in the Lake Tahoe basin to improve
the lake’s water clarity. The Lake Tahoe basin consists of 323,200 acres, 80,800 of which are
considered urban and 242,400 of which are considered non-urban. The area acts as a filtration
system for the water that enters Lake Tahoe.
The basin is a popular tourist destination due to its beautiful alpine surroundings. Thus,
the area’s economy is largely based on revenue generated from recreational activities during the
summer and winter months. This seasonal employment has contributed to the higher
unemployment rate of the area relative to the state. Moreover, the influx of visitors during tourist
seasons increases the environmental degradation in the basin. More runoff from sediments and
nutrients are generated, causing the lake’s water clarity to drop. Data from the Univeristy of
California, Davis supports this: 40 years ago clarity reached down to approximately 100 m,
compared to recent clarity values of approximately 60-70 m.
To improved Lake Tahoe’s water clarity, this project centers around filtration and
revegetation of both urban areas and non-urban areas. Filtration will be conducted through the
construction of bioretention ponds while revegetation will make use of native plants. Both
methods are to reduce the amount of sediment runoff, nitrogen runoff, and phosphorus runoff.
Goal programming was used to minimize the total deviation in sediment runoff reduction,
nitrogen runoff reduction, phosphorus runoff reduction, and cost from target values established
through scientific literature. A budget of $149,375,000 for this project was determined by finding
applicable annual and one-time funding sources through the Tahoe Environmental Improvement
Program.
Goal programming showed that the best solution satisfied the objective function and met
two of the four target values (sediment runoff reduction and cost). This solution stated that
bioretention ponds should be constructed on approximately 45,000 acres of urban land and on
approximately 112,000 acres of non-urban land, and that revegetation will take place on
approximately 35,000 acres of urban land and on approximately 130,000 acres of non-urban
land. Both a quarterly financial analysis for a two-year period and an annual financial analysis
for a five-year period were conducted. As this is not a project intended to generate revenue, the
financial analyses focused on how much funding would remain. The analyses showed that
$166,483,000 would remain after five years; in present-day dollars this is $150,788,782.40. This
shows that the project will not operate at a loss.
Introduction
Lake Tahoe is admired for its clarity and beautiful alpine surroundings. Most of the
terrain is mountainous (with peaks more than 10,000ft). On the border of California and Nevada,
one-third of the basin is in Nevada and two-thirds are in California. The basin is bounded by the
Sierra Nevada to the west and the Carson Range to the east.
During the second half of the 20th century, the decline in Lake Tahoe’s water clarity has
become a major concern. The long-term trend toward of decreasing water clarity is strongly
linked to runoff from urban and forest sources in the Lake Tahoe Basin. Water clarity is the
3. primary measure of the basin’s health, as it reflects water quality. It is estimated that in 10 years
the lake will lose its blue brilliance. Nonpoint source (NPS) pollution, such as sedimentation and
nutrient runoff, is contributing to the decline in Lake Tahoe's water clarity. Fine sediments
become suspended and decrease lake clarity, while nutrients such as phosphorus and nitrogen
promote excess algal growth that further decreases clarity.
To improve water quality, sediment, nitrogen and phosphorus runoffs to the lake should
be reduced. To do this, installation of filtration systems and revegetation can be applied to both
the urban and nonurban area of the Lake Tahoe basin.
Geography/ Geology
Lake Tahoe is located along the border of California and Nevada. About 1/3 of the basin
is in Nevada and 2/3 is in California. The basin is bounded by the Sierra Nevada to the west and
the Carson Range to the east. The Lake Tahoe Basin was formed by geologic block (normal)
faulting about 2 to 3 million years ago. The down-dropping of the Lake Tahoe Basin and the
uplifting of the adjacent mountains resulted in dramatic topographic relief in the region.
Mountain peaks rise to more than 10,000 ft (3,048 m) above sea level. The surface of Lake
Tahoe has an average elevation of about 6,225 ft (1,897 m).
Lake Tahoe is the second deepest lake in the United States and the tenth deepest in the
world, with a maximum depth measured at 1,645 ft (501 m), average depth of 1,000 ft (305 m).
The depth of Lake Tahoe changes every day as the lake level changes. The deepest measurement
from the 1998 bathymetric survey was 1,637 ft (499 m) deep.
Lake Tahoe is about 22 mi (35 km) long and l2 mi (19 km) wide and has 72 mi (116 km)
of shoreline and a surface area of 191 mi2 (495 km2). The floor of the Lake Tahoe Basin is at an
elevation of about 4,580 ft (1,396 m), which is lower than the surface of the Carson Valley to the
east! With an average surface elevation of 6,225 ft (1,897 m) above sea level, Lake Tahoe is the
highest lake of its size in the United States
The water temperature near the surface generally cools to 40 °F to 50 °F during February
and March and warms to 65 °F to 70 °F during August and September. Below a depth of 600 to
700 ft (183 to 213 m), the water temperature remains a constant 39 °F.
Lake Tahoe has a water clarity of about 70 ft (21 m) deep. The clarity has reduced from
greater than 100 ft (30.5m) since readings began in the late 1960's. The last published annual
average Secchi depth reading was 67.7 ft (20.6m) in 2006.
Lake Tahoe was occupied by the Washoe Tribe for many centuries. The Washoe Indians
were hunting and fishing in the area long before General John C. Fremont encountered it in 1844
during his exploration of the Far West. Since then, public appreciation of Lake Tahoe has grown.
Efforts were made during the 1912, 1913, and 1918 congressional sessions to designate the basin
as a national park but were unsuccessful.
Native Species
As part of the Sierra Nevada ecosystem, Lake Tahoe ecology is dominated by Sierra
mixed conifer species (Pseudotsuga mensiesii, Abies concolor, Pinus ponderosa, etc.). They can
be found here in addition to smaller, more landscaping-ready plants such as Sierra gooseberry,
rubber rabbitbrush, and pinemat manzanita.. Plants native to the area tolerate nutrient-poor soils,
harsh winters, and a short growing season. Their deep root systems also help to stabilize slopes
and soils. As part of the solution, planting native vegetation will be considered to reduce the
4. amount of runoff into Lake Tahoe. Using native species will decrease the chance of impacting
the environment further through the introduction of invasive pests and plants.
Climate
Lake Tahoe has what is known as snowy highland climate. The winters in the area tend to
be cold, especially during the nighttime and the summers can be hot but mostly stay moderate
especially when you average daytime and nighttime temperatures in Lake Tahoe weather. The
hottest month of the year is July while the coolest is January. Snowfall happens every month of
the year except for July and August. The hottest temperature in the area is 99 °F. During the
winter, the coldest temperature recorded is -29 °F. However, even in July, there have been
temperatures below freezing. The coldest July temperature ever recorded was 25 °F.
(laketahoeweather.net) Mean annual precipitation ranges from over 55 inches (1440 mm) for
watersheds on the west side of the basin to about 26 inches (660 mm) near the lake on the east
side of the basin. Most of the precipitation falls as snow between November and April, although
rainstorms combined with rapid snowmelt account for the largest floods.
Economic Issues
Much of Lake Tahoe’s economy revolves around recreation. One of agencies that helps
manage recreation is the Lake Tahoe Basin Management Unit (LTBMU). Visitors from around
the country and the world are attracted to Lake Tahoe to enjoy a variety of recreational activities.
The scenic quality of Lake Tahoe and its surrounding landscape make visiting the Lake Tahoe
Basin a one-of-a-kind experience. The LTBMU contributes to the Lake Tahoe Basin’s scenic
quality through the conservation and management of vegetation, waterways, infrastructure, and
recreation. Recreation opportunities supported by interpretation and conservation education
enrich the recreation experience and contribute to enhancing the public’s environmental literacy.
The Lake Tahoe Basin’s economy is driven largely by recreation and tourism. The LTBMU
plays an important role in providing outdoor recreation opportunities and preserving the scenic
quality of the Tahoe Basin’s lands and waterways.
Within the Lake Tahoe Region in 2006, the accommodation and food services industries
accounted for the greatest share of labor income, followed closely by government. The
unemployment rate for the LTR (Lake Tahoe Region) was lower than both California and
Nevada; however, it exceeded the unemployment rate for the Greater Lake Tahoe Area (GLTA),
which had the lowest unemployment rate of the four regions. The higher unemployment rates on
the south shore may be explained by the greater degree of employment being occupied by the
arts, entertainment and recreation industries, which are subject to the seasonal influx of visitors.
Employees in these industries often work seasonally.
Social Issues
Lake Tahoe remained exceptionally clear for decades. It was only with population increase
that clarity began to diminish. The watershed acted as its own water purification system, as
streams and creeks would slowly remove suspended particles from the water flowing into the
lake. When humans began to visit the area, these streams and creeks became disturbed, freeing
particles from creek beds and allowing them to flow into the lake. Traffic from highways and
roads has increased over the last 50 years, and lake water clarity has suffered because of it.
While the economy depends on tourism if it is to remain healthy, these tourists increase the
5. amount of people trafficking the area. A solution must be found that will limit or reduce the
amount of pollutant runoff into the lake while still allowing humans to enjoy the area.
Because the Lake Tahoe basin is populated by humans, social issues are interlinked with
environmental issues. How the human population manages itself directly affects the health of the
surrounding ecosystem, which is reflected in the clarity of the lake. There are about 22000
people who live in the city of South Lake Tahoe, though anthropogenic effects can be seen
around the entire lake perimeter.
Environmental Issues
For the past 100 years, the Lake Tahoe region has faced environmental degradation in
water clarity and the health of the surrounding forests. Water clarity is the primary measure of
the basin’s health, as it reflects water quality. It is estimated that in 10 years the lake will lose its
blue brilliance. Nonpoint source (NPS) pollution, such as sedimentation and nutrient runoff, is
contributing to the decline in Lake Tahoe's water clarity. Fine sediments become suspended and
decrease lake clarity, while nutrients such as phosphorus and nitrogen promote excess algal
growth that further decreases clarity. These disturbances are a result of human impacts including
clearcut logging, fire suppression, channelization of streams and rivers, and rapid urban
development. Forest harvest operations generate income for the area despite being a source of
pollution. The Forest Service has a Memorandum of Understanding with the Tahoe Regional
Planning Agency to facilitate cooperation, support and assistance towards reaching common
goals.
Objectives:
To maximize the reduction of pollutant runoff from both urban and nonurban area in Lake
Tahoe:
- Maximizing Reduction of Sediment Runoff
- Maximizing Reduction of Nitrogen Runoff
- Maximizing Reduction of Phosphorus Runoff
And possibly:
- Minimizing Cost
Reduction Methods
In order to reduce the amount of pollutant runoff into Lake Tahoe, two strategies can be
considered. The first strategy is the installation of filtration systems; these filtration systems will
be bioretention ponds. These ponds can be constructed on both urban and non-urban land.
Bioretention ponds reduce the amount of sediment in water by 90%, the amount of nitrogen by
49%, and the amount of phosphorus by 76% (National Pollutant Discharge Elimination System
2012). These percentages are the same for both urban and nonurban situations.
The second strategy is to revegetate urban and non-urban land, with different results in
each. Revegetation in urban areas will consist of planting seeds within private property, parks,
and other areas with exposed soil. In order to reduce cost, urban revegetation will not involve the
destruction of areas that are already paved or developed. The agency will purchase seeds in bulk
and allow property owners and private organizations to choose which species they desire. The
purchased seeds will only be native species so that invasive plants and pests do not become an
issue. Revegetation in non-urban areas will consist of planting native seedlings. Revegetation in
these non-urban areas will not be restricted to clearcut or deforested sites; every non-urban acre
6. is a candidate for revegetation, though areas with high tree densities will not receive as many
seedlings. By revegetating the land, erosion will be reduced and therefore pollutant runoff will
also be reduced.
Research Methods
Because there are multiple objective measures, goal programming is used to find the best
satisfying solution under priorities of the goals. Hence, each of the four measures (maximizing
reduction of sediment runoff, maximizing reduction of nitrogen runoff, maximizing reduction of
phosphorus runoff, and minimizing the cost) is given a goal or target value to be achieved. An
objective function will be formulated for each objective. A solution that minimizes the
(weighted) sum of deviations of these objective functions from their respective goals will be
found.
Decision Maker
The decision maker in this situation is the Tahoe Regional Planning Agency, an organization
dedicated to improving the environmental conditions of the Lake Tahoe basin.
Assumptions
1. When prioritizing a variable, its weight will be 1 and all other weights are 0. For example, if
prioritizing sediment, wS is equal is 1 while wN, wP, and wC are equal to 0.
2. The decline of the water quality is assumed to be only due to the sediment and nutrients runoff
from both urban and nonurban sources.
Data
Contribution to Goals
Many studies have been done that assess pollutant runoff into Lake Tahoe. One such
study examined how revegetation would affect sediment, nitrogen, and phosphorus runoff; both
urban and non-urban sites were investigated. The results of this study were used when
determining the contribution of revegetation improvements to the overall goals. For instance, it
was found that revegetation methods in the entire non-urban area reduced total sediment runoff
by 3.00 tons/year. This figure was found by extrapolating the average findings at a few non-
urban sites to the total non-urban area (Garcia 1988). For the purposes of this plan, it was then
converted to metric tons and divided by the total number of non-urban acres surrounding Lake
Tahoe (242400 acres). This resulted in the knowledge that revegetating non-urban areas would
reduce sediment runoff into Lake Tahoe by 1.1225x10⁻⁵
metric tons/acre/year. This is the
contribution that revegetation makes to the goal of sediment reduction in non-urban areas. This
same method was applied to find the contribution that revegetation makes to the goals of
sediment, nitrogen, and phosphorus runoff reduction in both urban and non-urban areas. Data
from Garcia’s study was converted into units of metric tons/acre/year. In the case of urban sites,
the figure was divided by the total number of urban acres surrounding Lake Tahoe (80800 acres
instead of 242400 acres). Also, the study measured nitrogen and phosphorus levels in units of
pounds/year instead of tons/year. Pounds were converted into metric tons for this plan. For
instance,
Revegetating urban areas:
Sediment reduction = (230 tons/year * 0.907 metric tons/ton)/80800 acres
=0.002582 metric tons/acre/year
7. Nitrogen reduction = (47 lbs/year * 0.000453 metric tons/lb)/80800 acres
=2.635x10⁻⁷
metric tons/acre/year
Phosphorus reduction = (2.8 lbs/year * 0.00453 metric tons/lb)/80800 acres
=1.569x10⁻⁸
metric tons/acre/year
The same operations were performed for non-urban areas.
In order to determine the contribution that bioretention ponds (the filtration method) make to
the reduction of sediment and nutrient runoff, information was found on retention ponds.
According to an EPA resource, retention ponds remove about 90% of sediment, 49% of nitrogen,
and 76% of phosphorus from water flowing through them (National Pollutant Discharge
Elimination System 2012). In regards to the Lake Tahoe region, other studies have analysed the
total amount of sediment, nitrogen, and phosphorus runoff into the lake from both urban and
non-urban sites. The values from these studies were converted into metric tons/acre/year and
multiplied by the appropriate percentage. This yielded the amount of pollutant reduction that
filtration methods contribute to the goals. For instance, it was found that 5200 metric tons/year of
sediment runoff into Lake Tahoe came from urban sources (USDA 2010). This number was
multiplied by 90% to determine the effect of filtration on the reduction of sediment runoff; the
result was then divided by 80800 acres to account for the total number of urban acres in the
region. Based on this method, it was found that filtration in urban areas would reduce sediment
runoff by 0.05792 metric tons/acre/year. This is the contribution of filtration to the reduction of
sediment runoff in urban areas. Following this strategy,
Filtering non-urban areas:
Sediment reduction = (11700 metric tons/year * 90%)/242400 acres
= 0.04344 metric tons/acre/year
Nitrogen reduction = (240 lbs/year * 0.000453 metric tons/lb * 49%)/242400 acres
= 2.1977x10⁻⁷
metric tons/acre/year
Phosphorus reduction = (8.1 lbs/year * 0.000453 metric tons/lb *76%)/242400 acres
= 1.1504x10⁻⁸
metric tons/acre/year
The same operations were performed for urban areas. Nitrogen and phosphorus values were
found from Garcia’s 1988 report, while sediment levels were obtained from the USDA’s report.
Target Values: Pollutant Reduction
Pollutant levels in recent years have exceeded levels from the past. This increase in pollutant
concentration has decreased water clarity. In order to increase water clarity back to a
historical standard, current runoff levels must be reduced. These target amounts of runoff must
then be maintained if the lake is to remain clear for years to come.
As of today:
The total sediment runoff into Lake Tahoe per year is 16900 metric tons/year (USDA 2010).
The total nitrogen runoff into Lake Tahoe per year is 125 metric tons/year (State Water
Resources Control Board 2011).
The total phosphorus runoff into Lake Tahoe per year is 30 metric tons/year (State Water
Resources Control Board 2011).
The total current sediment runoff should be reduced by at least 45% in order to control the rate of
increase of total sediment runoff to the lake. This percentage figure was found in a study done by
the EPA that examined historical water clarity and pollutant runoff (State Water Resources
Control Board 2011). In order to find the target level of sediment reduction, the current level of
8. runoff was multiplied by the desired percentage reduction (16900 metric tons/year * 45%). This
is the minimum amount of sediment reduction required to meet the goal of long-term pollutant
reduction. For instance,
Total sediment runoff reduction >= 16900 metric tons/year * 45%
>= 7605 metric tons/year
The total nitrogen runoff should be reduced by at least 25% of the total (State Water
Resources Control Board 2011).
Total nitrogen runoff reduction >= 125 * 25%
>= 31.23 metric tons/year
The total phosphorus runoff should be reduced by at least 45% of the total (State Water
Resources Control Board 2011).
Total phosphorus runoff reduction >= 30 * 24.5%
>= 7.35 metric tons/year
Target Values: Cost
The target value of cost was found by determining the amount of funding available for the
project. Sources of funding include public, private, state, and federal agencies. The total amount
of funding available for the first year is the sum of all one-time contributions ($116,050,000) and
the first year of annual contributions ($33,325,000). The result is the budget for the installation
of improvements, $149,375,000 (Environmental Improvement Plan 2001). Thus, the total
combined cost of retention ponds and revegetation must not exceed $149,375,000.
Decision variables:
X1= acres of urban area where filtration will be applied
X2= acres of urban area where revegetation will be applied
X3= acres of non-urban area where filtration will be applied
X4= acres of non-urban area where revegetation will be applied
Goal of Variables:
S-
= shortage of reduction in sediment runoff in metric tons
S+
= surplus of reduction in sediment runoff in metric tons
N-
= shortage of reduction in nitrogen runoff in metric tons
N+
= surplus of reduction in nitrogen runoff in metric tons
P-
= shortage reduction in phosphorus runoff in metric tons
P+
= surplus reduction in phosphorus runoff in metric tons
C-
= shortage of cost
C+
= surplus of cost
wS
-
........wC
+
= are constant weights, to make all weighted deviations commensurate and to express
the relative importance of each goal.
Objective function:
Minimize total deviation from all goals Z
Min Z = wS
-
S-
+ wS
+
S+
+ wN
-
N-
+ wN
+
N+
+ wP
-
P-
+wP
+
P+
+ wC
-
C-
+ wC
+
C+
Since the project concerns about underachieving the sediment reduction, nitrogen reduction and
phosphorus reduction goals but not about exceeding them, so S-
, N-
and P-
only need to be in our
9. objective function. At the same time, the cost should be kept low. Therefore, C+
, but not C-
,
should be in our objective function.
In summary, the relevant expression of the objective function for this project is:
Min Z = wS
-
S-
+ wN
-
N-
+ wP
-
P-
+ wC
+
C+
Constraints:
1. Sediment Runoff Reduction (metric tons/ yr):
0.057920792X1+ 0.002581807X2+ 0.043440594X3+ 1.12252E-05X4+ S-
- S+
= 7605
2. Nitrogen Runoff Reduction (metric tons/ yr):
7.96675E-08X1+ 2.63502E-07X2+ 2.19772E-07X3+ -7.66213E-0705X4+ N-
- N+
= 31.23
3. Phosphorus Runoff Reduction (metric tons/ yr):
3.06784E-08X1+ 1.5698E-08X2+ 1.15044E-08X3+ 1.17548E-07X4+ P-
- P+
= 7.35
4. Cost ($/ yr):
2400X1+ 100X2+ 240X3+ 75X4+ C-
- C+
= 149375000
Results
Four solutions were found that each seek to achieve different goals.
1. Maximizing reduction of sediment runoff
To prioritize sediment runoff reduction, the shortage weight of sediment runoff reduction, S-
, is
set to be 1, while the rest of the weights is set to be 0.
For urban land, 45471.63117 acres of the available urban land would be applied filtration, while
35328.36883 acres would be revegetated.
For nonurban land, 112304.5352 acres would be applied filtration, while 130095.4648 acres
would be revegetated.
The weighted sum of surplus and shortage totals, Z, would be minimized to 0.
Sediment runoff reduction:
The goal of having 7605 metric tons of sediment runoff reduced each year would be met with no
shortage.
Nitrogen runoff reduction:
The nitrogen reduction goal would not be met. Only 0.137293965 metric tons of nitrogen runoff
would be reduced each year, which would give a shortage of 31.09270604 metric tons/ year.
Phosphorus runoff reduction:
The phosphorus reduction goal would not be met. Only 0.018534076 metric tons of phosphorus
runoff would be reduced each year with a shortage of 7.331465924 metric tons/ year.
Cost:
The cost would be $149375000, which is the same as the target.
2. Maximizing reduction of nitrogen runoff
To prioritize nitrogen runoff reduction, the shortage weight of nitrogen runoff reduction, N-
, is
set to be 1, while the rest of the weights is set to be 0.
For urban land, 53528.26087 acres would be applied filtration, while 27271.73913 acres would
be revegetated.
10. For nonurban land, the whole available area would be revegetated.
The total weighted surplus would be 0, while the total weighted shortage would be 31.03281937.
The sum of surplus and shortage totals would be 31.03281937. The weighted sum of surplus and
shortage totals, Z, would be 31.03281937.
Nitrogen runoff reduction:
The goal of having 31.23 metric tons of nitrogen reduced each year would not be met. Only
0.197180631 tons of nitrogen would be reduced each year with a shortage of 31.03281937 tons
per year.
Sediment runoff reduction:
The sediment runoff reduction goal would not be met. Only 3173.530633 metric tons of
sediment runoff would be reduced each year with a shortage of 4431.469367 metric tons/ year. .
Phosphorus runoff reduction:
The phosphorus reduction goal would not be met. Only 0.018534076 metric tons of phosphorus
runoff would be reduced each year with a shortage of 7.331465924 metric tons/ year.
Cost:
The cost would be $149375000, which is the same as the target.
3. Maximizing reduction of phosphorus runoff
To prioritize phosphorus runoff reduction, the shortage weight of phosphorus runoff reduction, P-
, is set to be 1, while the rest of the weights is set to be 0.
For urban land, 53528.26087 acres would be applied filtration, while 27271.73913 acres would
be revegetated.
For nonurban land, the whole available area would be revegetated.
The total weighted surplus would be 0, while the total weighted shortage would be 7.32. The
sum of surplus and shortage totals, Z, would be 7.32.
Phosphorus runoff reduction:
The goal of having 7.35 metric tons of nitrogen reduced each year would not be met. Only
0.030563975 metric tons of phosphorus runoff would be reduced each year with a shortage of
7.319436025 metric tons/ year.
Sediment runoff reduction:
The sediment runoff reduction goal would not be met. Only 3173.530633 metric tons of
sediment runoff would be reduced each year with a shortage of 4431.469367 metric tons/ year.
Nitrogen runoff reduction:
The goal of having 31.23 metric tons of nitrogen reduced each year would not be met. Only
0.197180631 metric tons of nitrogen would be reduced each year with a shortage of 31.03281937
metric tons per year.
Cost:
The cost would be $149375000, which is the same as the target.
4. Minimizing Cost
To prioritize minimizing the cost, the surplus weight of cost, C+
, is set to be 1, while the rest of
the weights is set to be 0.
11. For urban land, 53528.26087 acres would be applied filtration, while 27271.73913 acres would
be revegetated.
For nonurban land, the whole available area would be revegetated.
The total weighted surplus would be 0, while the total weighted shortage would be 0. The sum of
surplus and shortage totals, Z, would be 0.
Cost:
The cost would be 149375000, which is the same as the target.
Phosphorus runoff reduction:
The phosphorus reduction goal would not be met. Only 0.030563975 metric tons of phosphorus
runoff would be reduced each year with a shortage of 7.319436025 metric tons/ year.
Sediment runoff reduction:
The sediment runoff reduction goal would not be met. Only 3173.530633 metric tons of
sediment runoff would be reduced each year with a shortage of 4431.469367 metric tons/ year.
Nitrogen runoff reduction:
The goal of having 31.23 metric tons of nitrogen reduced each year would not be met. Only
0.197180631 metric tons of nitrogen would be reduced each year with a shortage of 31.03281937
metric tons per year.
Business Plan
Executive Summary
This document summarizes the intended plan for the Lake Tahoe basin. The Lake Tahoe basin
consists of 323200 acres, 80800 of which are considered urban and 242400 of which are
considered non-urban. The area acts as a filtration system for the water that enters Lake Tahoe.
Funding for this project will come from public, private, state, and federal agencies. While
much of this funding is issued at one time, a portion of it is generated on an annual basis. The
funds will be used to implement filtration and revegetation methods that will increase lake water
clarity.
Projects will be constructed by local crews that are contracted. Payment of these crews is
included in the cost of the projects. Future efforts to monitor and maintain the sites will be
undertaken by UC Davis students, as the university already has an established monitoring
program of the lake. They will be provided a portion of the overall funds for equipment and
labor.
After the first year, in which improvements are constructed, there will be no remaining funds.
Every year after that year will see at least $33,273,400 in remaining funds. At the end of five
years, a total of $166,483,000 will be remaining in funds.
Introduction
This is a business plan to estimate the costs and benefits of implementing water clarity
projects in the Lake Tahoe basin, which is located on the border of California and Nevada. The
goal of the plan is to ensure that the costs can be met with the available funds. The water clarity
improvements will consist of bioretention ponds and the revegetation of the land. These
strategies will reduce the amount of sediment, nitrogen, and phosphorus runoff into Lake Tahoe.
12. With the increase in water clarity, the region will be able to maintain its high rate of tourism, the
main sector of its economy.
Funding will come from private, public, state, and federal resources and can be a one-
time or annual contribution. The states of California and Nevada both have a Tahoe License
Plate Program, and these programs generate funds on an annual basis. Likewise, certain tax
initiatives have been set up in both states to help fund the Environmental Improvement Program
(EIP). Contributions that will occur only once are programs such as research grants and private
foundations.
The Lake Tahoe basin is high elevation (about 6200 ft), and therefore is generally cold.
Snow can be expected to occur in every month except July and August, while temperatures in
these months can reach as high as 99୦F. Temperature fluctuations do not affect the amount of
pollutant runoff into the lake, and both strategies of pollutant reduction will be effective
throughout the year.
Market/Interest Groups/Stakeholders
With the Lake Tahoe basin being such a popular destination for recreational activities, it
is not surprising to hear that there are various stakeholders interested in the well-being of the
area. Starting with the businesses in the area, there are those involved in recreational activities
such as kayaking, boating, skiing, and snowboarding. To accommodate the tourists, various
hotels and rental cabins fill the area. Recognizing the added pressures that increasing tourism can
have on the environment, concerned residents have taken to starting organizations dedicated to
taking care of the area’s environment. One such organization is Keep Tahoe Blue, whose focus is
to maintain the clarity of the lake. In addition, both state and local governments are also
interested in the lake. The Tahoe License Plate program is run by both the California government
and the Nevada program; it is designed to raise funds to support environmental projects in the
Tahoe region. Local governments respond to the desires of residents and propose tax initiatives
and fees as possible funding sources for environmental projects. To support these projects is the
University of California, Davis that conducts research on the lake and collects data on its
condition.
Products and Services
Services gained by this plan are water filtration through the use of revegetation and
bioretention ponds. These methods will enhance the basin’s ability to filter the water that enters
Lake Tahoe, thereby improving water clarity. Water clarity is an important aspect of tourism, as
tourists often use the lake directly or indirectly (boating, kayaking, and enjoying views while
skiing).
Marketing and Sales Strategy
The biggest attraction to the Lake Tahoe basin is the beauty of the lake and its surroundings.
Improving the lake’s water clarity will attract more tourists to the area, increasing profits for
businesses and helping to keep residents employed. As such, it is important to emphasize this
point to encourage constant support from businesses, residents, and the different levels of
government to maintain investments in projects that improve Lake Tahoe’s water clarity. Thus,
our marketing and sales strategy would focus on how improving the lake’s water clarity will
ultimately benefit every individual and organization that resides in the area.
13. Organization and Management
The Tahoe Regional Planning Agency (TRPA) is the main decision maker for this project. The
organization did not officially exist until the 1960s when Congress ratified the agreement
between the California and Nevada governments to establish an agency to look after the Tahoe
area. TRPA became the first bi-state regional environmental planning agency in the country. The
agency’s goals follow the Tahoe Regional Planning Compact that delineates that a balance
should be obtained between the quality of the natural environment and the human-made
environment. The Compact also gives TRPA and its governing board the authority to adopt
environmental quality standards and to enforce ordinances to maintain these standards. TRPA
continues to work with various groups to restore and enhance Lake Tahoe.
Financial Analysis
1. Quarterly Financial Projections for Two Years
All four solutions required the same amount of money for implementation and future
monitoring costs. At the end of two years, all four plans have identical amounts of funds
remaining.
Maximizing Sediment Reduction
16. Minimizing Cost
2. Annual Projections to Five Years with Cash Flow and Budget Analysis
All four solutions required the same amount of money for implementation and future
monitoring costs. At the end of five years, all four plans have identical amounts of funds
remaining.
18. Maximizing Phosphorus Reduction
Minimizing Cost
3. Capital Requirements and Funding
In order to achieve the plan’s objective, a budget of $149,375,000 was determined for the
first year. This funding will pay for the construction and establishment of bioretention ponds and
revegetation. The costs for each of these strategies have been factored into the optimization plan,
and the costs consist mostly of labor and plant prices. Depending on whether the site is urban or
non-urban, the cost is different. Both strategies are less expensive if undertaken on non-urban
land.
19. In the first year after the projects have been established, monitoring efforts will be made.
Two researchers from UC Davis, which already has a group studying Lake Tahoe’s water clarity,
will be paid to monitor the water for five days of every month. They will each be paid $20/hour.
Additionally, this plan accounts for the purchase of five monitors of each type of pollutant: five
sediment monitors, five nitrogen monitors, and five phosphorus monitors. The plan also factors
in the cost of a research boat, its trailer, fuel, and maintenance costs. Every year after the first
year of monitoring, the same amount of money will be spent on employing the researchers,
maintaining the boat, and paying for fuel. The planned budget allows for the purchase of one of
every monitor every year.
Funding that remains after every year will be saved for future projects. Stochastic events
such as storms or fires may require the re-establishment of either filtering systems or
revegetation. The extra funding will help pay for these unforeseen circumstances.
Funding for the project is from the Environmental Improvement Program; the EIP has
approximately $2 billion set aside for projects to improve Lake Tahoe environment. This funding
comes from public, private, state, and federal sources in the form of tax initiatives and donations.
In the instance of tax initiatives, funding is generated on an annual basis. In the case of
donations, the sums are contributed only once (in year zero). These are the programs and
initiatives that are directly related to this plan and will support the clarity improvement efforts.
Costs One-Time Annual
Sediment Monitor 4000 800
Nitrogen Monitor 2500 500
Phosphorus Monitor 1500 300
Boat Cost 18000 1800
Trailer 1000
Fuel 2000
Annual Research Labor 19200
Total Costs 29000 22600
20.
21. Discussion
Each solution generated from goal programming prioritized one target over the other three.
Looking at the results, it is clear that the best option is the solution that prioritized the reduction
in sediment runoff. This solution was able to meet two of the four targets: cost and sediment
reduction. The achieved levels of nitrogen and phosphorus reduction were also fairly close to the
target levels. The objective function was also minimized to zero. As such, bioretention ponds
should be constructed on approximately 45,000 acres of urban land and on approximately
112,000 acres of non-urban land; revegetation will take place on approximately 35,000 acres of
urban land and on approximately 130,000 acres of non-urban land.
22. References
California Regional Water Quality Control Board. "Approval of Amendments to the Water
Quality Control Plan for the Lahontan Region to Incorporate a Total Maximum Daily Load and
TMDL Implementation Plan for Fine Sediment Particles, Total Nitrogen, and Total Phosphorus
for Lake Tahoe." CA Lake Tahoe TMDL Board Docs. United States Environmental Protection
Agency, 16 Nov. 2010. Web. 12 May 2013. <http://www.epa.gov/waters/tmdldocs/CA-
LAKETAHOETMDL-BOARDDOCS.pdf>.
California Tahoe Conservancy. "Environmental Improvement Program." California Tahoe
Conservancy Environmental Improvement Program. CA.GOV, n.d. Web. 12 May 2013.
<http://tahoe.ca.gov/environmental-improvement-program.aspx>.
California Water Boards, Nevada Division of Environmental Protection. "Pollutant Reduction
Opportunities." Pollutant Reduction Opportunities. NDEP, 2008. Web.
<http://ndep.nv.gov/bwqp/file/pollutant_reduction_opportunities08p.pdf>.
EIP Division. "The Cooperative Effort to Preserve, Restore, and Enhance the Unique Natural and
Human Environment of the Lake Tahoe Region." Environmental Improvement Program. Tahoe
Regional Planning Agency, 25 Apr. 2001. Web. 12 May 2013.
<http://www.trpa.org/documents/docdwnlds/EIP/volume3.pdf>.
Garcia, Kerry T. 1988. Effect of erosion-control structures on sediment and nutrient transport,
Edgewood Creek drainage, Lake Tahoe Basin, Nevada, 1981-83. US Geological Survey.
Hymanson, Zachary P. "An Integrated Science Plan for the Lake Tahoe Basin: Conceptual
Framework and Research Strategies." An Integrated Science Plan for the Lake Tahoe Basin:
Conceptual Framework and Research Strategies. United States Department of Agriculture,
Forest Service, Pacific Southwest Research Station, May 2010. Web. 12 May 2013.
<http://www.fs.fed.us/psw/publications/documents/psw_gtr226/psw_gtr226.pdf>.
Nevada Tahoe Resource Team. "Nevada Division of State Lands - Nevada Tahoe Resource
Team." Nevada Division of State Lands - Nevada Tahoe Resource Team. Nevade Division of
State Lands, Oct.-Nov. 2012. Web. 12 May 2013. <http://lands.nv.gov/program/tahoe.htm>.
Office of Water Programs, California State University, Sacramento. "Bioretention." TC-32
Bioretention. California Stormwater Quality Association Alifornia Stormwater BMP Handbook,
Jan. 2003. Web. 12 May 2013.
<http://www.cabmphandbooks.com/Documents/Development/TC-32.pdf>.
Placer County News. "Permit To Reduce Tahoe Pollution Approved By Supervisors." Permit To
Reduce Tahoe Pollution Approved By Supervisors. Placer County News, 27 Feb. 2013. Web. 12
May 2013. <http://www.placer.ca.gov/News/2013/February/Tahoe.aspx>.
Scott H. Hackley, Brant C. Allen, Debbie A. Hunter, John E. Reute. "Lake Tahoe Water Quality
Investigations." Task 3 - Algal Growth Bioassays - 2011. Tahoe Environmental Research Center
23. University of California, Davis, 1 Dec. 2011. Web.
<http://terc.ucdavis.edu/publications/2011_LakeTahoeWaterQualityInvestigations.pdf>.
Smith, Douglas F. "Lake Tahoe: Nitrogen, Phosphorus and Particulates." PowerPoint
Presentation - Doug_smith. Lahontan Water Board, 9 Feb. 2006. Web.
<http://www.swrcb.ca.gov/water_issues/hot_topics/atmospheric/presentations/doug_smith.pdf>
State Water Resources Control Board. "The Lake Tahoe Maximum Daily Load." Lake Tahoe
TMDL Program Cac_208_09_final. State Water Resources Control Board, Nov. 2010. Web. 12
May 2013.
<http://www.waterboards.ca.gov/lahontan/water_issues/programs/tmdl/lake_tahoe/docs/cac_208
_09_final.pdf>.
Stover Seed Company. "Species List." Request List. Stover Seed Company, n.d. Web. 12 May
2013. <http://www.stoverseed.com/websearch/specieslist.cfm>.
Stubblefield, A.P., J.E. Reuter and C.R. Goldman. 2009. Sediment budget for subalpine
watershed, Lake Tahoe, California, USA. Catena 76: 163-172.
Tahoe Regional Planning Agency. "Tahoe in Depth." Tahoe Regional Planning Agency. N.p.,
2001. Web. 12 May 2013. <http://www.trpa.org/default.aspx?tabid=227>.
Tahoe Regional Planning Agency. "THE LATEST CLARITY MEASUREMENT." Tahoe
Regional Planning Agency. Tahoe Regional Planning Agency, 2011. Web. 12 May 2013.
<http://www.trpa.org/default.aspx?tabindex=2>.
Tahoe Science Consortium. "General Technique Report." An Integrated Science Plan for the
Lake Tahoe Basin: Conceptual Framework and Research Strategies - Science-Plan-Chapter-4.21.
Tahoe Science Consortium, Oct. 2011. Web. 10 Apr. 2013. <http://tahoescience.org/wp-
content/uploads/2011/10/Science-Plan-Chapter-4.21.pdf>.
United State Department of Agriculture Forest Service. "Lake Tahoe Basin Mgt Unit -
Planning." Lake Tahoe Basin Mgt Unit - Planning. USDA, June 2012. Web. 12 May 2013.
<http://www.fs.usda.gov/main/ltbmu/landmanagement/planning>.
United State Environmental Protection Agency. "EPA - Stormwater Menu of BMPs." EPA -
Stormwater Menu of BMPs. Web. 12 May 2013.
<http://cfpub.epa.gov/npdes/stormwater/menuofbmps/index.cfm?action=factsheet_results>.
USGS. "Facts About Lake Tahoe." Facts about Lake Tahoe. USGS, 13 Dec. 2012. Web. 12 May
2013. <http://tahoe.usgs.gov/facts.html>.
Vitousek, Peter M.; Melillo, Jerry M. "Nitrate Losses From Disturbed Forests: Patterns and
Mechanisms." Latest TOC RSS. Society of American Foresters, 1 Dec. 1979. Web. 12 May 2013.
<http://www.ingentaconnect.com/content/saf/fs/1979/00000025/00000004/art00016>.
24. Western Regional Climate Center. "TAHOE, CALIFORNIA." - Climate Summary. Western
Regional Climate Center, 31 Mar. 2013. Web. 12 May 2013. <http://www.wrcc.dri.edu/cgi-
bin/cliMAIN.pl?ca8758>.