Contenu connexe Similaire à European sc development report november 2013 Similaire à European sc development report november 2013 (20) 1. MARKETBEAT
SHOPPING CENTRE
DEVELOPMENT REPORT
EUROPE
NOVEMBER 2013
A Cushman & Wakefield Research Publication
OVERVIEW
Approximately 1.8 million sq.m of new
shopping centre GLA were delivered onto
the market in the first half of 2013. Central
and Eastern European countries again
accounted for the majority of this total, with
their share (70%) increasing when compared with the previous six
months. The final figure of new shopping centre space completed
was, however, significantly short of the total previously forecast,
with a number of projects delayed to H2 2013 and 2014. Projected
space to be completed in H2 2013 and 2014 now stands at 4.9
million and 6.1 million respectively, with 69% of all new supply in
the pipeline expected to be delivered in Central and Eastern
Europe (including Turkey). However, the situation remains fluid
and pipeline figures may be subject to further revisions.
MARKET SIZE
The estimated total shopping centre floorspace stands at
approximately 150 million sq.m of GLA as of the 1st of July 2013.
France remains the largest market by shopping centre space,
breaking the 17.0 million sq.m barrier in H1 2013, followed closely
by the UK which has a total of 16.8 million of GLA.
Russia is still the third largest market, albeit the total figure was
revised down to 16.0 million to take into account only quality space
which would be comparable to other European markets. Despite
the revision, Russia is still expected to overtake the UK as the
second largest market, with over 3.2 million sq.m under
construction and due to be completed by the end of 2014. This
represents just over 29% of the entire European pipeline, but as
always there remains a level of uncertainty over the completion
dates of many of these schemes.
Turkey is second in terms of shopping centre space in the pipeline
for H2 2013/2014. Over 1.5 million sq.m of GLA are scheduled to
be completed, with nearly a third set to be delivered in Istanbul.
Assuming all projects are completed on schedule, this would
represent an 18% increase in shopping centre space.
Strong growth is also anticipated in a range of other markets, with
the Ukraine, Russia, Bulgaria, Finland, Croatia and Slovakia all
expected to see double-digit rises in shopping centre GLA. Similarly
to their Russian neighbours, the Ukraine is expected to see a
significant increase (42%) when compared to existing space over
the coming 18 months, although its pipeline is also subject to
changes due to the uncertainty surrounding the eventual
completion of some schemes.
France and Italy are the top Western European markets in terms of
space in the pipeline, with 798,700 sq.m and 757,350 sq.m
respectively scheduled for completion, but with most of this total
expected to come onto the market next year.
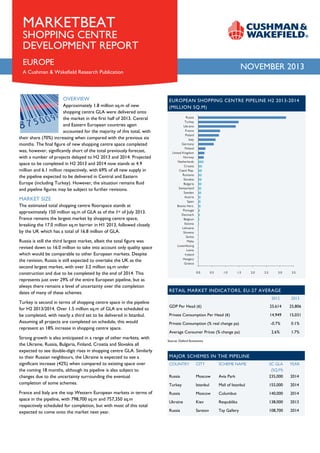
EUROPEAN SHOPPING CENTRE PIPELINE H2 2013-2014
(MILLION SQ.M)
Russia
Turkey
Ukraine
France
Poland
Italy
Germany
Finland
United Kingdom
Norway
Netherlands
Croatia
Czech Rep.
Romania
Slovakia
Bulgaria
Switzerland
Sweden
Austria
Spain
Bosnia Herz.
Portugal
Denmark
Belgium
Estonia
Lithuania
Slovenia
Serbia
Malta
Luxembourg
Latvia
Ireland
Hungary
Greece
0.0
0.5
1.0
1.5
2.0
2.5
3.0
3.5
RETAIL MARKET INDICATORS, EU-27 AVERAGE
2012
2013
GDP Per Head (€)
25,614
25,806
Private Consumption Per Head (€)
14,949
15,031
Private Consumption (% real change pa)
-0.7%
0.1%
Average Consumer Prices (% change pa)
2.6%
1.7%
YEAR
Source: Oxford Economics
MAJOR SCHEMES IN THE PIPELINE
COUNTRY
CITY
SCHEME NAME
Russia
Moscow
Avia Park
SC GLA
(SQ.M)
235,000
Turkey
Istanbul
Mall of Istanbul
155,000
2014
Russia
Moscow
Columbus
140,000
2014
Ukraine
Kiev
Respublika
138,000
2013
Russia
Saratov
Tay Gallery
108,700
2014
2014
2. OVERVIEW OF DEVELOPMENT IN H1 2013
The first half of 2013 saw approximately 1.8 million sq.m of new
space added to the market, significantly below the 3.4 million
completed in the previous six-month period. Russia yet again led
the way with approximately 456,200 sq.m of shopping centre space
delivered, which accounted for 25% of all space across Europe.
Turkey followed in second place as 422,500 sq.m of GLA were
added in the first six months of 2013, with the largest opening
Vialand Theme Park which included 110,000 sq.m of shopping
centre GLA. The UK was in third sport with 182,600 sq.m,
meanwhile, Poland and Germany were fourth and fifth respectively,
together delivering 214,200 sq.m of GLA.
There were 56 schemes opened across Europe, with 24 opened in
Western Europe and 32 in Central and Eastern Europe. In addition,
27 extensions were also completed; the majority built in Western
Europe (16) and the rest in Central and Eastern Europe (11). On
the 1st of July 2013, total shopping centre GLA across Europe
stood at 150 million sq.m, with the average provision per 1,000
inhabitants in the 27 EU member states (excluding Cyprus) at 261.6
sq.m.
Completion rates slowed across the region, but with development
activity in Western Europe still subdued. Vialand Theme Park was
the scheme which added the most shopping centre space (110,000
sq.m) to the market in H1 2013, followed by Aquarelle (92,100
sq.m) in the industrial city of Volgograd, Russia, and Trinity Leeds
(79.500 sq.m) in third.
KEY TRENDS ACROSS EUROPE
Of the 456,200 sq.m completed in Russia in the first half of the
year, approximately 81% were from new schemes. Indeed, during
this period nine new shopping centres were added onto the
market, while a further 88,420 sq.m was delivered through two
extensions. A similar trend was also evident in Turkey, where eight
new schemes and just two extensions were completed. Combined
with the Russian total GLA, the two countries accounted for nearly
half of all European shopping centre space opened in H1 2013.
Development in the UK picked up in H1 2013 when compared
with the record low total recorded in 2012, when almost 37,000
sq.m were delivered – the lowest figure in over 52 years.
Development activity consisted of seven new schemes and four
small extensions of existing shopping centres.
Supply in Poland was increased by approximately 126,100 sq.m,
nearly 10% of the European total, consisting of seven new schemes
and one extension. Galeria Solna (30,000 sq.m) and Europa
Centralna (27,000 sq.m) were the two largest schemes built in the
country during this period, located in Inowrocław and Gliwice
respectively.
Although the share of extension space as a percentage of all space
delivered was relatively similar for Western Europe and Central
and Eastern Europe, this is expected to change going forward.
Indeed, the development pipeline in Western markets is expected
to be increasingly composed of several extensions. This will be in
contrast to elsewhere in Europe where new projects will take
precedence over improvement to existing schemes.
For further information, please contact
our Research Department:
Cushman & Wakefield LLP
43-45 Portman Square
London W1A 3BG
www.cushmanwakefield.com
SHOPPING CENTRE GLA (SQ.M) PER 1,000 POPULATION
Norway
Luxembourg
Estonia
Sweden
Slovenia
Ireland
Finland
Netherlands
Switzerland
Austria
Denmark
Latvia
Lithuania
Portugal
Croatia
United Kingdom
EU-27 Average
France
Spain
Poland
Slovakia
Italy
Czech Rep.
Malta
Germany
Hungary
Romania
Russia
Belgium
Turkey
Bulgaria
Ukraine
Bosnia Herz.
Greece
Serbia
0
100
200
300
400
500
600
700
NEW SHOPPING CENTRE GLA H1 2013 (MILLION SQ.M)
Russia
Turkey
United Kingdom
Poland
Germany
Ukraine
France
Netherlands
Czech Rep.
Serbia
Sweden
Bulgaria
Switzerland
Spain
Austria
Croatia
Hungary
Italy
Romania
Luxembourg
Estonia
Latvia
Portugal
Slovenia
Slovakia
Norway
Malta
Lithuania
Ireland
Greece
Finland
Denmark
Bosnia Herz.
Belgium
0.0
0.1
0.2
This report has been produced by Cushman & Wakefield LLP for use by those with an interest in commercial property solely
for information purposes. It is not intended to be a complete description of the markets or developments to which it refers.
The report uses information obtained from public sources which Cushman & Wakefield LLP believe to be reliable, but we have
not verified such information and cannot guarantee that it is accurate and complete. No warranty or representation, express
or implied, is made as to the accuracy or completeness of any of the information contained herein and Cushman & Wakefield
LLP shall not be liable to any reader of this report or any third party in any way whatsoever. All expressions of opinion are
subject to change. Our prior written consent is required before this report can be reproduced in whole or in part. Should you
not wish to receive information from Cushman & Wakefield LLP or any related company, please email
unsubscribe@eur.cushwake.com with your details in the body of your email as they appear on this communication and head it
“Unsubscribe”. ©2013 Cushman & Wakefield LLP All rights reserved.
0.3
0.4
0.5
3. EUROPEAN SHOPPING CENTRE GROWTH
The European shopping centre pipeline for H2 2013 now stands at
over 4.9 million sq.m of GLA. A total of 145 new shopping centres
are scheduled for completion across Europe, 105 of them in
Central and Eastern Europe. There are also 79 extensions in the
2013 pipeline, 58 in Western Europe. Looking forward to 2014,
there are already 171 new schemes and 65 extensions due to be
delivered across the continent, with the pipeline volume estimated
at 6.2 million sq.m of GLA.
Shopping centre growth in Finland is expected to be the strongest
among Western European countries. Despite no space being added
in the first sixth months, total floorspace in the country is expected
to be enlarged by 13.7% by the end of 2014, consisting of mostly
extensions in H2 2013 and new schemes in 2014.
Elsewhere, although development activity in Norway was extremely
subdued in H1 2013, with no space added, it is anticipated to
improve considerably going forward, particularly in the second half
of 2013. The country is the most saturated European market in
terms of sq.m per 1,000 inhabitants (632), nevertheless space set to
be completed in H2 2013 and 2014 is expected to increase total
shopping centre floorspace by a further 6.4%.
RETAIL INVESTMENT
Total retail trading volumes in the investment market in H1 2013
amounted to approximately €16.5 billion, down €5 billion on the
previous six months, but an improvement on the €12 billion
recorded in H1 2012. Retail investment accounted for 24% of all
commercial real estate transactions concluded in H1 2013, a
decline of 4 percentage points compared with H2 2012.
The bulk of the activity was yet again concentrated in the UK and
Germany, which together accounted for over 55% of all European
transactions. Investment activity in the UK slowed marginally when
compared with H2 2012, with €5.3 billion worth of retail assets
traded. Meanwhile, in Germany the investment slowdown was
more marked, but this was partly due to a shortage of good quality
assets available. Trading volumes in Germany amounted to €3.9
billion in H1 2013, a fall of €1.3 billion from the previous six
months.
France was the third largest market by trading volumes with just
under €1.7 billion worth of retail assets traded H1 2013. However,
investment activity in the country slowed on the previous six
months, when €2.5 billion worth of transactions were concluded.
Although the deceleration in H1 2013 investment activity was
largely evident across Europe, with the typically dynamic Northern
markets also affected, one sub-region which saw an increase in
retail volumes was Eastern Europe. Indeed, there was an additional
€1 billion worth of retail assets traded in H1 2013 when compared
with the previous six-month period.
Activity has, however, started to respond to the better news
coming out of the euro zone and the relatively improved finance
and investment conditions. Additionally, investors are adapting to
the greater certainty and a lack of well-priced opportunities in their
preferred market by adjusting their risk tolerance. Consequently,
investment activity is expected to improve further in H2 2013 and
to broaden to other areas, including previously overlooked
Southern European markets.
For further information, please contact
our Research Department:
Cushman & Wakefield LLP
43-45 Portman Square
London W1A 3BG
www.cushmanwakefield.com
EUROPEAN SHOPPING CENTRE GROWTH (MILLION
SQ.M)
12
10
180
New Shopping Centre GLA Per Annum (left axis)
Total GLA (right axis)
160
140
8
120
100
6
80
4
60
40
2
20
0
0
SHOPPING CENTRE RENTS & YIELDS
COUNTRY
AVERAGE PRIME
RENTS
(€/SQ.M/YEAR)
AVERAGE
PRIME YIELDS
(%)
Austria
932
6.44
Belgium
1,030
5.68
789
6.61
Czech Republic
Denmark
644
6.00
Finland
1,050
5.38
France
1,263
5.50
549
SHORTTERM YIELD
OUTLOOK
5.20
Germany
Hungary
504
7.71
1,800
8.00
725
7.81
Luxembourg
1,050
5.63
Netherlands
433
6.75
Norway
889
5.75
Poland
540.0
6.11
Portugal
610.0
8.42
Romania
369.6
9.45
Russia
2,591
9.25
Slovakia
660
7.25
Spain
627
7.06
Sweden
753
5.13
Turkey
739
7.75
1,548
5.15
Ireland
Italy
United Kingdom
Note: Yields marked in red are calculated on a net basis to include transfer costs, tax and legal fees.
Rents and yields relate to a range for the best shopping centres in each country and are indicative
only. Given the changing nature of the market and the costs implicit in any transaction, such as
financing, these are very much a guide only to indicate the approximate trend and direction of prime
initial yield levels and should not be used as a comparable for any particular property or transaction
without regard to the specifics of the property. It should also be noted that the shopping centre
format varies by country and a direct comparison between schemes in different markets should take
account of this.
SHOPPING CENTRE DEFINITION
Cushman & Wakefield defines a shopping centre as a centrally managed, purpose-built retail facility,
comprising units and communal areas, with a Gross Lettable Area over 5,000 sq.m. Factory Outlets
and Retail Parks are excluded. All graphs and tables are based on information from Cushman &
Wakefield's in-house European Shopping Centre Database.
This report has been produced by Cushman & Wakefield LLP for use by those with an interest in commercial property solely
for information purposes. It is not intended to be a complete description of the markets or developments to which it refers.
The report uses information obtained from public sources which Cushman & Wakefield LLP believe to be reliable, but we have
not verified such information and cannot guarantee that it is accurate and complete. No warranty or representation, express
or implied, is made as to the accuracy or completeness of any of the information contained herein and Cushman & Wakefield
LLP shall not be liable to any reader of this report or any third party in any way whatsoever. All expressions of opinion are
subject to change. Our prior written consent is required before this report can be reproduced in whole or in part. Should you
not wish to receive information from Cushman & Wakefield LLP or any related company, please email
unsubscribe@eur.cushwake.com with your details in the body of your email as they appear on this communication and head it
“Unsubscribe”. ©2013 Cushman & Wakefield LLP All rights reserved.