Precarious work in the asian seafood global value chain
•
1 j'aime•239 vues

The outsourcing of production and processing activities to the bottom of seafood global value chains (GVCs) in Asia has resulted in intensive labour exploitation and abuse of vulnerable workers—especially women migrant workers from marginalized communities. Workers at the base of seafood value chains in Bangladesh, India and Thailand suffer non-enforcement of legal rights and violations of ILO labour standards, including restricted freedom of association, low wages, gender discrimination, workplace violence, wage theft and child and forced labour.

Recommandé
Recommandé
Contenu connexe
Tendances
Tendances (17)
Similaire à Precarious work in the asian seafood global value chain
Similaire à Precarious work in the asian seafood global value chain (20)
Plus de Danish Anwar
Plus de Danish Anwar (9)
Dernier
Dernier (20)
Precarious work in the asian seafood global value chain
- 1. 1 Precarious Work in the Asian Seafood Global Value Chain
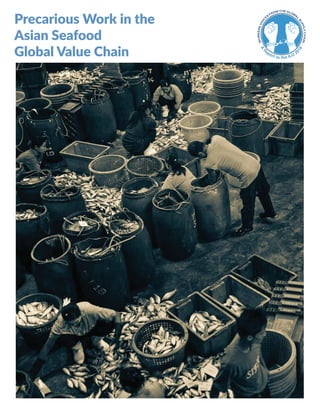
- 2. 2 3 Dock workers unloaded and sorted through barrels of fish at the processing facility in Ranong, Thailand in August. Adam Dean for the New York Times
- 3. 4 5 The outsourcing of production and processing activities to the bottom of seafood global value chains (GVCs) in Asia has resulted in intensive labour exploitation and abuse of vulnerable workers—especially women migrant workers from marginalized communities. Workers at the base of seafood value chains in Bangladesh, India and Thailand suffer non-enforcement of legal rights and violations of ILO labour standards, including restricted freedom of association, low wages, gender discrimination, workplace violence, wage theft and child and forced labour. The iteration of these rights violations across Asian countries testifies to the structural nature of these rights violations, reproduced across contexts and integrally linked to the structure of the seafood GVC. Moreover, with 200 countries currently participating in the seafood GVC, working conditions and wages in developing countries have significant impact on wages and working conditions in developing and developed countries alike. This report details the context of intensive labour exploitation and abuse of vulnerable workers in the Asian seafood industry and elsewhere. Part I The Global Seafood Industry, in brief, traces the rise of global fish consumption and the evolution of the contemporary seafood GVC—including sourcing and production, processing and distribution. This first section concludes with an overview of how consumer and environmental activists have managed to address food quality and safety concerns through international institutions and non-tariff trade barriers. It also identifies the nascent dialogue emerging around the need to protect workers’ rights in the seafood GVC. Part II Overview of the Asian Seafood Industry provides an overview of seafood value chains in Bangladesh, India and Thailand. Each overview identifies significant export commodities, traces the labour processes entailed in their production and processing and identifies workforce demographics. The basic structural overview provided in these country-level case studies of domestic seafood value chains reveals structural similarities and dissimilarities operating across Bangladesh, India and Thailand. Part III Precarious work in the Asian seafood industry discusses, in detail, the intensive labour exploitation and abuse faced by workers in the seafood GVC. Evidence of rights violations is drawn from existing studies and supplemented by primary research on seafood processing in India. In this section the human rights violations and consequences of precarious work in the Asian seafood processing industry are articulated thematically in order to surface the pattern of rights violations across Bangladesh, India and Thailand. The Conclusion: precarious work in the Asian seafood industry and the global race to the bottom, links the plight of seafood industrial workers in Asia to seafood production worldwide. This final section draws upon findings from the National Guestworker Alliance (NGA) in the United States to demonstrate how in order to compete in international markets, US seafood processors employ a contingent workforce highly vulnerable to workplace abuse and exploitation. EXECUTIVE SUMMARY RECOMMENDATIONS FOR THE ILO AT THE INTERNATIONAL LABOUR CONFERENCE, 2016 As detailed in this report on the seafood Global Production Network (GPN), due to the scale of global trade accounted for by GVCs, there is an urgent need for global mechanisms to monitor and regulate GVCs and GPNs. The ILO—the only global tripartite institution—has a unique role to play in setting standards for all of the actors that impact fundamental principles and rights at work. The ILO Tripartite declaration of principles concerning multinational enterprises and social policy (MNE Declaration), 2006 provides a good starting point. However, within the MNE Declaration, MNE refers only to subsidiaries or franchises. Accordingly, GVCs in their current form are not covered by this Declaration. The need of the hour is for the ILO to clarify and update its standards and mechanisms to protect workers employed by TNCs across vast GPNs. TNCs and their suppliers have a duty to obey national laws and respect international standards—especially those pertaining to realization of the fundamental principles and rights at work. A number of ILO core labour standards, such as the Forced Labour Convention, 1930 (No. 29), 2014 Protocol to the Forced Labour Convention 1930 and accompanying Recommendation, already protect workers in value chains. However, as this report details, changes in the modern workplace and globalization of value chains has opened up new gaps in the protection of fundamental principles and rights at work. In addition to clarifying the application of existing standards in global value chains, the ILO should set new standards and enforcement mechanisms and encourage national governments to do the same. The following recommendations emerge from our experience promoting the rights of workers in the global value chains. 1. Given the well-documented and rampant exploitation of workers and resources by MNEs operating through GVCs, and noting the limits on regulation under national legal regimes, the ILO should move towards a binding legal convention regulating GVCs. 1.1 Standards under this convention must be at least as effective and comprehensive as the UN Guiding Principle on Business and Human Rights and existing OECD mechanisms, including the 2011 OECD Guidelines for Multinational Enterprises. 1.2 The Convention should include the following components, among others: • Imposition of liability and sustainable contracting, capitalization and/or other requirements on lead firms to ensure accountability throughout the GVC. • Establishment of a Global Labour Inspectorate with monitoring and enforcement powers. • Publicly accessible transparency and traceability provisions. • Specific provisions that address the special vulnerability of migrant workers on GVCs. • Specific provisions that address the special vulnerability of women workers in GVCs. • Limits on the use of temporary, outsourced, self-employed, or other forms of contract labour that limit employer liability for worker protections. 2. Pursue a Recommendation on human rights due diligence that takes into account and builds upon existing due diligence provisions that are evolving under the United Nations Guiding Principles on Business and Human Rights and the 2011 OECD Guidelines for Multinational Enterprises.
- 4. 6 7 3. Take the following complementary measures to protect workers employed in global value chains: 3.1 Recognize the right to living wage as a human right and establish living wage criteria and mechanisms. 3.2 Promote sector-based and transnational collective bargaining and urge countries to remove national legal barriers to these forms of collective action. 3.3 Expand work towards the elimination of forced labour, including promoting ratification and implementation of the Forced Labour Convention, 1930 (No. 29), 2014 Protocol to the Forced Labour Convention 1930 and accompanying Recommendation. 3.4 Continue programs to ensure social protection, fair wages and health and safety at every level of GVCs. 4. Convene research to inform ILO global supply chain programming, including: 4.1 Research on adverse impacts of TNC purchasing practices upon • Core labour standards for all categories of workers across value chains. • Wages and benefits for all categories of value chain workers. This research should aim to satisfy basic needs of workers and their families. • Access to fundamental rights to food, housing, and education for all categories of value chain workers and their families. 4.2 Research into the range of global actors that may have leverage over GVCs including investors, hedge funds, pension funds and GVC networks that define industry standards such as Free on Board (FOB) prices. 4.3 Research into the types of technical advice needed by OECD government participants taking a multi-stakeholder approach to address risks of adverse impacts associated with products. 4.4 Research into mechanisms deployed by authoritative actors within GVCs that contribute to violations of fundamental principles and rights at work, including but not limited to attacks on freedom of association, collective bargaining, forced overtime, wage theft and forced labour. 5. Organize a Tripartite Conference on the adverse impact of contracting and purchasing practices upon migrant workers’ rights. This conference should focus on: • Protection of migrant rights as conferred under the UN International Convention on the Protection of the Rights of all Migrant Workers and Members of their Families. • The intersection of migrant rights and ILO initiatives to promote Decent Work in Global Supply Chains. ACKNOWLEDGMENTS FIGURES This report is one in a series of reports, entitled Workers’ Voices from Global Supply Chains: A Report to the ILO 2016. This study of the Asian seafood global value chain was conducted by the Society for Labour and Development. It was researched and written by Shikha Silliman Bhattacharjee, JD and Vaibhav Raaj. This report was edited by Anannya Bhattacharjee and Ashim Roy. Recommendations for the ILO at the International Labour Conference, 2016 were formulated by a group of organizations, including the international Asia Floor Wage Alliance, Jobs with Justice (USA), National Guestworkers Alliance (USA), and Society for Labour and Development (India). Figure 1: Map of Bangladesh Figure 2: Frozen Fish and Shrimp Exported from Bangladesh (1998-99 to 2013-14) Figure 3: Shrimp fry supply chain from collectors to farmers, Bangladesh Figure 4: India region-wise processing plants with capacity as of July 2014 Figure 5: Marine Exports Growth in India, 1995-96 to 2014-15 Figure 6: Marine Products Exports by India to all Markets Figure 7: Indian seafood value chain Figure 8: Table of revenue distribution along the Indian seafood value chain in Eranakulam and Alapuzha, Kerala, India Figure 9: Map of Thailand
- 5. 8 9ABBREVIATIONS AND ACRONYMS AFL-CIO American Federation of Labour- Congress of Industrial Organizations AFWA Asia Floor Wage Alliance BLA Bangladesh Labour Act, 2006 BFFEA The Bangladesh Frozen Food Exporters Association EC European Commission EIA Export Inspection Agency ESI Employees’ State Insurance EU European Union DOF Department of Fisheries FAO Food and Agricultural Organization of the United Nations FAO COFI FAO Committee on Fisheries GPN Global Production Network GDP Gross Domestic Product GSP Generalised System of Preference GVC Global Value Chain HAACP Hazards Analysis Critical Control Point ILO International Labour Organization INFOSAN International Food Safety Authorities Network IPOA-IUU International Plan of Action to Prevent, Deter and Eliminate Illegal, Unreported and Unregulated Fishing IPEC International Programme on Elimination of Child Labour IUU Illegal, Unreported and Unregulated MPEDA Marine Products Export Development Authority MSC Marine Stewardship Counsel NCBI National Center for Biotechnology Information NGA National Guestworker Alliance NGO Non-governmental Organization NTB Non-tariff Barrier OECD Organization for Economic Cooperation and Development OECD TRF Organization for Economic Cooperation and Development Transition to Responsible Fisheries OEM Original Equipment Manufacturer PSMA Port State Measures to Prevent, Deter and Eliminate Illegal, Unreported and Unregulated Fishing PF Provident Fund PPE Personal Protective Equipment RFB Regional Fishery Bodies SEAI Seafood Exporters Association of India SME Small and Medium Enterprises SPS Sanitary and Phytosanitary TFFA Thai Frozen Foods Association TNC Transnational Corporation TTIA Thai Tuna Industry Association UNCTAD United Nations Conference on Trade and Development US United States USD United States Dollar US FDA United States Food and Drug Administration WHO World Health Organization WTO World Trade Organization
- 6. 10 11 Combodian migrants hauled in the nets on a Thai-flagged fishing boat in the Gulf of Thailand in august. A labour shortage in the Thai fishing industry is primarily filled by using migrants, mostly from Cambodia & Myanmar. Adam Dean for the New York Times
- 7. 12 13 Part 1The Global Seafood Industry Global fish consumption In the last half-century, world fish consumption per capita has almost doubled—from an estimated 9.9 kgs per capita in the 1960’s to an estimated 19.2 kgs per capita in 20121 . While seafood is disproportionately consumed in developed countries2 , consumption has also increased in developing and low-income food deficit countries. Emergence of fish as a health food for affluent consumers suggests that fish production will continue to multiply in order to meet consumer demand across the planet3 . Keeping pace with demand, the industrial growth rate of fish for consumption has averaged 3.2 percent globally—far ahead of the world population growth rate of 1.6 percent4 . In 2012 more than 85 percent of the total fish produced from marine capture fisheries and aquaculture was for direct human consumption5 —a marked increase from the 1980’s when 71 percent of total fish production was for direct human 1 Food and Agriculture Organization of the United Nations (FAO), The State of World Fisheries and Aquaculture 2014, (available online: http://www.fao.org/3/a-i3720e01. pdf). 2 From 1961-2010, fish consumption rose from 4.9 to 10.9 kgs per capita in low income food deficit countries; 5.2 to 17.8 kgs per capita in developing countries. FAO 2014, supra note 1 at 4. 3 Bimal Prasanna Mohanty, et. al., Food Safety, Labeling Regulations and Fish Food Authentication, Science and Technology Development/Policy Issues (2013), 253 (available online: http://link.springer.com/ article/10.1007%2Fs40009-013-0139-x) (citing Delgado CL, etl al., Outlook for fish to 2020, Meeting Global demand: A 2020 vision for food, agriculture and the environmental initiative, International Food Policy Research Institute: Washington DC, 2003). 4 FAO 2014, supra note 1 at 3. 5 Id. 4 (indicating that 136 tonnes out of a total 158 tonnes of fisheries and aquaculture production was utilized for human consumption in 2012). consumption6 . Fish is now among the most traded food commodities in the world, representing about 10 percent of total agricultural exports and 1 percent of world merchandise traded in value terms. Global export value in seafood for consumption peaked in 2011 at USD 129.8 billion dollars, with a growth rate of 17 percent over the previous year7 . Seafood global production network (GPN) and global value chains (GVC) The rise in demand for seafood has unfolded alongside global reorganization of production and processing activities. Today, 200 countries participate in the seafood GVC 8 . In developing countries, fish consumption tends to be based upon seasonal availability of local products. In developed countries, by contrast, a growing share of fish for consumption is imported as a result of steady demand and declining domestic fish production9 . In 2012, the European Union (EU)— the largest import market for seafood, worth USD 24.9 billion—accounted for 23 percent of world imports in fish and fishery products, excluding intra-EU trade10 . The majority of fish consumed in the United States and Japan, 60 percent and 54 percent respectively, is also imported. Increased export orientation in the seafood industry is reflected in the growth rate of world trade in fish and fishery products: 8.3 percent growth per year 6 Id. at 47. 7 Id. at 7, 46. 8 Id. at 7, 46. 9 Id. at 3. 10 Id. at 50.
- 8. 14 15 in nominal terms and 4.1 percent in real terms between 1976 and 201211 . Within the last two decades, the EU, US and Japan have increasingly outsourced production and processing to developing countries in Asia, Latin America and Africa. In 2011, fish was the highest exported agricultural commodity for developing countries—leaving coffee, natural rubber and cocoa far behind in value terms12. Developing economies, whose exports represented just 34 percent of world seafood trade in 1982, saw their share rise to 54 percent of total fishery export value by 2012. In the same year, developing country exports represented more than 60 percent of the quantity (live weight) of total fishery exports. Due to reliance on seafood imports by developed countries to cover increasing consumption of fish and fishery products, developing countries have been able to supply fishery products without facing prohibitive customs duties13. The Global Production Network (GPN) is a term that describes this contemporary production system, which results from the shift in international trade from exchange based on distant market relationships to one based on closely networked firms. Exchanges between firms within this network are structured so that transnational corporations (TNCs) do not formally own the overseas subsidiaries or franchisees but outsource production to them, without the burden of legal ownership. As explained by the World Investment Report 2013 by UNCTAD: 11 Id. at 50. 12 Id. at 51-52. 13 Id. at 8, 51, 52, 53 (noting that exports from developing countries have increased significantly in recent decades also thanks to the lowering of tariffs, in particular for non-value-added products; and that this trend follows the expanding membership of the WTO, entry into force of numerous bilateral and multilateral trade agreements). Today’s global economy is characterized by global value chains (GVCs), in which intermediate goods and services are traded in fragmented and internationally dispersed production processes. GVCs are typically coordinated by TNCs, with cross-border trade of inputs and outputs taking place within their networks of affiliates, contractual partners and arm’s-length suppliers. TNC-coordinated GVCs account for some 80 per cent of global trade14 . As described by UNCTAD, the global production network (GPN) framework expresses the organizational linkages that the TNCs use to reorganize production through services and contractual agreements. The GPN shifts the market relationship between firms from a trade relationship to a quasi-production relationship without the risks of ownership. As with other GPNs, the way seafood products are prepared, marketed and delivered to consumers has changed significantly. As observed by the FAO, “processing is becoming more intensive, geographically concentrated, vertically integrated and linked with global supply chains.” Marine artisanal fishers and coastal agricultural communities with traditional livelihoods rooted in local systems of fishing and crop cultivation have been incorporated into global networks of commodity flows15 . Commodities may cross national boundaries several times before final consumption. Driving forces behind the seafood GVC include: • dramatic decreases in transport and communication costs; 14 Bob Poktrant, “Brackish Water Shrimp Farming and the Growth of Aquatic Monocultures in Coastal Bangladesh,” in J. Christensen, M. Tull (eds.), “Historical Perspectives of Fisheries Exploitation in the Indo-Pacific” (MARE Publication, 2014). 15 Id • progress in storage and preservation; • outsourcing of processing to countries where comparatively low wages and production costs provide a competitive advantage; • increasing consumption of fishery commodities; • favourable trade liberalization policies; • more efficient distribution and marketing; • and continuing technological innovations, including improvements in processing, packaging and transportation16 . Due to these forces, fish products may be produced in one country, processed in a second and consumed in a third. The seafood GVC can be roughly subdivided into three levels: 1. Sourcing and production of raw materials, including from the sea or aquaculture; 2. Processing and export, including post-harvest sale, transportation, processing, freezing and exporting; 3. Import and distribution: sale and delivery to grocery stores and restaurants17 . Driving these networks, TNCs increasingly dictate the standard and type of product, price, conditions of production and sale. Millions of the people around the world are employed by the seafood GVC. Overall, women accounted for 15-20 percent of people engaged in sourcing and production and as high as 90 percent in secondary activities such as processing18 . While the growth 16 Frank Asche and Martin D. Smith, Trade and Fisheries: Key Issues for the World Trade Organization, (Geneva: World Trade Organization Working Paper, 2009); FAO 2014, supra note2 at 46; David Green, Automation in Seafood Processing, J. of Aquatic Food Product Tech., 22:4, 337-338 (2013) (for discussion in advances in automated seafood processing). 17 This model has been adapted from Patarapong Intarakumnerd, et. al. “Innovation system of the seafood industry in Thailand,” 23 Asian Journal of Technology Innovation 2, 274 (2015). 18 FAO 2014, supra note 1 at 31. of the seafood GVC provides employment in many developing countries, it has also led to an increase in precarious jobs with low wages and poor working conditions. Sourcing and production: fishing and farming In 2012, 68 percent of the people employed in sourcing and production were engaged in capture fishing while 32 percent were engaged in aquaculture. Europe and North America have experienced a decrease in the number of people engaged in capture fishing and only a marginal increase in fish farming. In contrast, Africa and Asia have shown a sustained increase in the number of people engaged in capture fishing and even higher rates of increase in those engaged in fish farming. These trends in employment have been related to higher population growth and increased economic activity in the agricultural sector in Africa and Asia19 . Fish production alone, including fishers and fish farmers, engaged an estimated 58.3 million people in 201220 . Together, Africa and Asia both account for 94 percent of fishers and fish farmers. They also show the lowest output per person per year: 1.8 and 2.0 tonnes per person per year, respectively. These numbers are in stark contrast with annual average outputs of 24.0 and 20.1 tonnes per person per year in Europe and North America, respectively. The difference between these sets of numbers reflects higher degrees of industrialization in Europe and North America and the prevalence of small-scale producers in Africa 19 Id. at 28. 20 Id. at 27.
- 9. 16 17 and Asia21 . Of the 58.3 million people engaged as fish farmers—concentrated predominantly in either Africa or Asia—37 percent were engaged full time, 23 percent were engaged part time and the remaining 40 percent were either occasional workers or had an unspecified status. In total, 63 percent of all people employed as fishers and fish farmers are not engaged in full time employment22 . Fishing In general, employment in fishing has decreased in most European countries, North America and Japan and increased in Africa and Asia23 . The rising practice of illegal, unreported and unregulated (IUU)24 exploitation of wild fish stocks—especially from the shores of developing countries—has been referred to as “ocean grabbing.” According to the former UN Special Rapporteur on the right to food, Olivier De Schutter, “ocean grabbing” can be as serious as “land grabbing” in diverting resources from local populations.25 Fishing regulations are particularly challenging to enforce. Outside of a nation state’s “exclusive 21 Id. at 31. 22 Id. at 27. 23 Id. at 31. 24 Illegal, unreported and unregulated (IUU) exploitation of wild fish stocks refers to all fishing outside the ambit of laws and regulations. This includes fishing without a license, fishing in a closed area, fishing with prohibited gear, fishing in excess of quotas and fishing of prohibited species. 25 Charlotte Seager, “Fisheries in Africa are losing billions due to illegal practices,” The Guardian, May 8, 2014, accessed February 19, 2016, http://www.theguardian.com/ global-development-professionals-network/2014/may/08/ africa-progress-report-2014. economic zone”—a 200 mile strip of ocean adjacent to the shoreline— fishing vessels are governed by laws of the country in which they are registered. The country of registration is referred to as the “flag state.” In order to sidestep regulation, many fishing vessels are registered in countries with no meaningful link to their operations, incentive or capacity to enforce fishing regulations. This practice has been referred to as the use of “flags of convenience”—a structural loophole that permits environmental and social abuses in this sector26 . For instance, recent reports accuse hundreds of Chinese owned or “flagged” vessels of taking advantage of weak enforcement by African governments to indiscriminately net tons of fish off the coasts of Gambia, Guinea, Guinea-Bissau, Mauritania, Senegal and Sierra Leone27 . The source of fish is also particularly hard to trace. Challenges associated with tracing seafood catch to its source have implications for both illegal fishing and abusive labour practices. Small fishing boats that stay out to sea for years often transfer their catch to large “motherships.” Motherships carry fuel, extra food, spare nets and workers to the trawlers; and carry fish from smaller fishing boats to ports for sale. Once a load of fish is transferred to a mothership, it is very difficult to trace whether it was caught legally or poached— by paid fishermen or bonded migrant workers. While consumers can track some seafood exports to onshore processing facilities, the source of fish caught at sea is, in most cases, invisible28 26 International Transport Workers’ Federation, What are flags of convenience?, http://www.itfglobal.org/flags- convenience/sub-page. 27 Andrew Jacobs, Chinese “Fleets Illegally Fish in West African Waters, Greenpeace Says,” New York Times, May 20, 2015, accessed February 19, 2016, http://www. nytimes.com/2015/05/21/world/asia/china-west-africa- fishing-greenpeace.html?_r=0. 28 Ian Urbina, “‘Sea Slaves’: The Human Misery that Feeds Pets and Livestock,” New York Times, July 27, Farming World aquaculture production continues to grow, increasing 5.8 percent to 70.5 million tonnes in 2013 and contributing 42.2 percent of the total fish produced globally, including for non- food uses29 . Aquaculture can be categorized as either inland aquaculture or mariculture. Inland aquaculture generally uses freshwater, but some production operations use saline water in inland areas (e.g. Egypt) and inland saline-alkali water (e.g. China). Mariculture includes production operations in the sea and intertidal zones and land-based (onshore) saline production facilities and structures30 . Environmental risks associated with aquaculture include water pollution, wetland losses and mangrove destruction31 . Asia accounts for 88 percent of world aquaculture production by volume. In 2012, China accounted for 61.7 percent of the world’s total aquaculture production. India (6.3 percent), Vietnam (4.6 percent), Indonesia (4.6 percent), Bangladesh (2.6 percent) and Thailand (1.9 percent) also ranked among the top seven producers of farmed fish globally.32 2015, accessed February 15, 2015, http://www.nytimes. com/2015/07/27/world/outlaw-ocean-thailand-fishing-sea- slaves-pets.html?_r=0. 29 FAO 2014, supra note 1 at 18-19. 30 Id. at 22. 31 Parashar Kulkarni, The Marine Seafood Export Supply Chain in India: Current State and Influence of Import Requirements, CUTS Centre for International Trade, Economics and Environments, Jaipur, India (2005). 32 FAO 2014, supra note 1 at 21-22 (listing the amount of farmed food fish production by top 15 producers in tons and percentage in Table 7, including farmed fish pro- duction information for China, India, Viet Nam, Indonesia, Bangladesh, Norway, Thailand, Chile, Egypt, Myanmar, Phil- ippines, Brazil, Japan, Republic of Korea and United States). Processing Processing plants are at the apex of many domestic value chains and constitute the main interface between domestic production and international markets33 . Fish product processing plants vary in technology levels, with smaller workplaces relying entirely on manual handling of fish products and larger companies using modern, highly automated processes34 . Seafood processing ranges from simple gutting, heading or slicing, to more advanced value addition through breading, cooking and individual quick- freezing35 . In 2012, 54 percent of fish for human consumption was processed—cured, prepared or preserved in frozen forms. Of this, 12 percent (16 million tonnes) was dried, salted, smoked or otherwise cured; 13 percent (17 million tonnes) was preserved; and 29 percent (40 million tonnes) was preserved in frozen form36 . The growth in seafood processing for value addition has in turn led to more residual by-products. Fish by-products are utilized for a range of purposes including fish sausages, cakes, gelatin, sauces, pharmaceuticals, cosmetics, biodiesel fertilizer and animal feed37 . Outsourcing of processing activities is dictated by costs of labour and transportation; and species and final product specifications. For instance, Poland and the Baltic states process smoked and marinated products for sale in Central and Eastern Europe due to the highly sensitive shelf- 33 Bob Pokrant, “Work, Community, Environment and the Shrimp Export Industry in Bangladesh, India and Thailand,” in Michael Gillan and Bob Pokrant ed., Trade, Labour and Transformation of Community in Asia (Palgrave Macmillan, 2009), at 78. 34 MF Jeebhay, et. al., “World at Work: Fish processing workers,” 61 Occup. Environ. Med., 471 (2004). 35 FAO 2014, supra note 1 at 43. 36 Id. at 42. 37 Id. at 45.
- 10. 18 19 life of these products. Whole, frozen fish from Europe and North America, however, may be sent for labour-intensive processing to China, India, Indonesia and other developing countries and then reimported into markets of origin38 . Processing facilities operate predominantly in some of the world’s poorest regions or among poor workforces in developed countries. Traditional labour intensive processing methods— including filleting, salting, canning, drying and fermentation—often take place in rural economies with support from developing country governments as part of rural development and poverty alleviation strategies to generate employment39 . Distribution The concept of governance in GVC analysis is based upon the observation that value chains are rarely coordinated spontaneously through market exchange. Instead, large firms direct GVCs through their control over access to final markets40 . The seafood industry is led by supermarket chains, large retailers and food service operators that drive consumption patterns and set production requirements—including how fish is processed, packaged and shipped for distribution through retail chains41 . Consolidation within the retail sector has resulted in increasing concentration of power in the hands of a decreasing number of food product 38 Id. at 46. 39 Id. at 43. 40 Stefano Ponte, et. al., “The Blue Revolution in Asia: Upgrading and Governance in Aquaculture Value Chains,” 64 World Development (2014), at 52. 41 Asche, supra note 15 at 8; FAO 2014, supra note 1 at 69. importers, including major retail chains. Large supermarkets are consistently expanding their range of products to include foods that were previously supplied by small specialty outlets such as fish sellers and butchers. As these outlets vanish, control over GVCs is increasingly in the hands of large retail chains. This concentration of control moves primary decision-making regarding GVC practices to large importers and retail chains42 . In 2013, four supermarket retail brands—LIDL, ALDI, JUMBO and PLUS—together controlled 42.2 percent of the seafood import market in the Netherlands, 15.3 percent of the seafood import market in Germany and 8.4 percent of the seafood import market in the UK43 . Other major retail and food service conglomerates with significant control over the seafood GVC include Walmart, Costco, Safeway, Kroger, Publix, Darden and Trader Joe’s44 . In many areas, integrated traders coordinate trade between large retailers and sub-contracted production and processing activities—including complex networks of fishing vessels, ports and processing facilities. In this way, large integrated traders also exert control over large segments of the seafood industry. For instance, three 42 Jayasekhar Somasekharan, “Restructuring the Value Chain Governance: The Impact of Food Safety Regime on Fishery Sector of Kerala,” IIFET 2014 Australia, at 11, accessed February 43 Fairfood International, Caught in a trap: The story of poverty wages behind Asian shrimp sold in European markets (2015), 28-29. 44 Accenture, Exploitative Labor Practices in the Global Shrimp Industry (2013), at 32, accessed February 20, 2016, https://www.motherjones.com/files/accenture_ shrimp_report.pdf. (noting that Darden’s Red Lobster chain sells more shrimp in the U.S. than any other restaurant; identifying Walmart as the largest retailer in the United States and also the largest retailer of shrimp; and noting that Costco is one of the largest seafood retailers in America). integrated traders dominate the cannery-grade tuna market: FCF Fishery Company Ltd. (Taiwan), FCF Fishery Company (Taiwan) and TriMarine (United States). Together, these three trading companies coordinate 75-80 percent of trade in the Thai tuna market—the largest tuna market in the world45 . The model of supermarket chains and large retailers dictating production within the seafood GVC has been referred to as a “buyer driven commodity chain.” This terminology observes the role of large retailers, marketers and brands in driving geographically disbursed production and distribution systems46 . In this buyer-driven chain, large retailers have the capacity to secure the highest possible profit margins by fostering organizational flexibility and reducing and externalizing production costs47 . In short, low-cost production yields the highest returns. Major seafood buyers define the seafood GVC by their demand for seafood products that can be supplied consistently, reliably and in large volumes; maintain stable and competitive prices; and are reviewed by consumers as convenient and attractive. Consumer demand has come to include traceability, safety and health. These concerns, however, have not extended to ensuring that fair labour practices are maintained through all stages of production, processing and distribution. Instead, as the following sections detail, low cost 45 Asia Foundation and International Labour Organization (Asia Foundation-ILO), Migrant and Child Labour in Thailand’s Shrimp and Other Seafood Supply Chains (2015). 46 Anannya Bhattacharjee and Ashim Roy, “Bargaining in the Global Commodity Chain: the Asia Floor Wage Alliance,” in Kees van der Pijl, ed., Handbook on the International Political Economy of Proudction (Cheltenham: Edward Elgar, 2015), p. 334; CS Dolan, On Farm and Packhouse: Employment at the Bottom of a Global Value Chain,”69 Rural Sociology 1, 99-126 (2004). 47 Bhattacharjee and Roy, supra note 46 at 334. production has come to be synonymous with driving down wages and maintaining a low wage workforce48 . Regulating the seafood industry The global seafood market is governed by a complex system of regulations and international and national standards, including: • World Trade Organization (WTO) tariff and non-tariff regulations; • UN Food and Agriculture Organizaton (FAO) standards; • domestic regulations; and • a growing number of private third party certification agencies—such as Global Aquaculture Stewardship Best Aquaculture Practices (BAP), Aquaculture Stewardship Council (ASC) and Marine Stewardship Council (MSC).49 While consumer safety and environmental groups have had significant influence over international technical and environmental standards, wage standards and working conditions have been, for the most part, set by the market50 . Food quality and safety Expansion in demand for fish products has been accompanied by growing interest in nutrition, 48 Bhattacharjee and Roy, supra note 46 at 340-343 (detailing a similar phenomenon in the garment global GVC). 49 Pokrant 2014, supra note 40 at 111. 50 Md Saidul Islam, “From Sea to Shrimp Processing Factories in Bangladesh,” 3 J. of South Asian Dev. 2, 224 (2008).
- 11. 20 21 food safety and waste reduction. To promote food safety and protect consumers, increasingly stringent hygiene measures have been adopted at international and national levels51 . Measures to promote food safety include non-tariff trade regulations and national and regional food safety standards. Consumer protection initiatives within the seafood industry assume regulatory force through non-tariff trade regulations. Non-tariff trade regulations include application of required product standards, control on sanitary and phytosanitary (SPS) measures, procedures for import licensing and rules of origin and conformity assessments52 . According to the FAO, there has been no protectionist trend for fisheries tariffs and an average trend toward more liberal trade. However, tariff reductions have been offset by non-tariff barriers (NTBs)—and particularly SPS measures driven by consumer demand and health concerns. This evidence can be interpreted as a policy substitution in which tariffs have been replaced by NTB/SPS measures53 . Standards set by seafood importing countries have also directly defined global food safety requirements for imported fisheries products for consumption. European Commission (EC) Directive No. 91/493/ECC (1991), prescribes health conditions that must be met in order to place fish and fishery products in the unified European market. Under European Union (EU) regulations, processing facilities that export seafood to the EU require certification by a EU-nominated inspection agency. In 1995, the United States Food and Drug Administration (US FDA) made it compulsory for 51 FAO 2014, supra note 1 at 41. 52 Id. at 53. 53 Arne Melchior, The World Trade Organization Enlargement, Tariffs and Global Seafood Trade (Rome: Food and Agricultural Organization of the United Nations, 2015), 14. seafood processors and importers to comply with the Hazard Analysis Critical Control Point (HAACP), a food safety standard monitored by the US FDA. These standards have been nearly universally accepted worldwide.54 As the seafood industry evolves, concerns for food safety have evolved to accommodate specific risks associated with the evolution of the seafood GVC. For instance, increasing consumer demand for fish has prompted attention to guaranteeing the safety, traceability55 and authenticity of fish products. Increasing fish processing and handling of minced fish instead of whole fish specimens in global fish markets, for instance, has complicated identification of fish species. Accordingly, a number of global regulations have been implemented to assure species transparency.56 In order to uphold global food and safety standards, almost every country in the world has a government connected authority to monitor food safety issues from production to sale.57 National governments in developing countries have taken significant steps to adhere with food safety regulations in order to meet export standards. For instance, in 1997, Bangladesh was jolted into recognizing the authority of these regulatory agencies by a EU ban on Bangladeshi seafood exports. The ban was triggered by 54 Jayasekhar Somasekharan, “Food safety regulations and trade effects: The case of Indian seafood industry with special reference to Kerala, South India,” 7 Globelics International Conference (2009)(discussing, for instance, the impact of EU and HAACP food safety regulations on India’s seafood industry). 55 For further discussion of promotion of traceability, see FAO 2014, supra note 1 at 78-81, discussing traceability in context of food safety and animal health, certification related to sustainability, current regulations, traceability tools and challenges to traceability posed by the small-scale sector). 56 Mohanty, supra note 3 at 253-54. 57 Id. unsatisfactory reports following 1997 inspections of several processing facilities by a EU inspection team.58 Introduction of EU and HAACP food safety regulations in exporting countries has precipitated significant changes in the structure of the industry, including the rise of vertically integrated export units.59 Environmental protection Seafood production, whether from capture fishing or aquaculture, has a close connection to the environment. Inadequate regulation of fishing access is at the root of overexploitation of natural fish resources, degrading biological stocks and altering ecosystems. Aquaculture production directly impacts the ability of the environment to sustain future fish production. Due to the international nature of marine conservation, countries have used trade policy as an indirect means to protect the marine environment.60 The international community also works to address environmental risks posed by the seafood industry through non-binding codes that aim to advance sustainable fishing practices. The FAO Code of Conduct for Responsible Fisheries pertains to sustainable fishing and farm- based production and aims to ensure effective conservation, management and development of living aquatic resources that respects natural ecosystems and biodiversity. The Code 58 Pokrant 2009, supra note 32 at 94; James C. Cato and Carlos A. Lima, “European Union 1997 Seafodd- Safety Ban: The Economic Impact on Bangladesh Shrimp Processing,” 13 Marine Resource Economics, No. 3 (1998), at 220. 59 Somasekharan 2009, supra note 54 (discussing, for instance, the impact of EU and HAACP food safety regulations on India’s seafood industry). 60 Asche, supra note 15 at 2. provides standards applicable to conservation, management and development of fisheries. It also covers capture, processing and trade of fish and fishery products. In the context of international trade, the FAO calls for global harmonization of trade standards that prioritizes conservation principles over trade benefits and gains. The FAO has produced 28 technical detailed guidelines to assist fishers, industry and governments to implement various facets of the Code. The Code, together with four International Plans of Action and two strategies provide the broad framework within which the UN FAO operates. The FAO seeks implementation of the Code, in collaboration with states and international organizations, through regional and national workshops, development of technical guidelines and assistance to countries in developing plans of action.61 The FAO promotes food safety and the long term sustainability of fishery resources through Regional Fishery Bodies (RFBs)—the primary organizational mechanism through which states work together to ensure the long-term sustainability of shared fishery resources.62 Due to sustained efforts, many countries have fisheries policy and legislation that are increasingly consistent with the Code. However, many states still lack policy, legal and institutional frameworks for integrated coastal management and aquaculture development.63 Due to the threat posed to marine ecosystems by Illegal, unreported and unregulated (IUU) fishing, many States are striving to implement the International Plan of Action to Prevent, Deter and Eliminate Illegal, Unreported and Unregulated Fishing (IPOA–IUU). RFBs have also engaged in vigorous campaigns to combat IUU fishing. 61 FAO 2014, supra note 1 at 69-75. 62 Id. at 81. 63 Id. at 69-75.
- 12. 22 23 The binding 2009 FAO Agreement on Port State Measures to Prevent, Deter and Eliminate Illegal, Unreported and Unregulated Fishing (PSMA) (not yet in force) also aims to combat IUU fishing. In June 2014, the FAO Committee on Fisheries (COFI) will consider the “Voluntary Guidelines for Flag State Performance.” These guidelines aim to strengthen compliance by flag States regarding fishing vessels.64 Through labeling, consumer campaigns and certification, non-governmental organizations (NGOs) have also sought to establish environmentally linked product attributes. Such product attributes include the status of fish stock (whether it is overfished) and whether production methods harm marine diversity. While food safety has been a governmental concern, demarcation of environmental attributes has largely been pursued by private organizations.65 The Organization for Economic Cooperation and Development (OECD) document on Transition to Responsible Fisheries (TRF) (2002) presents yet another comprehensive model for transition to sustainable fisheries. Rights at work within the seafood GVC While NTB/SPS measures, driven by consumer demand and health concerns, have had significant impact in shaping conditions in the global seafood trade, labour standards do not feature in WTO trade mechanisms. Instead, the WTO has explicitly delegated labour measures to the International Labour Organization (ILO). While proposals to link trade and labour standards predate WTO negotiations, attempts to bring labour standards within the WTO framework resulted in sharp divisions between governments, trade unions 64 FAO 2014, supra note 1 at 9. 65 Asche, supra note 15 at 15. of the North and South and development sector NGOs. The WTO framework does, however, provide some room for labour standards to be relevant in trade through the Generalised System of Preference (GSP) that some countries have used to link access to preferential trade benefits to higher labour standards. The enabling clause exemption within Most Favoured Nation requirements allows developed countries to impose zero or lower tariffs on some goods from developing countries— including based upon labour and human rights conditions. The US and the EU both have GSP programmes. Since the introduction of the GSP programme, the EU withdrew preference from Myanmar (1997) for the systematic use of forced labour and Belarus (2006) for violations of freedom of association and collective bargaining. However, critics have noted that several other countries that retain GSP privileges have been consistently cited for grave labour standards violations from the ILO but have not faced similar actions.66 Exemplifying how trade agreements may be used to address labour violations, the European Parliament’s Committee on Fisheries has threatened to ban imports from Thailand in response to Thailand’s inadequate legal framework governing fisheries. Violations cited include illegal fishing, poor monitoring and control of traceability systems and exploitation of thousands of stateless Rohingya boat people within the Thai seafood value chain. The EC and European External Action service report collaborating with Thailand to intervene in key 66 Kajal Bhardwaj, “The International Trade and Investment Framework and the Implementation of the Asia Floor Wage: Challenges and Opportunities,” Towards an Asia Floor Wage: A Global South Labour Initiative for Garment Workers (Bangalore: Books for Change, 2015), 65-71. labour abuses in the fishing sector—particularly with regard to child and forced labour.67 Rights at work within the seafood industry are just beginning to be articulated by the FAO. In 2012, the FAO called for more attention to human dimensions in setting standards for responsible fisheries68 and the Rio+20 outcome document (The Future We Want), mentioned the employment security and human rights of fishers and their communities.69 The agenda for Blue Growth and provisions of the Voluntary Guidelines for the Responsible Governance of Land, Fisheries and Forests in the Context of National Food Security, include attention to employment rights of those who depend upon the seafood GVC for their livelihoods. Accordingly, this approach articulates principles aimed at securing tenure, income, market access and decent living and working conditions.70 The agenda for Blue Growth also includes access to markets for small-scale fishers and indigenous communities.71 By recognizing the rights of workers within the seafood GVC, the Blue Growth agenda begins an important conversation on protecting workers. However, these measures, promoted through voluntary compliance are unlikely to address the vulnerabilities faced by precarious workers within the seafood GVC. Due to a range of factors—including poor capacity, limited resources, infrastructural needs and, in some cases, adverse disposition towards protective labour standards—national labour standards in developing countries remain weak. Proclivity towards driving down labour standards, 67 Georgi Gotev, “Thai seafood products could be banned, warns MEP,” Bilaterals.org, July 23, 2015, accessed February 14, 2016, http://www.bilaterals.org/?thai-seafood- products-could-be. 68 FAO 2014, supra note 1 at 8. 69 Id. at 8. 70 Id. at 76-77. 71 Id. furthermore, is often linked to dominant global policy frameworks that prescribe labour deregulation as a prerequisite to attracting investment capital.72 72 Sangeeta Ghosh, “Global Value Chains and the Garment Sector in India,” Towards an Asia Floor Wage: A Global South Labour Initiative for Garment Workers (Bangalore: Books for Change, 2015), 24 (citing A. Posthuma, “Beyond Regulatory Enclaves: Challenges and Opportunities to Promote Decent Work in Global Production Networks,” in A. Posthuma and D. Nathan (ed.), Labour in Global Production Networks in India (New Delhi: Oxford, 2010)).
- 13. 24 25 Part 2Overview of the Asian seafood industry Asian countries contribute significantly to both marine capture and aquaculture-based seafood production. Of the 58.3 million people engaged worldwide as fishers or fish farmers in 2014, 84 percent were in Asia. The surge in seafood production in Asia has been attributed to abundant availability of cheap labour, land and other natural resources. In 2011-12, 11 Asian countries ranked among the top 18 producer countries in marine capture—accounting for more than 76 percent of global marine catch. Asia accounts for 68 percent of the global fleet of fishing vessels—approximately 3.23 million vessels. Asian countries also contribute almost 88 percent of the world’s farmed food production with 96 percent of all people engaged in fish farming in Asia.73 The seafood market is global, but it is also highly segmented—both by species and by product forms.74 The following sections provide an overview of seafood value chains in Bangladesh, India and Thailand. Each overview presents significant export commodities and traces the labour processes entailed in their production and processing. These country-level overviews provide basic information on workforce demographics. Despite the significant differences in industrial development among seafood value chains in Bangladesh, India and Thailand, exploitative labour practices have been documented across the region. In order to capture regional trends, labour conditions will be discussed in Part III of this report. Bangladesh Since 2003, Bangladeshi seafood production 73 FAO 2014, supra note 1 at 27. 74 Asche, supra note 15 at 13. has grown 35 percent, due in part to significant advances in aquaculture production (Figure 2). In 2012, Bangladesh ranked the fourth largest producer of inland water-capture seafood production and the fifth largest producer of farmed fish. From 2013-14, Bangladesh’s total export earnings from seafood were approximately USD 550 million from shrimp and USD 52 million from fish. In the same year, the top five countries importing Bangladeshi frozen shrimp and fish products were Belgium (USD 107.85 million), the United Kingdom (USD 105.39 million), Netherlands (USD 84.26 million), Germany (USD 67.8 million) and the US (USD 55.06 million). In addition to bringing in export revenue, fish and fishery products provide 56 percent of Figure 1: Map of Bangladesh Source: Google Maps
- 14. 26 27 Bangladesh’s animal protein intake.75 In 2015, the Bangladeshi shrimp export industry faced a demand slump. Between corresponding periods, July-August 2014-2015 and July-August 2015-2016, Bangladeshi profits from frozen shrimp exports dropped by 41 percent. Exports to major destinations, including the US, EU and Russia declined and prices fell. For instance, import prices in the EU for frozen shrimp declined from USD 12.88 to USD 8.96 per kg between 2013-2014 and 2014-2015. This slump in the Bangladeshi shrimp industry can be attributed, at least in part, to the declining strength of the Euro and Rouble and rising exports of a cheaper variety of shrimp (vannamei).76 75 FAO 2014, supra note 1. 76 Id. 0 0 100 50 100 150 200 250 200 300 400 500 600 700 Frozen Fish and Shrimp Exported from Bangladesh (1998-99 to 2013-14) 1998-991999-002000-012001-022002-032003-042004-052005-062006-072007-082008-092009-102010-112011-122012-132013-14 Quantity (in Million Lbs)Value (in Million USD) Figure 2: Frozen Fish and Shrimp Exported from Bangladesh (1998-99 to 2013-14) Source: Bangladesh Frozen Foods Exporters Association, 2014 Bangladeshi shrimp value chain In the 1990s, when the World Bank and Asian Development Bank promoted shrimp farming as an important new source of foreign exchange earnings, Bangladesh underwent a rapid growth in shrimp farms, shrimp depots, processing plants and a labour force engaged in wild shrimp collection. In 1991, shrimp farmers and hatchery collectors were granted tax exemptions and reduced rate bank loans. In 1992, the Bangladesh Government introduced the Shrimp Mohal Management Policy, supporting conversion of suitable public land to shrimp farms. Government investment and assistance to the shrimp sector has been greatest in the processing and hatchery sectors that have been dominated by wealthy Bangladeshis.77 Today, the shrimp industry is the second largest foreign exchange commodity in Bangladesh, following the garment industry.78 Shrimp production in Bangladesh involves a local value chain, including shrimp producers (catchers, hatchers and farmers), local depot owners and processing factories. Traders work as intermediaries at each stage of the chain.79 The shrimp industry alone employs approximately 1 million people during peak season across the value chain. The majority of these workers are from southwestern Bangladesh where poverty is overwhelming.80 While there is significant 77 Pokrant, supra note 14 at 119. 78 Pokrant 2014, supra note 14 at 115. 79 Islam, supra note 50 at 219. 80 Solidarity Center, The Plight of Shrimp-Processing Workers of Southern Bangladesh, January 2012, p. participation by women in the Bangladesh shrimp value chain, they are concentrated in low wage labour, including fry collection and pre- processing.81 Within processing factories, women also routinely receive lower wages for the same work performed by their male counterparts. Input suppliers: catching, hatching and sorting fry Wild fry (larvae) catching takes place across at least 12 districts in Bangladesh with major hubs 3, accessed online October 27, 2015, http://www. solidaritycenter.org/wpcontent/uploads/2014/11/pubs_ bangladesh_shrimpreport2012.pdf. 81 Islam, supra note 50 at 221. in Barisal, Khulna and Cox Bazaar.82 While there is no firm data on how many Bangladeshis engage in wild fry catching, it is estimated that several hundred thousand people collect fry along the coast and estuaries. The high season for fry collection lasts from March until August. During this period, collectors may spend between six and ten hours a day catching fry in rivers and estuaries. For the remainder of the year, fry collectors sustain themselves and their families by borrowing money and working as day labourers, honey collectors and in other temporary occupations.83 In the last fifteen years, fry collection has come under intense scrutiny by ecologists for its environmental impacts and by social sector NGOs for persistent child labour at this stage of the value chain. Fry collecting, typically carried out by family groups—including young boys and girls—requires long hours of standing waist deep in water with nets. There is also evidence that fry collection threatens coastal ecosystems by affecting aquatic species diversity. Bangladesh banned fry collection in 2000 but the ban is poorly enforced and the practice persists.84 Rather than protecting vulnerable workers, the ban has made fry collectors more open to exploitation. Fry collectors report facing extortion and threats of violence from local authorities and paramilitaries.85 Fry can also be bred from mother shrimp in hatcheries. However, hatcheries require investment in infrastructure and feed, including 82 Sarah Gammage, et. al, A Pro Poor Analysis of the Shrimp Sector in Bangladesh, USAID (2006). 83 Environmental Justice Foundation, Impossibly Cheap: Abuse and Injustice in Bangladesh’s Shrimp Industry (2014), 11. 84 Pokrant 2014, supra note 14 at 112, 121, 122. 85 Environmental Justice Foundation, supra note 83 at 11 Figure 3: Shrimp fry supply chain from collectors to farmers Source: S. Tasnoova, et. al., Market Structure and Procurement System for Shrimp Export Industry in Bangladesh (2010).
- 15. 28 29 quiet and clean breeding rooms. Between wild and hatchery-bred fries, hatchery-bred fries are considered better quality and attract higher prices. Most small and some medium-scale farmers are unable to afford to purchase larvae. They commonly take conditional loans from traders, requiring the farmer to sell shrimp back to the trader below market price.86 Captured and bred fry are traded through small and larger middlemen. Smaller middlemen, referred to as fry faria, buy from catchers and hatcheries to sell to larger middlemen, referred to as fry aratdars. Peak season for trading takes place from April to August each year. Farias may face considerable financial distress in off-peak season and often end up borrowing money from aratdars who, in return, command exclusive rights over the fry bought and sold by the faria. After collecting fry from faria, catchers and hatcheries, fry aratdars, sell and transport their stock to commission agents. Fry are then sold to shrimp farms and nurseries by commission agents. In order to increase their value, fry may be kept in nurseries for nourishment and acclimatization before being sold to farms or nurseries.87 Shrimp farming Shrimp farming is considered the second major stage in Bangladesh’s shrimp value chain. Fry collectors sell their produce to middlemen and markets from where it is purchased by shrimp farmers (Figure 3). Farmers, then, raise shrimp in ponds over the course of three to six months until it is ready to 86 Islam, supra note 50 at 220. 87 Gammage, supra note 82. sell.88 However, most shrimp farmers do not have direct market access to processing factories or foreign traders. They are instead separated from the market by layers of intermediaries, including depots and intermediaries. Only very few farmers sell directly to shrimp processing factories.89 The financial pressures on shrimp farmers can be extreme. According to a 2012 study, shrimp farmers typically support six-member families with a daily income of 350 taka—or USD 0.83 per family member per day. Many shrimp farmers report being locked into cycles of debt with few options for livelihood diversification. Shrimp prices are fixed by the Bangladesh Frozen Foods Exporters Association (BFFEA), which holds a monopoly over the national market by uniting 96 of the 145 processing factories in Bangladesh. According to Bangladeshi shrimp farmers, prices are fixed below the value of their produce—with prices dropping in recent years. Farmers also report lengthy delays in payment with some reporting waits for more than a year before they are paid by depots. Though processing companies receive subsidy payments in instances in which shipments are cancelled or rejected, these benefits are rarely passed on to shrimp farmers and depot owners.90 In 2014, estimates on the number of shrimp farms in Bangladesh ranged from 120,000 – 250,000.91 Farms are concentrated mainly in the southwest and southeast and cover over 217,000 hectares. Large shrimp farms are usually around 135 hectares [365 acres], with approximately 5000 fry seeded per hectare. Small shrimp farms, by contrast are an average of 4.5 hectares. While 88 Environmental Justice Foundation, supra note 83 at 22. 89 Id. 90 Id. at 22, 23, 29. 91 Pokrant 2014, supra note 14 at 112; Environmental Justice Foundation, supra note 83 at 22. traditional shrimp farming was monoculture, mixed farming has increased in popularity due to potential for higher income and reduced risk of particular diseases. Farms in Bangladesh are relatively underdeveloped by international standards with low stocking densities, limited artificial feed use and poor water quality management.92 In the southwest, most farms engage in shrimp- rice rotation. In the southeast, shrimp-salt rotation and shrimp only production are most common. Of Bangladesh’s most popular varieties, Bagda shrimp is largely farmed in coastal Khulna, Bagerhat and Satkhira, whereas Golda shrimp (Tiger prawns) are farmed in central districts since this species does not require seawater.93 Employment on shrimp farms is seasonal, drawing local and migrant Bangladeshi labour.94 Several studies have pointed to a decline in land area devoted to rice farming and other more traditional forms of livelihood and employment opportunities due to the expansion of shrimp farms. More traditional common pool resources have been converted to private use, sharecropping opportunities in rice farming have diminished and grazing lands have been reduced. One of the most dramatic impacts of shrimp farming was the destruction and clearing of the Chakoria Sundarbans mangrove forest in Southeast Bangladesh during the 1980s and 1990s. The sector as a whole, however, has also generated new jobs in shrimp processing, trading and distribution. These forces have prompted both migration from rural areas by marginal farmers and in-migration to shrimp farming communities. Some landless workers have secured jobs as farm guards, shrimp harvesters 92 Pokrant 2014, supra note 14 at 112. 93 Gammage, supra note 82. 94 Pokrant 2014, supra note 14 at 112. and transporters of fry, prawn, ice and shrimp feed.95 Shrimp processing Shrimp farms sell to thousands of traders who, in turn, supply shrimp to over 10,000 shrimp depot owners.96 Traders usually transport shrimp from farmlands to urban depots situated near processing factories. Many traders take loans from depot owners and are therefore bound to sell shrimp to particular depots. Limited pre- processing is usually done at depots, including washing, de-heading, icing and packaging.97 Some farmers also do limited processing (de-heading and de-veining).98 Depots, in turn, sell to independent traders and commission agents who supply to the 148 processing plants located mainly in Khulna and Chittagong.99 Tasks in shrimp processing include de-heading, peeling and cleaning. Workers, hired and paid by contractors, earn piece-rate for completing these tasks. As casual employees, shrimp processing workers are outside the ambit of the Factory Law, 1965 and Industrial Relations Ordinance Act, 1979.100 Today, processing plants are high-level facilities engaged in actively monitoring hygiene and product quality in order to meet the demands of food safety regulatory standards. The Bangladesh Frozen Food Exporters Association (BFFEA), with 98 member units, represents the interests of fishery product processors domestically and internationally. In 2015, 78 BFFEA members were 95 Id. 119-120. 96 Id. at 112. 97 Islam, supra note 50 at 220. 98 Gammage, supra note 82. 99 Pokrant 2014, supra note 14 at 112. 100 Islalm, supra note 50 at 226.
- 16. 30 31 licensed by the Department of Fisheries (DOF) and 75 were EU approved processing plants.101 Working conditions and workforce demographics Shrimp processors and exporters are the most economically and politically powerful actors in the Bangladeshi shrimp value chain. Within this model, large shrimp farmers, aratdars, small shrimp farmers, fry collectors and shrimp processing workers have progressively decreasing access to industry gains and control over working conditions and wages—with fry collectors and shrimp processing workers at the base of this value chain. While tasked with conforming to product specifications and health standards set by supermarket chains, large retailers and food safety regulatory bodies, processors and exporters are not similarly accountable for wages and working conditions for the range of actors engaged in the domestic value chain. This has led to widespread exploitation of vulnerable workers and violation of labour rights in the Bangladeshi shrimp industry. As early as 2007, the American Federation of Labour-Congress of Industrial Organizations (AFL- CIO), likened overall conditions of work in the shrimp processing industry to those in company towns run by coal miners in the U.S. in the late 19th century. The ALF-CIO labour conditions in the shrimp industry in Bangladesh as among the worst observed in Asia, including dangerous child labour, ownership of workers’ hovels and debt bondage of local stores selling food to workers.102 101 Pokrant 2014, supra note 14 at 112. 102 Solidarity Center, The True Cost of Shrimp (2007), accessed February 20, 2016, http://www.shrimpnews.com/ Landless women and men are the predominant labour force employed in these precarious, labour intensive and low paying positions. Fry collectors tend to be landless, unskilled and untrained, with 93 percent of women and 70 percent of men functionally illiterate. Women who collect fry are frequently divorced, separated, deserted and widowed. They report being excluded from community activities due to the perception that fry catching is demeaning labour.103 More than two out of three processing plant workers are women. Child labour is also prevalent across the seafood processing sector in Bangladesh. For instance, according to a 2010-11 survey of 700 permanent and contract workers in 36 seafood processing plants across Khulna, Satkhira, Bagerhat and Jessore in southwestern Bangladesh, 96 percent of workers interviewed reported that there were children between the ages of 14 and 18 working in their factories.104 These already vulnerable workers are left particularly vulnerable to exploitation due to failure by Bangladeshi authorities to implement national labour laws, including those governing minimum wages, preventing exploitation of child workers and protecting workers against other forms of abuse.105 As discussed in Part III: Precarious work in the Asian seafood industry, these workers face significant rights abuses and have few if any avenues for redress. PDFsFolder/pubs_True_Cost_of_Shrimp.pdf. 103 Accenture, supra note 44 at 45. 104 Solidarity Center 2012, supra note 80 at 5. 105 Solidarity Center 2012, supra note 80; Environmental Justice Foundation, supra note 83 at 9. India India’s export of marine products has increased significantly in the last decade (Figure 5). In 2014/15, marine product exports from India reached an all time high of over 5.5 billion USD.106 The seafood industry in India accounts for about 1 percent of the national GDP, employing approximately 14 million people. The EU and the US are India’s two largest seafood buyers (Figure 6).107 In 2013, the share of shrimp in the Indian 106 Marine Products Export Development Authority (MPEDA), “Indian Seafood exports crossed 5.5 billion US$,” accessed on February 2, 2016, http://164.100.150.120/ mpeda/news_details.php?pg=indian-seafood-exports- crossed-5-5-billion-us#. 107 Mohanty, supra note 3 at 254 (citing Indian Council Figure 4: India region-wise processing plants with capacity, including EU/non EU certification (July 2014) Source: India Marine Products Development Authority
- 17. 32 33 seafood export basket jumped from 52 to 70 percent. Vannamei shrimp production increased to meet rising demand due to decline in global shrimp production due to disease in aquaculture farms in Thailand, China and Vietnam.108 Coastal Chennai, Mumbai, Kerala and Vishakapatnam are the four biggest seafood- of Agricultural Research, Central Institute of Fisheries Technology, Growth in Export of Indian Marine Products, 1961/2-2011/12, accessed February 20, 2016, http://www. cift.res.in/innercontent.php?contentid=MTgw). 108 PK Krishnakumar, “Shrimps for 70% of seafood export basket on global shortage,” The Economic Times, November 13, 2013, accessed February 20, 2016, http:// articles.economictimes.indiatimes.com/2013-11-13/ news/44031102_1_vannamei-seafood-export-basket- export-earnings exporting ports in India.109 Major processing centers are concentrated in Veraval and Porbunder, Gujarat; Mumbai and Ratnagiri, Maharashra; Goa, Mangalore and the Kollam Kochi belt of Kerala; and Tuticorin, Nellore and Mandapam, Tamil Nadu. The peak period for fisheries activities in these areas is from September to April, with a lean season from June- August.110 Despite its significance within the economy, India’s seafood industry does not contribute significantly to domestic food security beyond the coastal regions.111 Contribution of fish to total protein 109 Kulkarni, supra note 30 at 5 110 G. Dhanya, Karwar Research Center of Central Marine Fisheries, “Status of women employed in seafood pre-processing units of Alapuzha, Kerala,” 33 Fishing Chimes 7, October 2013, at 42. 111 Within India, this number varies with coastal communities consuming as much as 22.7 kg per capita of intake in India remains at 2 percent—compared, for instance to Cambodia and Myanmar where fish products contribute 37 and 22 percent respectively to total protein intake.112 Regulatory authority over the domestic seafood industry is shared between India’s central and state governments. At the national level, the Department of Animal Husbandry, Dairying and Fisheries and the Ministry of Food Processing Industries are tasked with overseeing development of the seafood industry. The Marine Products Export Development Authority (MPEDA) and Export Inspection Agency (EIA) hold responsibility for export promotion. In 1997, MPEDA made compliance with HAACP regulatory standards mandatory for all seafood processing and export units. MPEDA has also mandated compliance with EU standards. HAACP and EU regulations required Indian regulatory bodies to strike a balance between the significant costs imposed on the processing sector with secured market access. For instance, when residues of antibiotics and bacterial inhibitors were detected by EU authorities in shrimp during 2002, the Indian government imposed strict control on antibiotic use. However, recognizing the costs to processers, the government differentiated export standards for the EU and other overseas markets. Exporters to non-EU markets were granted a longer timeline to integrate preprocessing operations and to source from approved independent preprocessors. MPEDA supported improvements in hygienic controls and other food safety practices in fish processing through subsidy programmes for training and upgrading processing facilities.113 fish annually. FAO 2014, supra note 1. 112 Id. 113 Somasekharan 2014, supra note 42 at 9. Indian seafood value chains Within India, the seafood value chain includes fishers and fish farmers, suppliers (responsible for processing) and exporters. According to a 2014 study tracing value addition through the shrimp export supply chain in Eranakulam and Alapuzha districts in Kerala, the landing site price for shrimp in India’s value chain is about 23 percent of the final retail price. This increases to 38 percent of the retail price at the export point. The largest value addition is made by supermarket chains (Figure 6). Fishing and fish farming In 2014, India ranked seventh in the world in marine capture production. Marine capture production has grown significantly in the last decade, with a growth of 15.1 percent in volume between 2003 and 2012. India also ranked second after China in production through inland water capture, registering growth of 93 percent in this area.114 In addition to robust capture production, India ranks second behind China among major producers of farmed fish for consumption. Within India, Andhra Pradesh is the leading producer of farmed Tiger and Pacific Shrimp—species that constitute the majority of India’s exports. Other major producers of farmed shrimp include West 114 FAO, supra note 1. Figure 5: Marine Exports Growth in India, 1995-96 to 2014-15 Source: India Marine Products Development Figure 6: Marine Products Exports by India to all Markets Source: India Marine Products Development Figure 7: Indian seafood value chain
- 18. 34 35 Bengal, Tamil Nadu (and Pondicherry), Gujarat and Orissa.115 In 2009, 92,591 farmers raised brackish water shrimp. 83,824 (90.57 percent) were small farmers owning less than two hectares.116 115 Marine Products Export Development Authority (MPEDA), “State-wise details of shrimp and scampi produc- tion,” accessed February 2, 2016, http://164.100.150.120/ mpeda/cms.php?id=eWVhci13aXNlLXNwZWNpZXMt- d2lzZS1zdGF0ZS13aXNl# 116 Pokrant 2009, supra note * at 77. Processing Processing in India is further subdivided into pre-processing and processing. Pre-processing includes cleaning, peeling, washing and icing fish and seafood products. Processing consists of grading, packing, weighing and freezing. The above classification suggests two types of processes that in some cases take place in distinct types of units: labour intensive, small scale units engaged in pre-processing; and capital intensive large scale units engaged in processing.117 Peeling 117 M.V. Shobhava Warrier, “Women at Work: Migrant Women in Fish Processing Industry,” 36 Economic and Politi- cal Weekly 37, September 15-21 2001, pp. 3554-3562. sheds in Kerala, responsible for pre-processing of shrimp, cuttlefish and squid, provide a clear example of small-scale, labour-intensive pre- processing units.118 The success of pre-processing operations depends upon experienced labour and the availability of raw material.119 Large scale, capital-intensive units, by contrast, are characterized by sophisticated technology for packing, grading and freezing pre-processed seafood products. Processing facilities have also become a destination for filleting and packaging seafood produced in other countries. Processing units in India have been characterized as non-integrated, partially integrated and fully integrated—depending upon whether they carry out pre-processing and/or processing activities. Recent studies suggest that, at least in Kerala, pre-processing and processing are increasingly consolidated, gradually reducing the number of independent pre-processing units. The shift to integrated pre-processing by EU-approved processing facilities has led to the closure of a significant number of preprocessing operations.120 The coexistence and recent integration of these two extremely diverse types of units has contributed to problems in regulating the industry.121 HAACP and EC Directive 91/4937 are enforced only at the level of processing units. The Seafood Exporters Association of India (SEAI) claims to have spent USD 25 million upgrading their facilities to meet the food safety regulations of importing countries.122 Peeling sheds and pre- processing facilities, however, remain largely outside of the purview of regulation. 118 Naveen Sathyan, et. al., “The present status of sea food pre-processing facilities in Kerala with reference to Allepey district,” 4 Int. J. of Res. in Fisheries and Aquaculture 1, 39, 42 (2014). 119 Sathyan, supra note 118 at 39. 120 Somasekharan 2014, supra note 42 at 10. 121 Warrier, supra note 117. 122 Somasekharan 2014, supra note* at 1. Working conditions and workforce demographics In 2012, the Central Institute of Fisheries Technology noted that women played a minimal role in actual fishing and were mostly engaged in lower paid, more menial, related activities including making and mending nets.123 Women also form the dominant workforce in pre- processing—more than 90 percent in prawn pre- processing centres and 70 percent in other fishery pre-processing centres. Women engaged in pre-processing centres are disproportionately from economically backward classes. 90 percent of women engaged in seafood processing are confined to floor level work. Very few attain supervisory and technical roles. They are hired as casual, unskilled labour and do not receive job security and social security benefits.124 Internal migrants from Kerala and Tamil Nadu make up a significant portion of workers in fish processing plants in Gujarat.125 However, in recent years, an increasing number of migrants from North and Northeast India are also migrating for employment in the seafood processing sector in Gujarat. The practice of employing casual workers in pre-processing allows availability of raw seafood materials to entirely dictate working conditions, including hours and the number of workers engaged at any particular time.126 In India, 123 Central Institute of Fisheries Technology, Indian Council of Agricultural Research, Gender in Fisheries: A Fu- ture Roadmap (2012). 124 Naveen Sathyan, et. al., “The present status of sea food pre-processing facilities in Kerala with reference to Allepey district,” 4 Int. J. of Res. in Fisheries and Aquaculture 1, 39, 42 (2014). 125 Fairfood International, supra note 43 at 16. 126 M.V. Shobhava Warrier, “Women at Work: Migrant Value chain node Price (Indian rupees/kg) Price as retail price (%) Landing site 140.5 23.35 Price paid by peeling shed owner/commission agent 146.5 24.35 Peeling shed Price paid by exporter/agent (A) 156 25.93 Exporter 1.55 a) Conversion cost 9.3 2.31 b) Overhead cost 13.9 3.86 23.2 0 Selling expenditure 0.54 a) Packing charges 3.25 1.66 b) Frieght charges 10.01 0.93 c) Interest on working capital 5.62 0 d) Interest on term loan 0.52 0.09 e) Other selling expenses 3.9 0.65 Total selling expenditure (C) 23.3 3.87 Total cost of export (B+C) 46.5 7.73 Exporters margin D -(A+B+C) 25.9 4.3 Importer/agent Price paid to the exporter (D) 228.4 37.96 Cold chain transport and other expenses(E) 22.4 3.72 Importer/Importer agent’s margin F-(D+E) 38.6 6.41 Whole sale importer 289.4 48.1 32.1 5.33 Importer re-processors margin H-(F+G) 70.1 11.65 Supermarkets Price paid to the importer - reprocessor (H) 391.6 65.08 60.12 9.99 Supermarkets margin J-(H+I) 150 24.93 Consumer Price paid at retail outlet (J) 601.72 100 Figure 8: Table of revenue distribution along the Indian seafood value chain in Eranakulam and Alapuzha, Kerala Source: Somasekharan 2014
- 19. 36 37 presence of a readily available workforce to process seafood upon its arrival is, in many cases, maintained by housing migrant workers on site at pre-processing and processing units.127 Due to lack of regulation at the pre-processing level, as in Bangladesh, workers at the base of India’s seafood value chain remain outside the ambit of national and international regulations, leaving them particularly vulnerable to abuses at work. Thailand In 2012, Thailand ranked as the third largest exporter of fish and fishery products in the world, after China and Norway. 90 percent of all production in the Thai seafood industry is for export, with the US, Japan and EU as the top export destinations.128 Internationally traded marine shrimp species account for half of Thailand’s seafood production.129 Pet food is among the fastest growing exports from Thailand, more than doubling since 2009 and totaling more than USD 190 million in 2014.130 In 2013, the total export of fish products from Thailand in value terms was estimated at about USD 8.8 billion (264.4 billion Baht).131 Within the last decade availability of domestic Women in Fish Processing Industry,” 36 Economic and Politi- cal Weekly 37, September 15-21 2001, pp. 3554-3562. 127 This practice was documented by the Society for Labour and Development and National Guest Workers Alliance in processing hubs of Kerala and Tamil Nadu. See Case Studies of the Seafood Processing Industry in Tamil Nadu and Gujarat (2015)(unpublished findings, on file with author). 128 Fairfood International, supra note 43 at 11. 129 FAO 2014, supra note 1. 130 Ian Urbina, “‘Sea Slaves’: The Human Misery that Feeds Pets and Livestock,” New York Times, July 27, 2015, accessed February 15, 2015, http://www.nytimes. com/2015/07/27/world/outla w-ocean-thailand-fishing-sea-slaves-pets.html?_r=0. 131 Intarakumnerd, et. al. supra note 16 at 272, 273. raw material within Thailand has decreased due to declines in marine-capture fisheries and aquaculture. In 2012, for instance, the shrimp industry faced disease-related problems.132 Aquaculture now contributes about 80 percent of all production in Thailand. As one of the most advanced processing centres for seafood in Asia, Thailand has also emerged as a major importer of seafood as raw material.133 In 2012, Thai seafood imports were valued around USD 3.3 billion (100 billion Baht).134 The Thai Frozen Foods Association (TFFA), established in 1968, now has a membership of more than 300 seafood processors and traders. The TFFA promotes the interests of the industry in the global market.135 TFFA membership is mandatory to gain access to international markets. The TFFA mission also includes setting 132 FAO 2014, supra note 1 at 49. 133 Id. 134 Intarakumnerd, supra note 16 at 273. 135 Seafish, “Focus on Ethical Issues in Seafood: Thailand Profile,” accessed on February 2, 2015, http:// www.seafish.org/media/Publications/ThailandEthicsPro- file_201509.pdf. direction for the industry and facilitating timely technological and organizational upgrades for improved competency.136 Thai seafood value chains Thai seafood value chains include small businesses, family-farms and very large vertically integrated firms such as the Charoen Pokphand Food Public Company. There are significant differences between value chains within Thailand. For instance, the Thai canned tuna industry is characterized by strong monitoring mechanisms and a high level of consolidation. There are only 18 players in the Thai canned tuna industry, all of which are members of the Thai Tuna Industry Association (TTIA). By contrast the Thai shrimp value chain is highly diverse with a range of players operating in different parts of the value chain.137 A comparative study of the Thai canned tuna and shrimp value chains conducted by the Asia Foundation and the ILO found that higher regulation in the Thai canned tuna value chain has improved quality, labour and environmental standards in processing. By contrast, the diversity of players in the Thai shrimp industry has made it more difficult to regulate. The following section will attempt to cover the range of work within these distinct value chains.138 136 Thai Frozen Foods Association (TFFA), “About Us: Mission, Vision,” accessed February 2, 2015, http://www. thai-frozen.or.th/aboutus_vision_mission.php. 137 Asia Foundation and International Labour Organ- ization (Asia Foundation-ILO), Migrant and Child Labour in Thailand’s Shrimp and Other Seafood Supply Chains (2015), 16. 138 Id. at 17 (value chain analysis of Thailand’s canned tuna and shrimp processing sectors included a desk review of literature relating to shrimp and seafood processing industries in Thailand and primary data collected through semi-structured interviews with key informants, including Sourcing and production: fishing and farming The Thai fishing fleet consists predominantly of bottom trawlers—boats known as the strip miners of the sea due to their use of nets weighted to sink to the ocean floor and snare anything in their path. The Thai fleet also includes purse seine boats139 that harvest fish closer to the surface of the water.140 According to UN estimates, the Thai fishing fleet faces an annual shortage of about 50,000 mariners. This shortfall is filled, in large part, by migrant workers from Cambodia and Myanmar who enter Thailand with irregular migration status. Some workers are as young as 15 years old. Migrant workers may be trafficked across borders and forced to work aboard ships. They typically do not speak the language of their Thai captains, do not know how to swim and are therefore entirely captive. 141 Undocumented migrant workers, sent to work on unregistered vessels, are outside the bounds of labour regulations.142 Due to overfishing and low fish stocks, boats stay further out and longer at sea. As a result, vessels elude regulatory oversight for extended periods of time. Some Thai fishing vessesl may go as far as Malaysian and Indonesian waters and stay out for up to a year at a time.143 top executives in Thai seafood companies and senior gov- ernment officials). 139 Purse seine boats are so named because after nets are hauled up, they are pinched at the top like old-style coin purses. 140 Urbina, supra note 130. 141 Id. 142 Id. 143 Verite, Recruitment Practices and Migrant Labor Conditions in Nestlés Thai Shrimp Supply Chain: An Examina- Figure 9: Map of Thailand Source: Google Maps
- 20. 38 39 Without oversight and access to relief, migrant workers forced to work on Thai fishing boats report extreme workplace violence and even murder. In a United Nations survey of 50 Cambodian men and boys sold to Thai fishing boats, 29 workers said they had witnessed their captain or other officers kill a worker. Other workers reported being beaten for small transgressions, from repairing a net too slowly to mistakenly sorting fish into the wrong bucket.144 To date, the Thai military and law enforcement have done little to counter misconduct on the high seas. Migrants also report government complicity in rights abuses—including being rescued by police from one smuggler only to be resold to another. However, in response to widespread reports of trafficking, forced labour and workplace violence aboard Thai fishing vessels, the Thai government says they have increased investigations and prosecutions and plan to continue doing so. The government also reports initiatives to provide identity cards to undocumented workers and establish centers for trafficking victims around the country.145 Shrimp farming: hatchery-based fry production and aquaculture In contrast to the wild fry collection that takes tion of Forced Labor and other Human Rights Risks Endemic to the Thai Seafood Sector, 2, accessed February 16, 2016, http://www.verite.org/sites/default/files/images/NestleRe- port-ThaiShrimp_prepared-by-Verite.pdf. 144 Urbina, supra note 130. 145 Id. place in Bangladesh, Thailand produces fry in more than 2,000 small-scale backyard hatcheries, mainly located in Chacehongsao, Chonburi and Phuket. These hatcheries produce 80 billion shrimp fry annually, or about 90 percent of Thailand’s total shrimp production. The Thai government has supported hatcheries by sharing technology directly with small hatchery operators. As a result of these initiatives, the share of farms using hatchery-raised fry rose exponentially from 3 percent in 2000 to 99 percent by 2008.146 The majority of shrimp aquaculture operations in Thailand are family-owned enterprises or small businesses with small land holdings. There are also, however, some large, vertically integrated conglomerates that include farms. For instance, the largest farmed shrimp producer in Thailand, Charoen Pokphand Food Public Company, is vertically integrated with feed manufacturers, brood stock farms, hatcheries, laboratory services, grow-out farms and processing plants.147 Compared to Bangladesh, local value chains in Thailand are much shorter. Shrimp farmers sell directly to seafood processers and export companies. Farmers sell the majority of shrimp through central shrimp markets that facilitate competitive auction prices for produce. The Samut Sakhon shrimp market is the largest in Thailand and functions as a site for consolidating shrimp shipments from the eastern and southern regions of Thailand for processing in the central region of the country.148 Seafood processing More than 90 percent of Thai exports are made- 146 Accenture, supra note 44, at 26. 147 Id. at 26-27. 148 Id. to-order products for foreign customers—also known as original equipment manufacturers (OEMs).149 The Thai industry has long produced for the chilled and frozen fish market segments. Within the last decade, Thailand has also emerged as the world’s largest producer and exporter of canned tuna and shrimp. Thailand is currently the top supplier of canned tuna in the world with a 53 percent share of the market.150 In 2013, export value of canned tuna alone was USD 2.5 billion. 151 Tuna processing includes loining (pressure cooking, removing skin and bones and cutting into loins); and canning (further fabricating loins and packing them in cans).152 Shrimp pre-processing includes removing heads, veins and hard shells of shrimps. Second stage processing, which takes place in large factories, includes cooking, breading and seasoning.153 These export market segments call for significant labour intensive, low technology seafood processing. 154 The majority of processing takes place in five major hubs: Nakhon Si Thammarat, Samut Prakarn, Samut Sakhon, Songkhla and Surat Thani.155 Migrant workers, mostly from Myanmar, form the majority of workers in the processing sector. For instance, the Thai shrimp industry alone employs 700,000 workers—80 percent of whom are migrant workers, mostly from Myanamar.156 149 Intarakumnerd, supra note 16 at 273. 150 Asia Foundation-ILO, supra note 137 at 15. 151 Intarakumnerd, supra note 16 at 273-74. 152 Asia Foundation-ILO, supra note 137 at 44. 153 Fairfood International, supra note 43 at 18. 154 Intarakumnerd, supra note 16 at 273-74. 155 Asia Foundation-ILO, supra note 137 at 26. 156 Id.at 15. Processing facilities As in India, the Thai seafood processing sector includes enterprises of various sizes and structures, including large firms, small and medium enterprises (SMEs) and micro enterprises. Many large firms have full or partial vertical integration, performing several activities in the value chain including farming, processing, marketing and distribution. This section describes the structure of the Thai seafood GVC beginning with large firms and descending down the value chain to cover small and medium enterprises and micro enterprises. Large firms Large processing companies within Thailand not only supply to supermarket and retail chains but have also expanded into retail and distribution. For instance, Thai Union Frozen has acquired leading US brands including Chicken of the Sea; and European brands, John West and Petit Navire. Other large processing firms include CP Group, Surapon Food, Pacific Fish Processing, S&P and Prantalay. In order to ensure high quality raw materials, large firms may have their own farms or fishing fleets. Others engage local boats in contract fishing. 157 Small and Medium Enterprises (SMEs) and Micro Processing Units A significant portion of Thai seafood processing takes place in SMEs and micro processing units. 157 Intarakumnerd, supra note 16 at 275.
- 21. 40 41 The crew on the Thai fishing ship included two dozen Cambodian boys, some as young as 15. Adam Dean for the New York Times
- 22. 42 43 For instance, a 2011-12 ILO-IPEC study of 512 processing facilities in the Samut Sakhon province found that in this seafood processing hub, 57 percent of processing took place in small (43 percent) and micro (14 percent) processing units.158 Medium enterprises, employing more than 26 workers, for the most part, process raw seafood material supplied by export oriented, large processing companies. The 2011-12 ILO-IPEC study in Samut Sakhon revealed that 90 percent of enterprises employing 50 or more workers process shrimp under sub-contracts from export-oriented factories. Small enterprises, employing up to 25 workers, frequently fill sub-contracts for medium and large enterprises.159 Micro processing units are mainly home-based enterprises employing 6 or fewer workers, including family members and a significant number of migrant workers. These units are also commonly referred to as peeling sheds with reference to the shrimp peeling and deveining activities carried out within. Production patterns within these units are irregular and contingent upon networks of intermediaries and supply fluctuations in the raw material market.160 As in Bangladesh and India, micro processing units exist largely outside the purview of regulation. Peeling sheds are highly informal. According to the TFFA, there are 97 peeling 158 International Labour Organization, Thailand’s Shrimp and Seafood Industry: An Overview of Primary Processing in Samut Sakhon Province (2012) (surveying 512 enterprises in 18 sub-districts of Samut Sakhon, interview- ing enterprise-level managers and conducting focus group discussions with community members, local and provincial officials and village and community leaders). 159 Id. 160 Accenture, supra note 44 at 27. sheds registered by the industry. An estimated 200 peeling sheds—including all 97 registered with the TFFA are registered with the Thailand Department of Fisheries (DOF). The TFFA, ILO and International Programme on Elimination of Child Labour (IPEC), however, estimate that there are at least an additional 400 unregistered sheds. The Labour Rights Promotion Network, a labour rights organization working in the Thai shrimp industry, estimates that the true number of micro processing facilities is closer to 2000. The ease with which peeling sheds can be relocated contributes to the difficulty in investigating and addressing exploitative labour practices. Since TFFA members are liable for the quality of shrimp, members heavily scrutinize pre-processed shrimp to ensure that they meet established standards. However, they do not investigate labour practices associated with peeling sheds.161 Working conditions and workforce demographics Particularly vulnerable workers, including the intersecting categories of migrant, female and child workers, make up a significant portion of the temporary workforce in the Thai seafood industry. An estimated 50,000 migrant workers from Cambodia and Myanmar are engaged in the Thai fishing fleet.162 90 percent of workers in pre-processing peeling sheds and processing factories are also migrants, including a high proportion of migrant workers from Myanmar. This concentration of migrant workers in fishing and processing has been attributed to preference 161 Id. at 27-28. 162 Urbina, supra note 130. among Thai people for work in other industries.163 Migrant workers may be as young as 15 years old. Many workers enter Thailand illegally and some are trafficked across borders. 164 Employment paths for migrant workers vary. Some cross the border on their own and pursue work in unregistered peeling sheds through personal networks of friends or relatives already in Thailand. Agents also approach and deceive workers about the nature of employment and persuade them to enter contractual agreements that result in labour bondage. Once a migrant worker enters Thailand illegally, they may be obligated to work for particular agents who contract them to peeling sheds or fishing vessels. Often workers take several months or even years to repay debts to employers or labour brokers.165 In a recent effort to address rights abuses in peeling sheds, Thai Union brought over 1000 workers from outside peeling sheds to work in its 163 Accenture, supra note 11 at 28. 164 Urbina, supra note 130. 165 Accenture, supra note 11 at 48. own plants in Samut Sakhon region. This initiative aims to improve working conditions by shortening the shrimp value chain and thereby increasing transparency around labour practices. These measures, however, can only succeed in improving labour standards if large exporters ensure that they offer in-house employment with term and conditions that meet international standards to those currently employed in subcontracted peeling sheds.166 The term precarious work refers to employment that is uncertain, unpredictable and risky from the perspective of the worker. As employers within seafood GVCs seek to easily adjust their workforce in response to supply and demand conditions, they generate more non-standard work. These forms of work shift risk from multinational buyers to suppliers. Suppliers, in turn, adjust to increased risk through precarious employment relationships 166 Undercurrent News, “Workers’ rights group: Thai seafood sector must focus on long-term reform,” Undercur- rent News, January 21, 2016, accessed February 21, 2016, https://www.undercurrentnews.com/2016/01/21/workers- rights-group-thai-seafood-sector-must-focus-on-long-term- reform/.
- 23. 44 45 Part 3Precarious work in the Asian seafood characterized by low wage, seasonal and temporary work. Proliferation of precarious work has a far-reaching impact upon the nature of work and workplaces and the gender-based distribution of work. Consequences of precarious work include greater economic inequality, insecurity and instability among workers. These forces have severe impacts on workers lives and their roles within their families and communities. 167 Outsourcing of production and processing activities in the seafood GVC has resulted in intensive labour exploitation and abuse of precarious workers in Asia, most of whom are migrant women from marginalized communities. Workers at the base of seafood value chains in Bangladesh, India and Thailand suffer non- enforcement of legal rights and violations of internationally recognized labour standards, including restricted freedom of association, low wages, gender discrimination, workplace violence, wage theft, child and forced labour and significant occupational safety and health risks. This section details rights violations in the seafood GVC in Bangladesh, India and Thailand. It draws upon evidence of rights violations documented in a range of studies as well as primary documentation of rights abuses faced by seafood processing workers in India, conducted by the Society for Labour and Development between 2012 and 2015, Human rights violations and violations of rights at work are articulated thematically in order to surface the pattern of rights violations across Bangladesh, India and Thailand. As the lex specialis or specialized law in this area, this study uses ILO labour standards protecting workers as a primary benchmark to identify rights violations. The iteration of these rights violations across 167 Arne L. Kalleberg, Precarious Work, Insecure Work: Employment Relations in Transition, 74 American Sociologi- cal Rev. (2009), 2. Asian countries testifies to the structural nature of these abuses, reproduced across contexts and integrally linked to the structure of the seafood GVC. Forced labour The ILO Forced Labour Convention, 1930 (No. 203) prohibits all forms of forced or compulsory labour, defined as all work or service that is exacted from any person under the menace of any penalty and for which the said person has not offered himself or herself voluntarily. The Protocol of 2014 to the Forced Labour Convention, 1930 and Forced Labour (Supplementary Measures) Recommendation, 2014 (No. 29) aim to advance prevention, protection and compensation measures and intensify efforts to eliminate contemporary forms of forced and bonded labour. Precarious workers in the Bangladesh and Thai seafood industries face forced labour in the form of coercive and deceptive recruitment and cycles of bonded labour in which they are tied to fishing and processing work by debt. Bangladesh Bonded labour is prevalent throughout the Bangladeshi shrimp industry. Fry collectors and shrimp farmers report regular debt bondage to intermediaries. Poor and marginalized fry collectors and farmers take conditional loans as supplementary income in the low season and for start up capital—including to buy the most basic tools of the trade such as nets for fry collection. Debts accrue interest and require fry collectors and small farmers to sell their produce at fixed prices to intermediaries. Fry collectors may never escape debt cycles and can spend most of their