Legal & Policy Issues for Managing Research Data
•
4 likes•35,650 views

This document discusses legal, ethical and policy issues related to managing research data. It defines key concepts like copyright, licenses and waivers, and explains why identifying ownership and control is important. Restrictions on data use and sharing are discussed, including protecting privacy and following regulations. Open licensing is presented as a way to facilitate sharing while still giving credit. The importance of behaving ethically and respecting licenses is emphasized.

Recommended
Recommended
More Related Content
What's hot
What's hot (20)
Viewers also liked
Viewers also liked (20)
Similar to Legal & Policy Issues for Managing Research Data
Similar to Legal & Policy Issues for Managing Research Data (20)
Recently uploaded
Recently uploaded (20)
Legal & Policy Issues for Managing Research Data
- 1. Legal & Policy Issues Photo Attribution:http://www.therealestatemedia.co m/wp-content/uploads/2012/05/real-estate- investment-scam.jpg
- 2. Learning Outcomes After completing this lesson, participants will be able to: ▶ Identify ethical, legal, and policy issues for managing research data ▶ Define copyrights, licenses and waivers ▶ Understand reasons behind data restrictions and how to observe them ▶ Discuss ethical considerations surrounding the use of research data
- 3. Setting the Stage ▶ Legal – a law is “any written or positive rule or collection of rules prescribed under the authority of the state or nation.” ● e.g., U.S. Copyright Act ▶ Ethical – “being in accordance with the rules or standards for right conduct or practice, especially the standards of a profession.” ● e.g., IRB & IACUC ▶ Policy - a specified “course of action adopted for the sake of expediency, facility, etc.” ● e.g., Paperwork Reduction Act - Definitions from Dictionary.com
- 4. Intellectual Property (IP) “Intellectual property refers to creations of the mind, such as inventions; literary and artistic works; designs; and symbols, names and images used in commerce.” -World Intellectual Property Organization Photo Attribution: https://theforevergreenstateofmind.files.wordpress.com/2012/07/lightbulb3.png
- 5. What does IP include? ▶Copyright ▶Patents ▶Trademarks ▶Industrial Designs Photo Attribution: http://ecx.images-amazon.com/images/I/41DS66B06KL.jpg
- 6. Who might claim control over data? ▶ You ▶ A funder ▶ Student, scientist, researcher, PI ▶ An institution ▶ A private company ▶ Nobody Photo Attribution: http://www.ihomepm.com/wp- content/uploads/2015/05/727453_10231848.jpg
- 7. Identifying Ownership and Control ▶ Funder agreement ▶ Institutional intellectual property policy ▶ Private company data use agreement ▶ Attached license Photo Attribution: http://cdn.gobankingrates.com/wp- content/uploads/nashville-housing-market-overview-300x238.jpg
- 8. Why Does Ownership & Control Matter? ▶ For Creators ● to derive benefit as a result of their work ▶ For others ● To avoid potential legal trouble ● To know where to get permission for use. Photo Attribution: Attention By Viktor Vorobyev at the Noun Project
- 9. Copyright versus License ▶ Copyright: “ [T]he body of exclusive rights granted by law to copyright owners for protection of their work.” (U.S. Copyright Office) ● Facts and data* cannot be protected by copyright ● Metadata and data arrangement can be protected (sometimes) ▶ License: States what can be done with the data and how that data can be redistributed (e.g., GPL and CC) ▶ Waiver: (e.g., CC0) relinquishes all rights of ownership or control and usually commits the “work” to the public domain ▶ Intellectual property laws will vary depending upon country or region
- 10. Fact and Copyright ▶ Facts cannot be protected by copyright, but what is a fact? ▶ Current case law determines the limits. ● Feist Publications, Inc. vs. Rural Telephone Service Co. ● Baker v. Seldon ● Miller v. Universal Studios Photo Attribution: http://www.romakerlaw.com/blog/wp-content/uploads/2015/07/doctelportal.jpg
- 11. Choosing an open license ▶ Why use an open license? ● Facilitate data sharing and discovery ● Increase visibility of your data ● Advance knowledge ▶ Creative Commons ● CC0 (not a license, but a waiver) ● CC BY (Attribution) ● CC BY-ND (Attribution-NoDerivs) ● CC BY-NC (Attribution-NonCommercial) ● CC BY-SA (Attribution-ShareAlike)
- 12. Other Considerations ▶ Copyright vs. Copyleft ● “a strategy of utilizing copyright law to pursue the policy goal of fostering and encouraging the equal and inalienable right to copy, share, modify and improve creative works of authorship.” (copyleft.org) ▶ Attribution Stacking ● CC BY requires all derivative works to acknowledge all contributors to all works from which they are derived. ▶ Redistribution ● CC BY-SA requires all works that derive from a work designated BY-SA must be distributed under the same license.
- 13. Norms for Data Use ▶ When using data ◦ Give credit to the data authors ◦ Be responsible with the data ◦ Share what you learned ◦ Respect the Data License or Waiver ◦ Understand and follow any restrictions or regulations Photo Attribution: http://soctheory.iheartsociology.com/wp- content/uploads/2011/10/IMG02369-20111028-1602.jpg
- 14. Ethical Use of Data ▶ Before you share your data ◦ Understand your funder/institution policies on data sharing ◦ Review your IRB protocols and approvals ◦ Remove personal data ▶ Using someone else’s data ◦ Give credit ◦ Respect the license ◦ Protect the data appropriately Photo Attribution: https://www.flickr.com/photos/michaelgallagher/14592386702/
- 15. Why might data use or sharing be restricted? ▶ Threatened and endangered species ▶ National security and classified research ▶ Export controls ◦ Can apply to technologies and data ▶ Use of Human Subjects ◦ Personally identifiable information of any kind ● E.g., HIPAA as governing law for personal health information Photo Attribution: https://www.iconfinder.com/icons/40968/folder_red_restri cted_icon
- 16. Be Aware of Regulations ▶ Range of regulations mediating how researchers interact with data or objects of data collection (e.g., humans, animals; consult IRB or IACUC) ▶ Constraints around data management (e.g., cloud services, software agreements, etc.) ▶ Institutional policy review processes (e.g. Paperwork Reduction Act) ▶ Open vs. proprietary – some institutions (e.g., universities) may need to waive rights to permit open access.
- 17. Privacy and Security ● What we can collect and how ● How we share data, results and outcomes ● Reuse of human subject data ● Data storage and destruction ● IRB interpretations and review across institutions are not always consistent Photo Attribution: http://www.charlottecriminallawyer- blog.com/files/2013/12/Surveillance-Camera.jpg
- 18. Privacy vs. Confidentiality ▶ Privacy ● Protects access to individuals (or entities) ▶ Confidentiality ● Protects access to information about individuals ● Can be thought of as information privacy
- 19. Summary ▶ Know who can claim ownership or control over data products ▶ Assign licenses or waivers appropriately ▶ Behave ethically and in accordance with established community norms ▶ Respect the licenses or waivers assigned ▶ Protect privacy and confidentiality ▶ Know what restrictions and liabilities apply to products and processes
- 20. Resources 1. Frequently asked questions about PRA / Information Collection. Accessed June 26, 2015 at http://www.hhs.gov/ocio/policy/collection/infocollectfaq.html. 2. Creative Commons. Accessed June 26, 2015 at https://creativecommons.org. 3. Norms for data use and publication. Accessed June 26, 2015 at http://www.Vertnet.org/resources/norms.html. 4. Export controls. Accessed June 26, 2015 at http://vcresearch.berkeley.edu/export-controls. 5. Protected groups. Accessed June 26, 2015 at http://www.uidaho.edu/ora/committees/irb/protectedgroups. 6. Health information privacy. Accessed June 26, 2015 at http://www.hhs.gov/ocr/privacy. 7. Protecting personal health information in research: understanding the HIPAA privacy rule. Accessed June 26, 2015 athttp://privacyruleandresearch.nih.gov/pr_02.asp. 8. Information Liability. Accessed June 26, 2015 at http://www.law.fsu.edu/journals/lawreview/downloads/263/phil.pdf. 9. Guidelines for Responsible Data Management in Scientific Research. Accessed June 26, 2015 at http://ori.hhs.gov/education/products/clinicaltools/data.pdf 10. Who Owns Research Data? Accessed June 26, 2015 at http://ori.dhhs.gov/education/products/columbia_wbt/rcr_data/case/index.html#2 11. Constructing Access Permissions. Accessed June 26, 2015 at http://libweb.uoregon.edu/datamanagement/sharingdata.html#three
Editor's Notes
- This dataONE data management education tutorial will cover data analysis, including workflows and other tools.
- The topics covered in this tutorial will include a review of typical data analyses, reproducibility, provenance,workflows in general, and both informal and formal workflows
- After completing this lesson you will be able to understand a subset of typical analyses used by ecologists and environmental scientists. You will be able to define a workflow and understand the basic concepts of both formal and informal workflows. Lastly you will able to discuss the benefits of using a workflow.
- In this tutorial we will be focusing on data analysis which appears here in the data life cycle. Analysis can be performed on original data collected by a researcher, or on data ‘discovered’ in data repositories and integrated.
- The types of analyses, software, and hardware used by ecologists and environmental scientists vary widely. Personal computers are commonly used to perform these analyses. Other computational tools are grid and cloud computing.Grid computing integrates large-scale resources such as computational devices, data applications, and scientific instruments to understand and explore research questions efficiently. It is also commonly used to share, manage, and process large datasets in physics, geophysics, astronomy, and bioinformatics. Cloud computing is location-independent computing, whereby shared servers provide resources, software, and data to a various number of external computers located elsewhere. Examples of data analyses that might be used with any of these computational tools are statistics, model runs and simulations, parameter estimations, plotting of spatial data, or visualizations such as graphs. The types of analyses vary widely both among and within scientific areas of study.
- Typically the first step in any data analysis is processing the data. Processing can include selecting a subset of the data for analysis, merging multiple datasets, or manipulating the data so it is more useable by a researcher or a computer program. A common requirement for large datasets is to reduce the amount of data in the working data file. This makes computing and handling of the dataset easier. For example, a sensor might take a temperature measurement every 5 seconds for one year. For the study, only monthly patterns are important. We might therefore only use one data point for every 5 minutes. Data will also need to be transformed before use. This might involve the conversion of data to common units, normalization of data collected by multiple people and instruments, or developing algorithms for converting raw data into meaningful values. An example of data transformation is shown here, the relatively meaningless string of numbers on the left, which were raw output from a sensor, can be transformed into the table on the right, which is more understandable for humans.
- Another way to analyze data is by visually representing it. Numbers in charts can be difficult to interpret but patterns can be readily apparent in a few well-chosen graphs or other visual representations. Examples of different types of plots are scatter plots and Box-and-whisker plots, which show the statistical distribution of data. On the left is a scatter plot of temperatures for the month of August. The general pattern is easily discernable, and particularly warm measurements are readily apparent. On the right is a box-and whisker plot of monthly temperatures. The boxes indicate averages, and measurements far from the averages are visible as red dots outside of the error bars. Plots can be used to assure the quality of data as well. They can quickly show you potential data errors such as impossible values.
- Statistics are among the most common types of analyses performed on data. There are many different types of statistical analyses, only a few of which we show here. Conventional statistics are often used to understand experimental data. The most common types are analysis of variance (ANOVA), multivariate analysis of variance (MANOVA), and regressions. Conventional statistics tend to rely on assumptions such as random error and homogeneous variance. Descriptive statistics are traditionally applied to observational or descriptive data. Descriptive data might include the distribution of organisms in space, species-abundance relationships, inter-specific associations, community structure, similarity or dissimilarity, and community-habitat relationships. Statistics used to understand these types of data include diversity indices, cluster analysis, and principle components analysis, among many others.
- Statistical analyses might also include temporal or spatial analyses, and nonparametric approaches which do not rely on specific assumptions about the data’s distribution, and many other types of analysis, including risk assessment and GLM’s. Analyzing very large datasets requires special considerations. The process can often be broken into two steps. The first involves discovering and mining for the data of interest. This is typically done via computers and involves pattern searching and the use of decision trees.The second step involves online data processing. Large datasets can be analyzed using high-performance computing systems such as cloud computing.
- The process is often modified based on analyses and re-run with small (or large) changes. Science is inherently an iterative process. We run analyses, modify hypotheses, and re-run analyses. This can result in a complex process that results in the final product.Based on results from preliminary analysis, a researcher will often re-run or re-analyze the data or outputs. Visualizations created to display results might include charts, graphs, simulations, or other outputs. Remember that science is an inherently iterative process. We run analyses, modify hypotheses, and re-run analyses. This can result in a complex process that results in the final product.
- Reproducibility is at the core of scientific method. If results are not reproducible, the study loses credibility. The complex processes used to create final outputs can be quite difficult to reproduce. In order to maintain scientific integrity, good documentation of the data and the analytical process is essential. Documentation includes metadata, which is data about data, and process metadata, which is data about the process.
- Process metadata is information about the process used to create any data outputs. This includes any data cleaning, transformation, reduction, and any analyses performed. A related concept to process metadata is “data provenance”. Provenance means “origin”, so data provenance is a description of the origins of the data. A mark of good provenance is that a person not directly involved with the project is able to follow the data through its life cycle and understand any steps used to create outputs. Good provenance allows for the ability to replicate analyses and reproduce results. Others can identify potential problems, logical, or statistical errors that might affect the study’s outcome. Others are also able to evaluate a study’s hypotheses for themselves. All of these possibilities mean greater accountability and more trustworthy science.
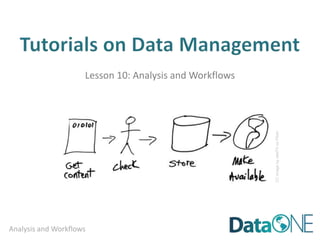
- A workflow is a formalization of the process metadata. Workflows are commonly used in other fields, including business. In general, a “workflow” is a precise description of the procedures used in a project. It is a conceptualized series of data ingestion, transformation, and analytical steps. A workflow consists of three components. First, there are inputs that contain the information required for the process, for example the raw data. Second the output is information or materials produced, such as final plots of the data. Third, there are transformation rules, algorithms, or analyses that are required to create the outputs from the inputs.
- Mention that example workflow diagrams shown here were drawn freehand in PowerPoint using default flowchart symbology – no specialized software necessary!
- This is an example of a simple conceptual workflow. Here we focus first on the analytical steps used to create outputs from the data. In the first step the data are imported into a scripted program, R, for cleaning and analysis.The data then go through a quality control and cleaning process to identify outliers, remove erroneous data, and identify any missing data.The data are then analyzed to generate mean temperature and salinity for the location, as well as error envelopes for the data. Finally, graphs are produced to display the resulting mean temperatures.
- These steps are known in workflows as “transformation rules”.Transformation rules describe what is done to/with the data to obtain the relevant outputs for publication.
- Now we focus on the actual data. The Inputs & outputs of this workflow are shown here in red. The first inputs are the raw temperature & salinity data. These are imported into R.The output of this process is the data in R format. That data in R format then become the input for the quality control and data cleaning step. The output of this step is “clean” temperature and salinity data, which is then the input for the analysis step.The output of the analysis step is the summary statistics, such as mean and standard deviation by month. These are subsequently the inputs for the visualization step.
- Formal Scientific workflow systems are now in development to help scientists document their workflows. These analytical pipelines will make it possible for lay scientists to use workflows effectively for documenting their process metadata. Each step within the scientific workflow system can be implemented using different software systems. In the process of performing analyses, each step and its parameters and requirements are formally recorded. This allows both the individual steps and the overall workflow to be reused, either by the original scientist or someone else.
- There are many benefits of using scientific workflows. First, they can provide a single access point for multiple analyses across software packages. Second they allow a researcher to keep track of analyses conducted, which enables reproducibility. Third, workflows can be stored as documentation of the research project. A stored workflow is essentially higher-level metadata which offers tremendous potential for scientific advancement.Finally, workflows allow researchers to share and reuse the workflow or its components. This means less time doing repetitive tasks, allows for collaboration across disciplines, and rapid analysis since time is not spent “reinventing the wheel”.
- One example of a scientific workflow software program is Kepler. Kepler is an open-source and free cross-platform program. Cross-platform means it can work with any operating system. Kepler uses a drag-and-drop interface for scientists to construct their workflow. Steps in the analytical process are represented by an “actor”. These actors then connected to form a workflow. Possible applications of Kepler are listed here.
- Here is a screenshot of the Kepler interface. It has a user-friendly GUI (pronounced gooey) or graphical user interface.The list of possible actors is searchable, and you can drag and drop the actors into the workflow creation space to the right.Actors are connected via inputs and outputs represented by black lines.
- This example workflow solves two coupled equations, one for the predator population, and one for the prey population. The solutions to the equations are then routed to the “Timed plotter” and “XY plotter” in the top of the panel. The text describes what this workflow is calculating.
- The resulting outputs from this workflow are plots of the predator and prey populations. Kepler and other scientific workflow tools are being developed for use by ecologists and environmental scientists who may not be comfortable creating scripted workflows using the command line.Along with scientific workflows, tools are being developed to facilitate their use, such as VisTrails.
- VisTrails is another example of an open source workflow tool that provides provenance and management support. It is geared toward VisTrails is an open source workflow tool that provides provenance and management support. It is geared toward exploratory and computational tasks.Using Vistrails, scientists can manage evolving scientific workflows and maintain detailed history about the steps taken and the data consumed and produced.
- Workflows are beneficial because they document the exact process used to create data outputs. This is especially true with the advent of more computationally intensive processes due to sensor networks, complex statistical programs, and integration of many types of data in a single study.One of the major advantages of workflows is they allow the analytical process to be shared with other scientists. This would be easier to accomplish if there was a formal way of creating and saving workflows.There are now scientific workflow systems in development that will make documenting workflows easier. This will also increase the ability to share workflows with others. The simplest form of a scientific workflow is using scripts to document the process of analysis. This is done often using scripted programs such as R or Matlab, or if multiple software packages are used, via the command line using programming languages such as Java, Python, or Perl. However executing codes and analyses via the command line is beyond the expertise of many ecological and environmental scientists.
- Best practices for data analysis should involve the documentation of workflows, either conceptual or formal, to show how results were obtained. This includes data provenance, analyses used, parameters used, and connections between analyses via inputs and outputs. This documentation can be informal, like in a flowchart, or more formal, such as Kepler or vistrails.
- In summary, modern science is becoming more and more computationally-intensive, and scientists are working with heterogeneous data, analyses, and software. Reproducibility is more important than ever given this environment.Workflows are equivalent to process metadata, also known as provenance.Using both informal and formal workflowsand are necessary for reproducibility, repeatability, and validation of your research.