SlideShare a Scribd company logo
1 of 2
LIST OF TABLES
Table 1.1: Estimated transfer rates for N, P, K, Ca and Mg in
plantations of P. taeda at the age of 16 years (modified
after Pritchett and Fisher,1987).........................................................10
Table 1.2: Annual and total uptake of nutrients, and removal by
harvesting (Switzer and Nelson, 1972; Khanna and Ulrich,
1984; Miller, 1984; Pritchett and Fisher, 1987). ...............................11
Table 1.3 : The relative contribution of nutrient sources to a 20th
year
requirement of a P. taeda plantation ecosystem (Switzer
and Nelson, 1972).............................................................................12
Table 2.1: Temperatures and rainfall for the period of 1961-1990
(C.S.S., 1996)....................................................................................19
Table 2.2: Site description - Rhenosterhoek forest area....................................24
Table 2.3: Site description - Mauchsberg forest area.........................................25
Table 3.1: Analytical data for the soil collection..................................................32
Table 4.1: Chemical composition of saturated paste extracts. Ion
concentrations are in mg/l, EC levels are in S/cm and pH
levels are of the saturated paste prior to extraction..........................45
Table 4.2: Percent (%) distribution of aluminium species in solution
calculated by MINTEQA2 in the presence of DOC and F.................52
Table 4.3: Percent (%) distribution of aluminium species in solution
calculated by MINTEQA2 in the absence of DOC and F..................53
Table A.1: Soil profile description for two selected pits in P. patula
plantations in the Rhenosterhoek area (S.A.F.I, 1957) .......................V
Table B.1: Trace element composition of the soil solution (saturated
paste extracts) from 22 surface soils under pine plantations
of different ages in the Sabie area, Mpumalanga.
Concentrations are reported in g/l.....................................................XII
Table C.1: Data summary of duplicate pH measurements in
saturated pastes, prior to extraction.................................................XIV
Table C.2: Duplicate electrical conductivity readings for 11 saturated
1
paste extracts from surface soils under pine plantations of
different ages in the Sabie area, Mpumalanga................................XVI
Table C.3: Results of four duplicate analysis and three standards of
exchangeable cations determined by FAAS..................................XVIII
Table C.4: pH readings for the determination of ANC from 22 surface
soils under pine plantations of different ages in the Sabie
area, Mpumalanga..........................................................................XIX
Table C.5: Precision and data reproducibility for four soil solutions
(saturated paste extracts) and standards determined for
major ion concentration by IC............................................................XX
Table C.6: Trace element concentrations and precision analysis of
two standards determined by ICP-MS, prior to trace
element analysis of soil solutions....................................................XXI
Table C.7: Precision and data reproducibility of three soil solutions
(saturated paste extracts) determined for selected trace
element concentrations by ICP-MS. Results are reported
in g/l..............................................................................................XXII
Table C.8: Analytical precision of Al determined colorimetrically
according to the method of Kennedy and Powell (1986),
for seven soil solutions (saturated paste extracts) of
surface soils under pine plantations of different ages
in the Sabie area, Mpumalanga.....................................................XXIII
Table C.9: Analysis precision of Si determined colorimetrically
according to the method of Eaton et al. (1995), for six
soil solutions (saturated paste extracts) of surface soils
under pine plantations of different ages in the Sabie area,
Mpumalanga..................................................................................XXIV
2

More Related Content

Similar to Nutrient Uptake Tables

1987 army-corps-wetlands-delineation-manual
1987 army-corps-wetlands-delineation-manual1987 army-corps-wetlands-delineation-manual
1987 army-corps-wetlands-delineation-manualJA Larson
 
Ab undergraduate thesis_final
Ab undergraduate thesis_finalAb undergraduate thesis_final
Ab undergraduate thesis_finalAmber Brant
 
final report consultancies trifinio(en)
final report consultancies trifinio(en)final report consultancies trifinio(en)
final report consultancies trifinio(en)groundwatercop
 
SRBC Report: Water Use Associated with Natural Gas Development
SRBC Report: Water Use Associated with Natural Gas DevelopmentSRBC Report: Water Use Associated with Natural Gas Development
SRBC Report: Water Use Associated with Natural Gas DevelopmentMarcellus Drilling News
 
RPF_MERLEVEDE_Msc_Research
RPF_MERLEVEDE_Msc_ResearchRPF_MERLEVEDE_Msc_Research
RPF_MERLEVEDE_Msc_ResearchRomain Merlevede
 
Full manuscript de asis zubiaga_phytoplankton
Full manuscript de asis zubiaga_phytoplanktonFull manuscript de asis zubiaga_phytoplankton
Full manuscript de asis zubiaga_phytoplanktonJahzeel Zubiaga
 
OFAH + Conservation Halton_urban-creeks-2008
OFAH + Conservation Halton_urban-creeks-2008OFAH + Conservation Halton_urban-creeks-2008
OFAH + Conservation Halton_urban-creeks-2008Mhat Briehl
 
TA-8111 PH - Revised Road Map_CLEANED
TA-8111 PH - Revised Road Map_CLEANEDTA-8111 PH - Revised Road Map_CLEANED
TA-8111 PH - Revised Road Map_CLEANEDElmer Mercado
 

Similar to Nutrient Uptake Tables (11)

LOF.RTF
LOF.RTFLOF.RTF
LOF.RTF
 
1987 army-corps-wetlands-delineation-manual
1987 army-corps-wetlands-delineation-manual1987 army-corps-wetlands-delineation-manual
1987 army-corps-wetlands-delineation-manual
 
Ab undergraduate thesis_final
Ab undergraduate thesis_finalAb undergraduate thesis_final
Ab undergraduate thesis_final
 
final report consultancies trifinio(en)
final report consultancies trifinio(en)final report consultancies trifinio(en)
final report consultancies trifinio(en)
 
SRBC Report: Water Use Associated with Natural Gas Development
SRBC Report: Water Use Associated with Natural Gas DevelopmentSRBC Report: Water Use Associated with Natural Gas Development
SRBC Report: Water Use Associated with Natural Gas Development
 
air2012
air2012air2012
air2012
 
3445602768057
34456027680573445602768057
3445602768057
 
RPF_MERLEVEDE_Msc_Research
RPF_MERLEVEDE_Msc_ResearchRPF_MERLEVEDE_Msc_Research
RPF_MERLEVEDE_Msc_Research
 
Full manuscript de asis zubiaga_phytoplankton
Full manuscript de asis zubiaga_phytoplanktonFull manuscript de asis zubiaga_phytoplankton
Full manuscript de asis zubiaga_phytoplankton
 
OFAH + Conservation Halton_urban-creeks-2008
OFAH + Conservation Halton_urban-creeks-2008OFAH + Conservation Halton_urban-creeks-2008
OFAH + Conservation Halton_urban-creeks-2008
 
TA-8111 PH - Revised Road Map_CLEANED
TA-8111 PH - Revised Road Map_CLEANEDTA-8111 PH - Revised Road Map_CLEANED
TA-8111 PH - Revised Road Map_CLEANED
 

More from David Sugarman (20)

HLS cctv safe city / Transportation report david sugarman
HLS cctv safe city / Transportation report david sugarman HLS cctv safe city / Transportation report david sugarman
HLS cctv safe city / Transportation report david sugarman
 
Cv david sugarman
Cv david sugarman Cv david sugarman
Cv david sugarman
 
TABLE3-1.RTF
TABLE3-1.RTFTABLE3-1.RTF
TABLE3-1.RTF
 
TOC.RTF
TOC.RTFTOC.RTF
TOC.RTF
 
REFERENC.RTF
REFERENC.RTFREFERENC.RTF
REFERENC.RTF
 
CHAPTER5.DOC
CHAPTER5.DOCCHAPTER5.DOC
CHAPTER5.DOC
 
CHAPTER4.DOC
CHAPTER4.DOCCHAPTER4.DOC
CHAPTER4.DOC
 
CHAPTER3.DOC
CHAPTER3.DOCCHAPTER3.DOC
CHAPTER3.DOC
 
CHAPTER2
CHAPTER2CHAPTER2
CHAPTER2
 
INTRODUC.RTF
INTRODUC.RTFINTRODUC.RTF
INTRODUC.RTF
 
TITLE.RTF
TITLE.RTFTITLE.RTF
TITLE.RTF
 
ACKNOWLE.RTF
ACKNOWLE.RTFACKNOWLE.RTF
ACKNOWLE.RTF
 
ABSTRACT.RTF
ABSTRACT.RTFABSTRACT.RTF
ABSTRACT.RTF
 
Ace.Final Presentation.Team7
Ace.Final Presentation.Team7Ace.Final Presentation.Team7
Ace.Final Presentation.Team7
 
About us and about you
About us and about youAbout us and about you
About us and about you
 
mdlog.PPT
mdlog.PPTmdlog.PPT
mdlog.PPT
 
אורקל חדש
אורקל חדשאורקל חדש
אורקל חדש
 
JWP
JWPJWP
JWP
 
CellNets MTN
CellNets MTNCellNets MTN
CellNets MTN
 
CellNets Vodacom
CellNets VodacomCellNets Vodacom
CellNets Vodacom
 

Nutrient Uptake Tables

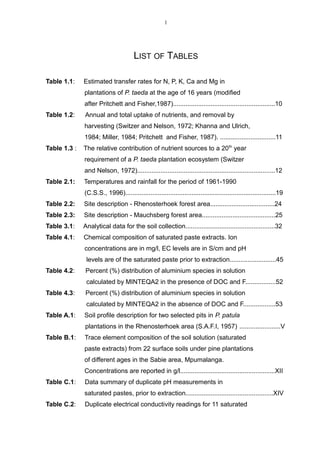
  • 1. LIST OF TABLES Table 1.1: Estimated transfer rates for N, P, K, Ca and Mg in plantations of P. taeda at the age of 16 years (modified after Pritchett and Fisher,1987).........................................................10 Table 1.2: Annual and total uptake of nutrients, and removal by harvesting (Switzer and Nelson, 1972; Khanna and Ulrich, 1984; Miller, 1984; Pritchett and Fisher, 1987). ...............................11 Table 1.3 : The relative contribution of nutrient sources to a 20th year requirement of a P. taeda plantation ecosystem (Switzer and Nelson, 1972).............................................................................12 Table 2.1: Temperatures and rainfall for the period of 1961-1990 (C.S.S., 1996)....................................................................................19 Table 2.2: Site description - Rhenosterhoek forest area....................................24 Table 2.3: Site description - Mauchsberg forest area.........................................25 Table 3.1: Analytical data for the soil collection..................................................32 Table 4.1: Chemical composition of saturated paste extracts. Ion concentrations are in mg/l, EC levels are in S/cm and pH levels are of the saturated paste prior to extraction..........................45 Table 4.2: Percent (%) distribution of aluminium species in solution calculated by MINTEQA2 in the presence of DOC and F.................52 Table 4.3: Percent (%) distribution of aluminium species in solution calculated by MINTEQA2 in the absence of DOC and F..................53 Table A.1: Soil profile description for two selected pits in P. patula plantations in the Rhenosterhoek area (S.A.F.I, 1957) .......................V Table B.1: Trace element composition of the soil solution (saturated paste extracts) from 22 surface soils under pine plantations of different ages in the Sabie area, Mpumalanga. Concentrations are reported in g/l.....................................................XII Table C.1: Data summary of duplicate pH measurements in saturated pastes, prior to extraction.................................................XIV Table C.2: Duplicate electrical conductivity readings for 11 saturated 1
  • 2. paste extracts from surface soils under pine plantations of different ages in the Sabie area, Mpumalanga................................XVI Table C.3: Results of four duplicate analysis and three standards of exchangeable cations determined by FAAS..................................XVIII Table C.4: pH readings for the determination of ANC from 22 surface soils under pine plantations of different ages in the Sabie area, Mpumalanga..........................................................................XIX Table C.5: Precision and data reproducibility for four soil solutions (saturated paste extracts) and standards determined for major ion concentration by IC............................................................XX Table C.6: Trace element concentrations and precision analysis of two standards determined by ICP-MS, prior to trace element analysis of soil solutions....................................................XXI Table C.7: Precision and data reproducibility of three soil solutions (saturated paste extracts) determined for selected trace element concentrations by ICP-MS. Results are reported in g/l..............................................................................................XXII Table C.8: Analytical precision of Al determined colorimetrically according to the method of Kennedy and Powell (1986), for seven soil solutions (saturated paste extracts) of surface soils under pine plantations of different ages in the Sabie area, Mpumalanga.....................................................XXIII Table C.9: Analysis precision of Si determined colorimetrically according to the method of Eaton et al. (1995), for six soil solutions (saturated paste extracts) of surface soils under pine plantations of different ages in the Sabie area, Mpumalanga..................................................................................XXIV 2