Preliminary summary for wetland restoration project. Short-term (~1 year) freshwater restoration lowered salinity and phosphorus (P) concentrations in porewater of the saltwater and saltwater+P treatments. Legacy effects of salt and P remained and continued to stimulate aboveground marsh growth. The enhanced marsh growth was likely caused by rapid recycling of nutrients stored in sawgrass litter. Net ecosystem metabolism is used a proxy for ecosystem balance and suggests that saltwater intrusion in Florida Everglades can disrupt carbon cycling. Everglades wetland will be more vulnerable to sea-level rise due to accelerated soil carbon loss.
Module for Grade 9 for Asynchronous/Distance learning
Effects of freshwater restoration on carbon cycling in wetlands with salt and phosphorus legacies
1. Will freshwater restoration offset peat collapse in wetlands
with salt and phosphorus legacies?
Dong Yoon Lee1, Benjamin Wilson1, Shelby Servais1, Sean Charles1, Viviana Mazzei1, Steve Davis2, Tiffany Troxler1, Evelyn Gaiser1, John Kominoski1
1Florida International University & Florida Coastal Everglades Long-Term Ecological Research and 2Everglades Foundation
Introduction
Rising sea levels and reduced freshwater flows increase marine
transgression of salt and phosphorus (P) in the Florida Coastal
Everglades (FCE) (Fig. 1). Many FCE studies have found that
continuous exposure (>2 years) of sawgrass-peat cores to elevated
saltwater and P can shift ecosystem carbon balance and cause
peat collapse that were mostly driven by reduced marsh root
growth, enhanced soil decomposition, and loss of soil structural
integrity. To prevent peat collapse and other environmental
degradations, large efforts to increase freshwater flows to
premanaged conditions have been made in the South Florida.
Methods
We tested effects of legacy salt and P exposure in sawgrass-peat
cores that had been augmented with high salinity (~10 ppt) and
P (0.45 mg P d-1) concentrations for two years. Since February
2017, we have added only freshwater without P to simulate
freshwater recovery, and measured:
• marsh biomass
• porewater chemistry
• litter breakdown rates
• water column respiration rates
• ecosystem metabolism
Questions
1) How does prior exposure of freshwater
sawgrass marsh plants and peat soils to
elevated salinity and P influence their
responses to freshwater restoration?
2) How do metabolic rates of marsh, water,
and soil (ecosystem) change with the
restoration?
3) Can freshwater restoration offset peat
collapse and increase soil elevation?
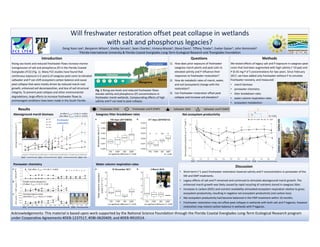
Fig. 1 Rising sea levels and reduced freshwater flows
elevate salinity and phosphorus (P) concentrations in
freshwater marsh wetlands. Compounding effects of high
salinity and P can lead to peat collapse.
Discussion
• Short-term (~1 year) freshwater restoration lowered salinity and P concentrations in porewater of the
SW and SWP treatments.
• Legacy effects of salt and P remained and continued to stimulate aboveground marsh growth. The
enhanced marsh growth was likely caused by rapid recycling of nutrients stored in sawgrass litter.
• Increases in carbon (DOC) and nutrient availability stimulated ecosystem respiration relative to gross
ecosystem productivity, resulting in negative net ecosystem productivity (net carbon loss).
• Net ecosystem productivity had become balanced in the FWP treatment within 10 months.
• Freshwater restoration may not offset peat collapse in wetlands with both salt and P legacies, however
restoration may restore carbon balance in wetlands with P legacies.
Results Freshwater (FW) Freshwater and P (FWP) Saltwater (SW) Saltwater and P (SWP)
Aboveground marsh biomass
2017 20182015 2016
Freshwater
restoration
Water column respiration rates
(no significant difference; P > 0.05)(no significant difference; P > 0.05)
Net ecosystem productivity
2017 2018
CarbonsinkCarbonsource
Porewater chemistry
2017 2018
Dissolved organic carbon
(Salt effect: F(1,21) = 44.21, P < 0.001)
Soluble reactive phosphorus
(P effect: F(1,21) = 1.72, P = 0.20)
*
+
☨
+☨ +☨ +☨ *+
+☨ +
+☨
+☨
+
(P < 0.05)
Sawgrass litter breakdown rates
ba,baa
(no significant difference; P > 0.05) (P < 0.05)
(P effect: F(1,21) = 27.83, P < 0.001)
(Salt effect: F(1,21) = 3.52, P = 0.075)
(Salt effect: F(1,21) = 217.59, P < 0.001)
Acknowledgements: This material is based upon work supported by the National Science Foundation through the Florida Coastal Everglades Long-Term Ecological Research program
under Cooperative Agreements #DEB-1237517, #DBI-0620409, and #DEB-9910514.