Effect of flour processing on soy-based beverage quality
•
1 j'aime•55 vues

Effect of flour processing on soy beverage

Recommandé
Recommandé
Contenu connexe
Tendances
Tendances (20)
En vedette
En vedette (18)
Similaire à Effect of flour processing on soy-based beverage quality
Similaire à Effect of flour processing on soy-based beverage quality (20)
Plus de Dr Asif Ahmad
Plus de Dr Asif Ahmad (15)
Dernier
Dernier (20)
Effect of flour processing on soy-based beverage quality
- 1. Effect of flour processing on the quality characteristics of a soy-based beverage SARA ARIF1 , ASIF AHMAD1 , TARIQ MASUD1 , NAUMAN KHALID2 , IMRAN HAYAT3 , FARZANA SIDDIQUE1 , & MUHAMMAD ALI1 1 Department of Food Technology, PMAS-Arid Agricultural University, Rawalpindi, Pakistan, 2 Department of Global Agricultural, Graduate School of Agricultural and Life Sciences, University of Tokyo, 1-1-1 Yayoi, Bunkyo-ku, Tokyo, Japan, and 3 Faculty of Agricultural, Azad Jammu & Kashmir University, Rawalakot, Pakistan Abstract Four treatments (roasting, germination, autoclaving and an application of 0.5% EDTA þ 0.5% sodium hydroxide) were used to reduce the beany flavour of soya beans to produce a soy-based beverage. While germination significantly increased the protein level as compared to the other treatments, the maximum reduction of the beany flavour was achieved by the 0.5% EDTA þ 0.5% sodium hydroxide application. The soya beans that underwent this treatment were used during the second phase for optimized beverage formulation. During the second phase, a beverage was prepared according to different formulations and analysed for chemical composition and total viable count during a two-month storage period. During storage, the beverage samples exhibited variations in several parameters. The acidity, reducing sugars and total sugars increased, while the ascorbic acid, total soluble solids and pH decreased. Overall, chemical and microbial analyses showed the stability of the product during the storage period. Keywords: soya bean, beany flavour, nutritious beverage, proximate analysis, microbial analysis Introduction Malnutrition due to protein deficiency is a serious problem among the masses in many developing countries, where the diet is generally based on cereals and, thus, fails to supply sufficient amounts of certain essential amino acids. The problem of protein malnutrition is most prevalent in South Asia, where the proportion of under-nourished children is much higher than that of even Sub-Saharan Africa (Mehrotra 2006). This type of malnutrition may lead to many disorders, such as weight and muscle loss, retarded growth, kwashiorkor and marasmus (Laghari et al. 2010). Thus, the utilization of protein-rich ingredients in the development of nutritious products is indispensable to combat the problems of protein malnutrition. The soya bean may provide a solution to protein malnutrition. In addition to being a rich source of protein, the soya bean contains essential amino acids as well as appreciable amounts of lipids, carbo- hydrates, fibre and vital minerals (Gandhi 2009). The protein content of the dry soya bean is approximately 40%, with a good balance of essential amino acids, as well as protein quality comparable to that of animal proteins, such as poultry and beef (Jooyandeh 2011). These nutritional constituents in the soya bean together with other components, such as isoflavones, phytosterols, steroidal saponins and other non- isoflavone phenolic acids, play a significant role in the reduction of several chronic diseases, such as cardiovascular disease, cancer and osteoporosis (Jooyandeh 2011; Mora-Escobedo et al. 2009). Conventionally, the soya bean is processed into products such as miso, natto and tofu. It is also used to produce soya flour, soy sauce, soy protein meat ISSN 0963-7486 print/ISSN 1465-3478 online q 2012 Informa UK, Ltd. DOI: 10.3109/09637486.2012.687365 Correspondence: Nauman Khalid, Department of Global Agricultural, Graduate School of Agricultural and Life Sciences, University of Tokyo, Japan. Tel: þ 81-80-3385-0786. E-mail: nauman_khalid120@yahoo.com International Journal of Food Sciences and Nutrition, December 2012; 63(8): 940–946 IntJFoodSciNutrDownloadedfrominformahealthcare.combyUniversityofTokyoon12/02/12 Forpersonaluseonly.
- 2. mimics, tempeh, soya bean oil, soya milk, soya yogurt and soya cheese (Vishwanathan et al. 2011; Champagne et al. 2009). The soya bean also has applications in various infant formulas, gluten-free breads as well as protein-enriched cookies (Moore et al. 2006; Marco and Rosell 2008). Another important aspect of the efficient utilization of the soya bean is the production of soy-based beverages, as beverages are highly economical and widely used food products among all age groups (Vishwanathan et al. 2011). However, the critical problem associated with the use of the soya bean is its undesirable beany flavour (Endo et al. 2004). Native chemical substances such as isoflavones, lipoxygenase enzymes and phenolic sub- stances are responsible for this beany flavour (Carra˜o- Panizzi et al. 1999; Anthon and Barrett 2001). To utilize the soya bean for product development, it is very important to remove these off-flavouring com- pounds during processing. This study was, therefore, undertaken to eliminate the undesirable beany flavour in the development of a soy-based beverage and to evaluate the performance of that beverage. Materials and methods Raw materials and chemicals The soya beans (CV: Ajmeri) were procured from the National Agriculture Research Council in Islamabad, Pakistan. The seeds of the soya beans were cleaned to remove dust and other extraneous material and stored in polyethylene bags until they were put to use. Sugar, hydrocolloids and other ingredients (of commercial grade quality) for the preparation of the soy-based beverage were purchased from the local market. All the chemicals used in the analysis were of analytical grade purity. First phase: reduction of the beany flavour The aim of the first phase trials was to reduce the beany flavour of the soya beans to an acceptable level. The seeds were rinsed prior to undergoing the following four different treatments: roasting (T1) for 15 min, germination (T2) for 48 h, autoclaving (T3) at 1218C for 15 min and chemical treatment (T4) of ethylenediaminetetraacetic acid (EDTA) 0.5% þ sodium hydroxide (NaOH 0.5%) for 4 h at a temperature of 60 ^ 28C. The seeds were then blanched (except for the autoclaved samples) at 1008C for 10 min, followed by wet grinding. The resultant paste was then heated at boiling temperature for 20 min. The soy paste was then dried and finally ground into flour. Proximate analysis of the soya bean flour The crude protein, crude fat, crude fibre carbohydrate content and ash content were determined using the standard methods of AOAC (1990). Sensory evaluation of the soya bean flour A sensory evaluation of the soya bean flour during the first phase was carried out to determine the level of reduction of the beany flavour in the treated samples. This evaluation was carried out by a panel of trained judges using a nine-point Hedonic scale, where nine was the highest score and one was the lowest score for flavour. Uniform conditions were maintained during the evaluation process, and the samples were evaluated one at a time (Larmond 1977). Before commencing the evaluation process, a 15-min briefing session was conducted with all members of the panel. The data were analysed for variance using the MSTATC statistical package (when significant differences, i.e. p , 0.05, were found), and Duncan’s multiple range test (DMRt) was used to determine the differences among the means (Steel et al. 1997). Second phase: Beverge preparation The best treatment (T4) from the first phase in terms of the maximum reduction of the beany flavour was selected and utilized to produce a beverage according to the formulation shown in Table I. Syrup (water and sugar) was prepared and pasteurized, and then stablizers, emulsifiers and other ingredients were Table I. Treatments and formulation of the beverage. Treatment codes Concentration of soya bean (%) Stabilizers (CMC þ Guargum) (1:1) (%) Sugar (g/200 mL) Ascorbic acid (g/200 mL) Citric acid (g/200 mL) Flavour (orange) (mL/200 mL) Emulsifier (Lecithin) (%) T1 5 0.6 24 0.03 0.24 0.24 1.0 T2 5 0.8 24 0.03 0.24 0.24 1.0 T3 5 1.0 24 0.03 0.24 0.24 1.0 T4 7 0.6 24 0.03 0.24 0.24 1.0 T5 7 0.8 24 0.03 0.24 0.24 1.0 T6 7 1.0 24 0.03 0.24 0.24 1.0 T7 9 0.6 24 0.03 0.24 0.24 1.0 T8 9 0.8 24 0.03 0.24 0.24 1.0 T9 9 1.0 24 0.03 0.24 0.24 1.0 Soy based beverage 941 IntJFoodSciNutrDownloadedfrominformahealthcare.combyUniversityofTokyoon12/02/12 Forpersonaluseonly.
- 3. added according to the given formulation. These materials along with the soya bean flour were blended at high speed. Finally, flavour was added and the whole mixture was blended again. Due to the sensitivity of the flavour, the blended beverage content was filled at room temperature in pre-sterlized glass bottles. The beverage was stored in these pre-sterlized bottles for two months at room temperature. Proximate analysis of the beverage The acidity, sugars, ascorbic acid, total soluble solids and pH of the beverage were determined by following the standard methods of AOAC (1990) at 15-day intervals for a period of 2 months. Microbiological analysis Total viable count. The total viable count of the beverage was determined by the serial dilution method explained by Fagbemi and Ijah (2006) at 15-day intervals over the 2-month period. Statistical analysis The data for various experimental parameters were analysed by using Minitab software version 13.0 (Minitab, Inc., USA). The general linear model technique was used to analyse the variance of these experimental parameters. In case of significant differences among treatments, DMRt as described by Steel et al. (1997) was used. Results and discussion Proximate analysis of the soya bean flour (first phase) The results regarding the proximate composition of the soya bean flour are presented in Table II. The effects of different treatments on the protein, crude fat, crude fibre, ash and carbohydrate contents were found to be significant (p , 0.05). The different treatments applied to the soya bean flour resulted in the increase in ash contents, with the maximum ash contents observed in the roasted soya bean flour (T1); this might have been due to the concentration of minerals through the removal of moisture during the roasting process. The increased ash content may be explained by the removal of moisture and the digestion of some organic material due to the exposure to dry heat (Rajaram and Janardhanan 1992). The autoclaving treatment resulted in a slight increase in fat content due to the breakdown of the lipid–protein complex in the soya beans. Higher crude fat may favour the lipoxygenase activity, but this possibility of lipoxygen- ase activity was managed through high-temperature blanching for a slightly longer period of time. The flour obtained from the germinated soya bean seeds (T2) showed the highest amount of crude protein content. This increase in protein may be attributed to the synthesis of enzyme proteins or compositional changes following the degradation of other constituents. Germination has been reported to improve the nutrient profile of soya beans, especially the amino acid content (Mostafa et al. 1987). Several treatments resulted in the decrease in the crude fibre content of the flour; the lowest amount of crude fibre was detected in the flour of the autoclaved soya beans (T3), and this might have been due to the heating of the seeds under pressure. The maximum carbohydrate amount was observed in the flour of the autoclaved soya beans (T3), which was due to the decreases in the ash and crude fibre contents of the flour. Sensory evaluation of the soya bean flour (first phase) The results regarding the beany flavour of the soya bean flour differed among the treatments. The results of DMRt shown in Table III revealed that the T4 soya flour received the highest scores (p , 0.05) and the T2 flour received the lowest scores. These low scores for the germinated soya bean flour might have been due to the soaking of the seeds in water prior to germination Table II. Effect of different treatments on chemical composition (%) of the soya bean flour. Treatments code Ash content (%) Crude fat (%) Crude protein (%) Crude fibre (%) Carbohydrate content (%) T0 6.40b 20.83b 37.48b 13.37a 14.19b T1 6.97a 23.50a 37.14b 12.76a 19.63bc T2 6.43b 21.50b 40.25a 12.90a 18.92c T3 5.70c 23.54a 36.75b 10.70b 23.31a T4 6.60b 21.33b 38.27b 12.83a 20.97b Note: Values with different superscript letters in a column are statistically significant (p , 0.05). T0 (Control); T1 (Roasting); T2 (Germination); T3 (Autoclaving); T4 (EDTA þ NaOH). Table III. Sensory evaluation of soya bean flour for beany flavour. Treatment Scores T0 (Control) 3.00b T1 (Roasted flour) 3.67b T2 (Germinated flour) 2.67b T3 (Autoclaved flour) 3.67b T4 (EDTA þ NaOH treated flour) 7.00a Note: Values with different superscript letters in a column are statistically significant (p , 0.05). S. Arif et al.942 IntJFoodSciNutrDownloadedfrominformahealthcare.combyUniversityofTokyoon12/02/12 Forpersonaluseonly.
- 4. that triggered the oxidation reactions of the isoflavones to develop some off-flavour compounds. The high scores obtained by the T4 flour may have been due to the application of EDTA, which is a chelating agent and also has antioxidant properties; this may protect against the production of the off-flavour by controlling the oxidation of phenolic compounds. These results are well supported by the study of Jacobsen et al. (2008), who explained the use of EDTA as an antioxidant. On the basis of sensory evaluation, the T4 flour was found to be the best among all four treatments, and therefore, it was selected for the preparation of the soy-based beverage. Physicochemical analysis of the beverage (second phase) Acidity. The results regarding the acidity of the beverage are presented in Table IV. The results of the present study indicated that the acidity of the beverages was significantly ( p , 0.05) affected by the interaction between the storage and treatments. Slight variations in acidity levels were observed in different Table IV. Physicochemical analysis of the beverage. Treatment codes Storage Acidity (%) Reducing sugars (%) Non-reducing sugars (%) Total sugars (%) Ascorbic acid (mg/100 mL) TSS (brix) PH T1 S1 0.06n 0.42p,q 12.13a– e 12.36 150.6b,c 12.08 4.20 S2 0.09n 0.68o 11.92a– e 12.46 143.8f 11.36 4.13 S3 0.47f,g 1.20i 11.04b– g 12.53 138.4k,l 10.75 3.62 S4 1.57a,b 1.73j 10.63e– g 12.54 136.8m,n 10.33 3.24 S5 1.77a 2.46e,f 7.46h 12.70 128.7t,u 10.07 3.20 T2 S1 0.07n 0.22r 12.20a– e 12.43 148.1d 12.16 4.04 S2 0.24j– m 0.74n,o 11.70a– g 12.40 142.3g 11.56 3.83 S3 0.75e 1.16lc 11.33a– g 12.50 137.7lm 10.93 3.53 S4 1.40c 1.78j 10.75c– g 12.53 135.30p 10.43 3.23 S5 1.47b,c 2.43f 10.27g 12.85 129.3t 9.73 2.73 T3 S1 0.06n 0.23r 12.27a– d 12.50 152.1a 12.43 4.23 S2 0.07n 0.74n,o 11.84a– f 12.58 144.5e,f 11.77 3.83 S3 0.34g –j 1.44k 11.21a– g 12.65 136.4n,o 11.35 3.43 S4 0.96d 1.97h 10.72d– g 12.69 134.8p 10.78 3.03 S5 0.98d 2.56d,e 10.29f,g 13.73 128o,u 10.41 2.91 T4 S1 0.07n 0.32q,r 12.53a,b 12.86 150.4c 13.31 4.20 S2 0.16l– n 0.85n 12.11a– e 12.96 140.8h,i 12.91 3.82 S3 0.25i– m 1.17lk 11.84a– f 13.01 138.6k,l 12.33 3.61 S4 0.35g –j 1.83i,j 11.45a– g 13.28 135.0p 11.83 3.00 S5 0.82e 2.72b,c 11.01b– g 13.80 127.7u 11.33 2.91 T5 S1 0.07n 0.43p,q 12.56a,b 12.89 151.0b,c 13.20 4.65 S2 0.12m,n 0.68o 12.10a– e 13.09 143.4f 12.63 4.20 S3 0.25i– m 1.27lc 11.87a– e 13.40 139.0j,k 12.08 3.91 S4 0.32h– j 2.133g 11.33a– g 13.53 136.4n,o 11.53 3.60 S5 0.38g –i 2.70b,c 11.00b– g 13.84 130.7s 11.00 3.51 T6 S1 0.08n 0.33r 12.54a,b 12.87 150.9b,c 13.45 4.47 S2 0.18l– n 0.78n,o 12.37a,b 13.15 143.8f 12.95 4.33 S3 0.28i– l 1.47k 11.79a– g 13.27 139.0j,k 12.33 4.20 S4 0.43f –h 2.20g 11.55a– g 13.75 136.4n,o 11.73 3.81 S5 0.52f 2.76b 11.07b– g 13.54 130.9s 10.95 3.43 T7 S1 0.08n 0.21r 12.51a,b 12.93 152.8a 14.40 5.00 S2 0.09n 0.54p 12.33a– c 13.01 145.6e 13.83 4.13 S3 0.27i– l 1.48k 11.95a– g 13.15 139.0j,k 13.23 3.82 S4 0.32h– k 1.90h,i 11.67a– g 13.41 136.1n,o 12.58 3.32 S5 0.46f,g 2.90a 11.07b– g 13.81 132.5r 12.06 3.16 T8 S1 0.09n 0.43p,q 12.50a,b 12.94 151.6a,b 14.18 5.23 S2 0.19k –n 0.67o 12.42a,b 13.09 147.4d 13.47 4.50 S3 0.23j– m 1.47k 11.95a– g 13.42 143.6f 12.61 3.93 S4 0.38g –i 1.85h –j 11.70a– g 13.55 140.0i,j 12.08 3.71 S5 0.47f,g 2.63c,d 11.18a– g 13.91 132.5r 11.52 3.13 T9 S1 0.08n 0.32q,r 12.54a,b 12.98 152.4a 15.14 5.13 S2 0.09n 0.98m 12.67a 13.35 148.2d 14.56 4.72 S3 0.18l– n 1.53k 12.25a– d 13.52 145.3e 13.96 4.19 S4 0.24j– m 2.20g 11.49a– f 13.62 141.2g,h 13.11 3.80 S5 0.35g –j 2.80a,b 11.21a– f 12.70 133.7q 12.40 3.55 Note: Values with different superscript letters in a column are statistically significant ( p , 0.05). T1 (soya bean 5% þ mixed stablizer 0.6%), T2 (Soya bean 5% þ mixed stablizer 0.8%), T3 (Soya bean 5% þ mixed stablizer 1%), T4 (soya bean 7% þ mixed stablizer 0.6%), T5 (soya bean 7% þ mixed stablizer 0.8%), T6 (Soya bean 7% þ mixed stablizer 1%), T7 (soya bean 9% þ mixed stablizer 0.6%), T8 (soya bean 9% þ mixed stablizer 0.8%), T9 (soya bean 9% þ mixed stablizer 1%); S1 (day 0), S2 (day 15), S3 (day 30), S4 (day 45), S5 (day 60). Soy based beverage 943 IntJFoodSciNutrDownloadedfrominformahealthcare.combyUniversityofTokyoon12/02/12 Forpersonaluseonly.
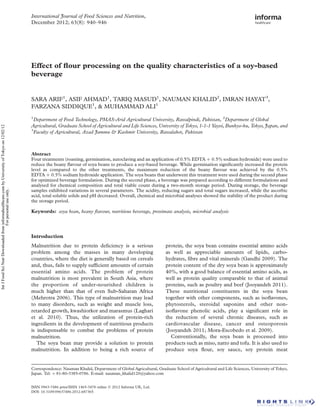
- 5. treatments, which may have been due to different concentrations of soya bean flour. The acidity increased linearly as a function of storage during the two-month storage period. The increase in acidity may have been the result of sucrose degradation during storage as a result of the chemical and enzymatic activity that produced acid, thereby making the beverage more acidic with the passage of time. During storage, the loss of the buffering capacity of solids, such as proteins and sugars, may also have resulted in the increased acidity of the beverage. Such a fluctuation in acidity may also be attributed to the degradation of soy proteins by the actions of micro-organisms (Adeyemi et al. 1991). Reducing sugars. The results regarding the reducing sugars of the beverage (Table IV) indicated that the beverage was significantly ( p , 0.05) affected by the interaction between the treatment and storage intervals. Variations in the reducing sugar values were observed in different treatments, which might be attributed to variable amounts of different reducing sugars in the soya bean flour, such as mannose, xylose and ribose. There was a significant difference in the reducing sugars at all storage intervals. The results showed that the production of reducing sugar increased as the length of the storage period increased. This increase in the concentration of reducing sugars was the result of the hydrolysis of oligosaccharides. The inversion of sucrose and the hydrolysis effect of temperature were well explained by Stein et al. (1986). Non-reducing sugars. The results indicated that the non-reducing sugars of the beverage were significantly (p , 0.05) affected by the interaction between storage and treatments (Table IV). Variations in the non- reducing sugar values of the beverage were observed in different treatments, which might be ascribed to the variation in soya bean concentrations as well as the presence of significant amounts of sucrose in the soya bean seeds. The non-reducing sugars decreased as a function of storage. These results may have been due to the degradation of these non-reducing sugars by micro-organisms during storage (Fuleki et al. 1994). Total sugars. The interaction between the storage interval and treatments showed a non-significant (p . 0.05) effect on the total sugars of the beverage (Table IV). The results showed that the total sugar contents of different beverages differed in various treatments with different amounts of soya bean flour. This was due to the fact that non-reducing sugars were actually converted into reducing sugars, thus maintaining the level of total sugar to a non- significant difference. Ascorbic acid. The results pertaining to the ascorbic acid contents of the beverage showed a significant ( p , 0.05) effect of the interaction between the storage interval and treatments (Table IV). Variations in ascorbic acid levels were observed in beverages with different amounts of soya bean flour, which might have been due to the variable amounts of ascorbic acid in different soya bean concentrations. The ascorbic acid content of the beverage decreased as a function of storage throughout the two-month storage period. This reduction in ascorbic acid was attributed to conversion into other substances during storage. 0.00E+00 5.00E+03 1.00E+04 1.50E+04 2.00E+04 2.50E+04 3.00E+04 S1 S2 S3 S4 S5 S1 S2 S3 S4 S5 S1 S2 S3 S4 S5 S1 S2 S3 S4 S5 S1 S2 S3 S4 S5 S1 S2 S3 S4 S5 S1 S2 S3 S4 S5 S1 S2 S3 S4 S5 S1 S2 S3 S4 S5 T1 T2 T3 T4 T5 T6 T7 T8 T9 Effect of treatments and storage intervals Totalviablecount Figure 1. Total viable count of the soy-based beverages. T1 (soya bean 5% þ mixed stablizer 0.6%), T2 (Soya bean 5% þ mixed stablizer 0.8%), T3 (Soya bean 5% þ mixed stablizer 1%), T4 (soya bean 7% þ mixed stablizer 0.6%), T5 (soya bean 7% þ mixed stablizer 0.8%), T6 (Soya bean 7% þ mixed stablizer 1%), T7 (soya bean 9% þ mixed stablizer 0.6%), T8 (soya bean 9% þ mixed stablizer 0.8%), T9 (soya bean 9% þ mixed stablizer 1%); S1 (day 0), S2 (day 15), S3 (day 30), S4 (day 45), S5 (day 60). S. Arif et al.944 IntJFoodSciNutrDownloadedfrominformahealthcare.combyUniversityofTokyoon12/02/12 Forpersonaluseonly.
- 6. The results of the present study are closely aligned with previous research (Costa et al. 2003) that showed a decrease in ascorbic acid as a function of storage. Total soluble solids. The results revealed a non- significant effect of the interaction between storage interval and treatments for the total soluble solids (TSS) of the beverage (Table IV). The results indicated that the TSS differed in various treatments with different amounts of soya bean flour. The increasing trend of TSS may have been due to the increased soya bean concentrations. The results of the present study showed that TSS decreased as the storage time increased. This decrease in TSS may have been due to the effect of the storage temperature and chemical changes during storage as well as the destruction of solid contents by micro-organisms. This trend is in line with Mugula et al. (2001), who explained that TSS decreases as a function of storage in both pasteurized and unpasteurized beverages made up of sorghum. pH. The interaction between treatments and storage intervals showed a non-significant ( p . 0.05) effect on the pH level of the beverage (Table IV). The results regarding the pH of the soy beverage indicated variations in different treatments, which may have been due to different concentrations of soya bean flour. The pH of the beverage decreased as the storage duration increased. This decrease in pH during storage might have been the result of increased acid production by micro-organisms. The acidification of soy beverages occurs due to the protein degradation by micro-organisms resulting in a drop in pH over the course of the storage period. Microbiological analysis Total viable count. The results regarding the total viable count of the beverage are depicted in Figure 1, which shows variations in the total viable count of different treatments. The total viable count slightly increased with increasing concentrations of soya bean flour, and the maximum total viable count was observed in T9. The increased total viable count in T9 may have been the result of the increased concentration of soya bean flour; this confirms the finding of Viegas et al. (1985) that increasing the amount of soya flour leads to an increase in the total viable count. The total viable count of the beverage varied significantly at all storage intervals. This variation may be attributed to changes in acidity and pH during the storage period. The increase in acidity limited the microbial growth. Conclusions As a rich source of protein as well as other nutrients, the soya bean has great potential to be transformed into various value-added products to combat the problems of malnutrition. It is possible to utilize a combination of chemical treatments, such as EDTA and NaOH, to reduce the beany flavour of soya beans to a significant level, and such treated soya beans could be used to manufacture nutritious beverages. Vari- ations in the soya bean concentrations in the beverage samples introduced small compositional changes in the final products. Such nutritious soy-based bev- erages have the potential to remain stable for a fairly long period of time. Declaration of interest: The authors report no conflict of interest. The authors alone are responsible for the content and writing of the paper. References Adeyemi I, Akanbi C, Fasoro O. 1991. Effect of soy fractions on some functional and rheological properties of maize banana mixtures. J Food Process Prep 15:31–43. Anthon GE, Barrett DM. 2001. Colorimetric method for the determination of lipoxygenase activity. J Agric Food Chem 49: 32–37. AOAC. 1990. Official methods of analysis. Arlington, VA: Association of Analytical Chemists. Champagne C, Green-Johnson J, Raymond Y, Barrette J, Buckley N. 2009. Selection of probiotic bacteria for the fermentation of a soy beverage in combination with Streptococcus thermophilus. Food Res Int 42:612–621. Carra˜o-Panizzi MC, Bele´ia ADP, Prudeˆncio-Ferreira SH, Oliveira MCN, Kitamura K. 1999. Effects of isoflavones on beany flavor and astringency of soymilk and cooked whole soybean grains. Pesqui Agropecu Bras 34:1044–1052. Costa MCO, Maia GA, Figueiredo RW, Souza Filho MSM, Brasil IM. 2003. Storage stability of cashew apple juice preserved by hot fill and aseptic processes. Cieˆnc Tecnol Aliment 23:106–109. Endo H, Ohno M, Tanji K, Shimada S, Kaneko K. 2004. Effect of heat treatment on the lipid peroxide content and aokusami (beany flavor) of soymilk. Food Sci Technol Res 10:328–333. Fagbemi A, Ijah U. 2006. Microbial population and biochemical changes during production of protein-enriched fufu. World J Microbiol Biotechnol 22:635–640. Fuleki T, Pelayo E, Palabay R. 1994. Sugar composition of varietal juices produced from fresh and stored apple. J Agric Food Chem 42:1266–1275. Gandhi A. 2009. Quality of soy bean and its food products. Int Food Res J 16:11–19. Jacobsen C, Let MB, Nielsen NS, Meyer AS. 2008. Antioxidant strategies for preventing oxidative flavour deterioration of foods enriched with n-3 polyunsaturated lipids:a comparative evalu- ation. Trends Food Sci Technol 19:76–93. Jooyandeh H. 2011. Soy Products as Healthy and Functional Foods. Middle-East J Sci Res 7:71–80. Laghari H, Memon A, Memon M. 2010. Malnutrition a risk factor for myocardial infarction in patients with type-2 diabetes. Rawal Med J 35:57. Larmond E. 1977. Laboratory methods for sensory evaluation of food. Ottawa: Agriculture Canada, Research Branch. p 44. Marco C, Rosell C. 2008. Effect of different protein isolates and transglutaminase on rice flour properties. J Food Eng 84: 132–139. Soy based beverage 945 IntJFoodSciNutrDownloadedfrominformahealthcare.combyUniversityofTokyoon12/02/12 Forpersonaluseonly.
- 7. Mehrotra S. 2006. Child malnutrition and gender discrimination in South Asia. Econ Pol Weekly 41:912–918. Moore MM, Heinbockel M, Dockery P, Ulmer H, Arendt EK. 2006. Network formation in gluten-free bread with application of transglutaminase. Cereal Chem 83:28–36. Mora-Escobedo R, Robles-Ramı´rez MC, Ramo´n-Gallegos E, Reza-Alema´n R. 2009. Effect of protein hydrolysates from germinated soybean on cancerous cells of the human cervix: an in vitro study. Plant Food Hum Nutr 64:271–278. Mostafa M, Rahma E, Rady A. 1987. Chemical and nutritional changes in soybean during germination. Food Chem 23: 257–275. Mugula JK, Nnko SAM, SØRhaug T. 2001. Changes in quality attributes during storage of togwa, a lactic acid fermented gruel. J Food Safety 21:181–194. Rajaram N, Janardhanan K. 1992. Nutritional and chemical evaluation of raw seeds ofCanavalia gladiata and Censiformis: the under utilized food and fodder crops in India. Plant Food Hum Nutr 42:329–336. Steel R, Torrie J, Dickey D. 1997. Principles and procedures of statistics: a biometrical approach. New York: McGraw Hill Book Co. Stein E, Brown H, Mxclure W. 1986. Seasonal and storage effects on colour of red fleshed grape fruit juice. J Food Sci 51:574–576. Viegas CA, Sa-Correia I, Novais JM. 1985. Nutrient-enhanced production of remarkably high concentrations of ethanol by Saccharomyces bayanus through soy flour supplementation. Appl Environ Microbiol 50:1333–1335. Vishwanathan KH, Singh V, Subramanian R. 2011. Wet grinding characteristics of soybean for soymilk extraction. J Food Eng 106:28–34. S. Arif et al.946 IntJFoodSciNutrDownloadedfrominformahealthcare.combyUniversityofTokyoon12/02/12 Forpersonaluseonly.