SlideShare a Scribd company logo
1 of 5
Frequency distribution
A tabular summary of data showing the number (frequency) of data values in each of several
nonoverlapping classes.
How to make a frequency table?
Frequency distributions are often displayed using frequency tables. A frequency table is an effective way
to summarize or organize a dataset. It’s usually composed of two columns:
1 The values or class intervals
2 Their frequencies
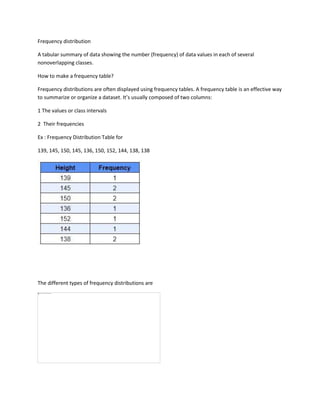
Ex : Frequency Distribution Table for
139, 145, 150, 145, 136, 150, 152, 144, 138, 138
The different types of frequency distributions are
1 Ungrouped frequency distributions: Instead of sets of data values, it presents the frequency of an item
in each particular data value.
Example: Making an ungrouped frequency table
A gardener set up a bird feeder in their backyard. To help them decide how much and what type of
birdseed to buy, they decide to record the bird species that visit their feeder. Over the course of one
morning, the following birds visit their feeder:
2 Grouped frequency distributions: The data is organised and grouped into groups called class intervals
in this type. In a frequency distribution table, the frequency of data belonging to each class interval is
represented. The grouped frequency table shows the frequency distribution in class intervals.
Example: Grouped frequency distribution
A sociologist conducted a survey of 20 adults. She wants to report the frequency distribution of the ages
of the survey respondents. The respondents were the following ages in years:
52, 34, 32, 29, 63, 40, 46, 54, 36, 36, 24, 19, 45, 20, 28, 29, 38, 33, 49, 37
Round the class interval width to 10.
The class intervals are 19 ≤ a < 29, 29 ≤ a < 39, 39 ≤ a < 49, 49 ≤ a < 59, and 59 ≤ a < 69.
3 Relative frequency distributions: It indicates what percentage of the total number of observations
each category belongs to.
Example: Relative frequency distribution
From this table, the gardener can make observations, such as that 19% of the bird feeder visits were
from chickadees and 25% were from finches.
4 Cumulative frequency distributions: A frequency distribution is the sum of the first frequency and all
frequencies below it. We must add each value to the next, then add the sum to the next, and so on until
the last value is reached. The whole sum of all frequencies will be the last cumulative frequency.
Example: Cumulative frequency distribution
From this table, the sociologist can make observations such as 13 respondents (65%) were under 39
years old, and 16 respondents (80%) were under 49 years old.
How to graph a frequency distribution?
Pie charts, bar charts, and histograms are all ways of graphing frequency distributions. The best choice
depends on the type of variable and what you’re trying to communicate.
1 Pie chart
A pie chart is a graph that shows the relative frequency distribution of a nominal variable.
A pie chart is a circle that’s divided into one slice for each value. The size of the slices shows their
relative frequency. This type of graph can be a good choice when you want to emphasize that one
variable is especially frequent or infrequent, or you want to present the overall composition of a
variable.
2 Bar chart
A bar chart is a graph that shows the frequency or relative frequency distribution of a categorical
variable (nominal or ordinal).
The y-axis of the bars shows the frequencies or relative frequencies, and the x-axis shows the values.
Each value is represented by a bar, and the length or height of the bar shows the frequency of the value.
A bar chart is a good choice when you want to compare the frequencies of different values. It’s much
easier to compare the heights of bars than the angles of pie chart slices.
3 Histogram
A histogram is a graph that shows the frequency or relative frequency distribution of a quantitative
variable. It looks similar to a bar chart.

More Related Content

Similar to Frequency distr-WPS Office.docx

Chapter-2-Frequency-Distribution-and-Graphical-Presentation.pptx
Chapter-2-Frequency-Distribution-and-Graphical-Presentation.pptxChapter-2-Frequency-Distribution-and-Graphical-Presentation.pptx
Chapter-2-Frequency-Distribution-and-Graphical-Presentation.pptxLaurenceBernardBalbi1
 
FREQUENCY DISTRIBUTION.pptx
FREQUENCY DISTRIBUTION.pptxFREQUENCY DISTRIBUTION.pptx
FREQUENCY DISTRIBUTION.pptxSreeLatha98
 
Descriptive Statistics
Descriptive StatisticsDescriptive Statistics
Descriptive StatisticsBhagya Silva
 
Chapter 2 250110 083240
Chapter 2 250110 083240Chapter 2 250110 083240
Chapter 2 250110 083240guest25d353
 
Chapter 2 250110 083240
Chapter 2 250110 083240Chapter 2 250110 083240
Chapter 2 250110 083240guest25d353
 
Presentation and analysis of business data
Presentation and analysis of business dataPresentation and analysis of business data
Presentation and analysis of business dataGeorginaRecto
 
Presentation and-analysis-of-business-data
Presentation and-analysis-of-business-dataPresentation and-analysis-of-business-data
Presentation and-analysis-of-business-datamariantuvilla
 
Presentation and-analysis-of-business-data
Presentation and-analysis-of-business-dataPresentation and-analysis-of-business-data
Presentation and-analysis-of-business-datalawrencechavenia
 
Presentation and-analysis-of-business-data
Presentation and-analysis-of-business-dataPresentation and-analysis-of-business-data
Presentation and-analysis-of-business-datalovelyquintero
 
Presentation and-analysis-of-business-data
Presentation and-analysis-of-business-dataPresentation and-analysis-of-business-data
Presentation and-analysis-of-business-datalovelyquintero
 
Presentation and-analysis-of-business-data
Presentation and-analysis-of-business-dataPresentation and-analysis-of-business-data
Presentation and-analysis-of-business-datalovelyquintero
 
Data Presentation Methods.pptx
Data Presentation Methods.pptxData Presentation Methods.pptx
Data Presentation Methods.pptxjacob735118
 
Day2 session i&amp;ii - spss
Day2 session i&amp;ii - spssDay2 session i&amp;ii - spss
Day2 session i&amp;ii - spssabir hossain
 
2. AAdata presentation edited edited tutor srudents(1).pptx
2. AAdata presentation edited edited tutor srudents(1).pptx2. AAdata presentation edited edited tutor srudents(1).pptx
2. AAdata presentation edited edited tutor srudents(1).pptxssuser504dda
 
Biostatistical methods
Biostatistical methodsBiostatistical methods
Biostatistical methodsPrakkan Hillol
 
ADVANCED STATISTICS PREVIOUS YEAR QUESTIONS.docx
ADVANCED STATISTICS PREVIOUS YEAR QUESTIONS.docxADVANCED STATISTICS PREVIOUS YEAR QUESTIONS.docx
ADVANCED STATISTICS PREVIOUS YEAR QUESTIONS.docxTaskiaSarkar
 
Lecture 3 Data Presentation in biostatistics. ppt
Lecture 3 Data Presentation in biostatistics. pptLecture 3 Data Presentation in biostatistics. ppt
Lecture 3 Data Presentation in biostatistics. pptmartineshija769
 

Similar to Frequency distr-WPS Office.docx (20)

Chapter-2-Frequency-Distribution-and-Graphical-Presentation.pptx
Chapter-2-Frequency-Distribution-and-Graphical-Presentation.pptxChapter-2-Frequency-Distribution-and-Graphical-Presentation.pptx
Chapter-2-Frequency-Distribution-and-Graphical-Presentation.pptx
 
STAT.pptx
STAT.pptxSTAT.pptx
STAT.pptx
 
FREQUENCY DISTRIBUTION.pptx
FREQUENCY DISTRIBUTION.pptxFREQUENCY DISTRIBUTION.pptx
FREQUENCY DISTRIBUTION.pptx
 
Maths PPT.pptx
Maths PPT.pptxMaths PPT.pptx
Maths PPT.pptx
 
Descriptive Statistics
Descriptive StatisticsDescriptive Statistics
Descriptive Statistics
 
Business statistics
Business statisticsBusiness statistics
Business statistics
 
Chapter 2 250110 083240
Chapter 2 250110 083240Chapter 2 250110 083240
Chapter 2 250110 083240
 
Chapter 2 250110 083240
Chapter 2 250110 083240Chapter 2 250110 083240
Chapter 2 250110 083240
 
Presentation and analysis of business data
Presentation and analysis of business dataPresentation and analysis of business data
Presentation and analysis of business data
 
Presentation and-analysis-of-business-data
Presentation and-analysis-of-business-dataPresentation and-analysis-of-business-data
Presentation and-analysis-of-business-data
 
Presentation and-analysis-of-business-data
Presentation and-analysis-of-business-dataPresentation and-analysis-of-business-data
Presentation and-analysis-of-business-data
 
Presentation and-analysis-of-business-data
Presentation and-analysis-of-business-dataPresentation and-analysis-of-business-data
Presentation and-analysis-of-business-data
 
Presentation and-analysis-of-business-data
Presentation and-analysis-of-business-dataPresentation and-analysis-of-business-data
Presentation and-analysis-of-business-data
 
Presentation and-analysis-of-business-data
Presentation and-analysis-of-business-dataPresentation and-analysis-of-business-data
Presentation and-analysis-of-business-data
 
Data Presentation Methods.pptx
Data Presentation Methods.pptxData Presentation Methods.pptx
Data Presentation Methods.pptx
 
Day2 session i&amp;ii - spss
Day2 session i&amp;ii - spssDay2 session i&amp;ii - spss
Day2 session i&amp;ii - spss
 
2. AAdata presentation edited edited tutor srudents(1).pptx
2. AAdata presentation edited edited tutor srudents(1).pptx2. AAdata presentation edited edited tutor srudents(1).pptx
2. AAdata presentation edited edited tutor srudents(1).pptx
 
Biostatistical methods
Biostatistical methodsBiostatistical methods
Biostatistical methods
 
ADVANCED STATISTICS PREVIOUS YEAR QUESTIONS.docx
ADVANCED STATISTICS PREVIOUS YEAR QUESTIONS.docxADVANCED STATISTICS PREVIOUS YEAR QUESTIONS.docx
ADVANCED STATISTICS PREVIOUS YEAR QUESTIONS.docx
 
Lecture 3 Data Presentation in biostatistics. ppt
Lecture 3 Data Presentation in biostatistics. pptLecture 3 Data Presentation in biostatistics. ppt
Lecture 3 Data Presentation in biostatistics. ppt
 

Recently uploaded

80 ĐỀ THI THỬ TUYỂN SINH TIẾNG ANH VÀO 10 SỞ GD – ĐT THÀNH PHỐ HỒ CHÍ MINH NĂ...
80 ĐỀ THI THỬ TUYỂN SINH TIẾNG ANH VÀO 10 SỞ GD – ĐT THÀNH PHỐ HỒ CHÍ MINH NĂ...80 ĐỀ THI THỬ TUYỂN SINH TIẾNG ANH VÀO 10 SỞ GD – ĐT THÀNH PHỐ HỒ CHÍ MINH NĂ...
80 ĐỀ THI THỬ TUYỂN SINH TIẾNG ANH VÀO 10 SỞ GD – ĐT THÀNH PHỐ HỒ CHÍ MINH NĂ...Nguyen Thanh Tu Collection
 
How to Add New Custom Addons Path in Odoo 17
How to Add New Custom Addons Path in Odoo 17How to Add New Custom Addons Path in Odoo 17
How to Add New Custom Addons Path in Odoo 17Celine George
 
SOC 101 Demonstration of Learning Presentation
SOC 101 Demonstration of Learning PresentationSOC 101 Demonstration of Learning Presentation
SOC 101 Demonstration of Learning Presentationcamerronhm
 
Exploring_the_Narrative_Style_of_Amitav_Ghoshs_Gun_Island.pptx
Exploring_the_Narrative_Style_of_Amitav_Ghoshs_Gun_Island.pptxExploring_the_Narrative_Style_of_Amitav_Ghoshs_Gun_Island.pptx
Exploring_the_Narrative_Style_of_Amitav_Ghoshs_Gun_Island.pptxPooja Bhuva
 
Unit 3 Emotional Intelligence and Spiritual Intelligence.pdf
Unit 3 Emotional Intelligence and Spiritual Intelligence.pdfUnit 3 Emotional Intelligence and Spiritual Intelligence.pdf
Unit 3 Emotional Intelligence and Spiritual Intelligence.pdfDr Vijay Vishwakarma
 
FSB Advising Checklist - Orientation 2024
FSB Advising Checklist - Orientation 2024FSB Advising Checklist - Orientation 2024
FSB Advising Checklist - Orientation 2024Elizabeth Walsh
 
Basic Intentional Injuries Health Education
Basic Intentional Injuries Health EducationBasic Intentional Injuries Health Education
Basic Intentional Injuries Health EducationNeilDeclaro1
 
On National Teacher Day, meet the 2024-25 Kenan Fellows
On National Teacher Day, meet the 2024-25 Kenan FellowsOn National Teacher Day, meet the 2024-25 Kenan Fellows
On National Teacher Day, meet the 2024-25 Kenan FellowsMebane Rash
 
Understanding Accommodations and Modifications
Understanding  Accommodations and ModificationsUnderstanding  Accommodations and Modifications
Understanding Accommodations and ModificationsMJDuyan
 
Basic Civil Engineering first year Notes- Chapter 4 Building.pptx
Basic Civil Engineering first year Notes- Chapter 4 Building.pptxBasic Civil Engineering first year Notes- Chapter 4 Building.pptx
Basic Civil Engineering first year Notes- Chapter 4 Building.pptxDenish Jangid
 
On_Translating_a_Tamil_Poem_by_A_K_Ramanujan.pptx
On_Translating_a_Tamil_Poem_by_A_K_Ramanujan.pptxOn_Translating_a_Tamil_Poem_by_A_K_Ramanujan.pptx
On_Translating_a_Tamil_Poem_by_A_K_Ramanujan.pptxPooja Bhuva
 
latest AZ-104 Exam Questions and Answers
latest AZ-104 Exam Questions and Answerslatest AZ-104 Exam Questions and Answers
latest AZ-104 Exam Questions and Answersdalebeck957
 
How to setup Pycharm environment for Odoo 17.pptx
How to setup Pycharm environment for Odoo 17.pptxHow to setup Pycharm environment for Odoo 17.pptx
How to setup Pycharm environment for Odoo 17.pptxCeline George
 
This PowerPoint helps students to consider the concept of infinity.
This PowerPoint helps students to consider the concept of infinity.This PowerPoint helps students to consider the concept of infinity.
This PowerPoint helps students to consider the concept of infinity.christianmathematics
 
REMIFENTANIL: An Ultra short acting opioid.pptx
REMIFENTANIL: An Ultra short acting opioid.pptxREMIFENTANIL: An Ultra short acting opioid.pptx
REMIFENTANIL: An Ultra short acting opioid.pptxDr. Ravikiran H M Gowda
 
How to Create and Manage Wizard in Odoo 17
How to Create and Manage Wizard in Odoo 17How to Create and Manage Wizard in Odoo 17
How to Create and Manage Wizard in Odoo 17Celine George
 
ICT Role in 21st Century Education & its Challenges.pptx
ICT Role in 21st Century Education & its Challenges.pptxICT Role in 21st Century Education & its Challenges.pptx
ICT Role in 21st Century Education & its Challenges.pptxAreebaZafar22
 
Python Notes for mca i year students osmania university.docx
Python Notes for mca i year students osmania university.docxPython Notes for mca i year students osmania university.docx
Python Notes for mca i year students osmania university.docxRamakrishna Reddy Bijjam
 
Google Gemini An AI Revolution in Education.pptx
Google Gemini An AI Revolution in Education.pptxGoogle Gemini An AI Revolution in Education.pptx
Google Gemini An AI Revolution in Education.pptxDr. Sarita Anand
 

Recently uploaded (20)

80 ĐỀ THI THỬ TUYỂN SINH TIẾNG ANH VÀO 10 SỞ GD – ĐT THÀNH PHỐ HỒ CHÍ MINH NĂ...
80 ĐỀ THI THỬ TUYỂN SINH TIẾNG ANH VÀO 10 SỞ GD – ĐT THÀNH PHỐ HỒ CHÍ MINH NĂ...80 ĐỀ THI THỬ TUYỂN SINH TIẾNG ANH VÀO 10 SỞ GD – ĐT THÀNH PHỐ HỒ CHÍ MINH NĂ...
80 ĐỀ THI THỬ TUYỂN SINH TIẾNG ANH VÀO 10 SỞ GD – ĐT THÀNH PHỐ HỒ CHÍ MINH NĂ...
 
How to Add New Custom Addons Path in Odoo 17
How to Add New Custom Addons Path in Odoo 17How to Add New Custom Addons Path in Odoo 17
How to Add New Custom Addons Path in Odoo 17
 
SOC 101 Demonstration of Learning Presentation
SOC 101 Demonstration of Learning PresentationSOC 101 Demonstration of Learning Presentation
SOC 101 Demonstration of Learning Presentation
 
Exploring_the_Narrative_Style_of_Amitav_Ghoshs_Gun_Island.pptx
Exploring_the_Narrative_Style_of_Amitav_Ghoshs_Gun_Island.pptxExploring_the_Narrative_Style_of_Amitav_Ghoshs_Gun_Island.pptx
Exploring_the_Narrative_Style_of_Amitav_Ghoshs_Gun_Island.pptx
 
Unit 3 Emotional Intelligence and Spiritual Intelligence.pdf
Unit 3 Emotional Intelligence and Spiritual Intelligence.pdfUnit 3 Emotional Intelligence and Spiritual Intelligence.pdf
Unit 3 Emotional Intelligence and Spiritual Intelligence.pdf
 
FSB Advising Checklist - Orientation 2024
FSB Advising Checklist - Orientation 2024FSB Advising Checklist - Orientation 2024
FSB Advising Checklist - Orientation 2024
 
Basic Intentional Injuries Health Education
Basic Intentional Injuries Health EducationBasic Intentional Injuries Health Education
Basic Intentional Injuries Health Education
 
On National Teacher Day, meet the 2024-25 Kenan Fellows
On National Teacher Day, meet the 2024-25 Kenan FellowsOn National Teacher Day, meet the 2024-25 Kenan Fellows
On National Teacher Day, meet the 2024-25 Kenan Fellows
 
Understanding Accommodations and Modifications
Understanding  Accommodations and ModificationsUnderstanding  Accommodations and Modifications
Understanding Accommodations and Modifications
 
Basic Civil Engineering first year Notes- Chapter 4 Building.pptx
Basic Civil Engineering first year Notes- Chapter 4 Building.pptxBasic Civil Engineering first year Notes- Chapter 4 Building.pptx
Basic Civil Engineering first year Notes- Chapter 4 Building.pptx
 
On_Translating_a_Tamil_Poem_by_A_K_Ramanujan.pptx
On_Translating_a_Tamil_Poem_by_A_K_Ramanujan.pptxOn_Translating_a_Tamil_Poem_by_A_K_Ramanujan.pptx
On_Translating_a_Tamil_Poem_by_A_K_Ramanujan.pptx
 
Mehran University Newsletter Vol-X, Issue-I, 2024
Mehran University Newsletter Vol-X, Issue-I, 2024Mehran University Newsletter Vol-X, Issue-I, 2024
Mehran University Newsletter Vol-X, Issue-I, 2024
 
latest AZ-104 Exam Questions and Answers
latest AZ-104 Exam Questions and Answerslatest AZ-104 Exam Questions and Answers
latest AZ-104 Exam Questions and Answers
 
How to setup Pycharm environment for Odoo 17.pptx
How to setup Pycharm environment for Odoo 17.pptxHow to setup Pycharm environment for Odoo 17.pptx
How to setup Pycharm environment for Odoo 17.pptx
 
This PowerPoint helps students to consider the concept of infinity.
This PowerPoint helps students to consider the concept of infinity.This PowerPoint helps students to consider the concept of infinity.
This PowerPoint helps students to consider the concept of infinity.
 
REMIFENTANIL: An Ultra short acting opioid.pptx
REMIFENTANIL: An Ultra short acting opioid.pptxREMIFENTANIL: An Ultra short acting opioid.pptx
REMIFENTANIL: An Ultra short acting opioid.pptx
 
How to Create and Manage Wizard in Odoo 17
How to Create and Manage Wizard in Odoo 17How to Create and Manage Wizard in Odoo 17
How to Create and Manage Wizard in Odoo 17
 
ICT Role in 21st Century Education & its Challenges.pptx
ICT Role in 21st Century Education & its Challenges.pptxICT Role in 21st Century Education & its Challenges.pptx
ICT Role in 21st Century Education & its Challenges.pptx
 
Python Notes for mca i year students osmania university.docx
Python Notes for mca i year students osmania university.docxPython Notes for mca i year students osmania university.docx
Python Notes for mca i year students osmania university.docx
 
Google Gemini An AI Revolution in Education.pptx
Google Gemini An AI Revolution in Education.pptxGoogle Gemini An AI Revolution in Education.pptx
Google Gemini An AI Revolution in Education.pptx
 

Frequency distr-WPS Office.docx

  • 1. Frequency distribution A tabular summary of data showing the number (frequency) of data values in each of several nonoverlapping classes. How to make a frequency table? Frequency distributions are often displayed using frequency tables. A frequency table is an effective way to summarize or organize a dataset. It’s usually composed of two columns: 1 The values or class intervals 2 Their frequencies Ex : Frequency Distribution Table for 139, 145, 150, 145, 136, 150, 152, 144, 138, 138 The different types of frequency distributions are
  • 2. 1 Ungrouped frequency distributions: Instead of sets of data values, it presents the frequency of an item in each particular data value. Example: Making an ungrouped frequency table A gardener set up a bird feeder in their backyard. To help them decide how much and what type of birdseed to buy, they decide to record the bird species that visit their feeder. Over the course of one morning, the following birds visit their feeder: 2 Grouped frequency distributions: The data is organised and grouped into groups called class intervals in this type. In a frequency distribution table, the frequency of data belonging to each class interval is represented. The grouped frequency table shows the frequency distribution in class intervals. Example: Grouped frequency distribution A sociologist conducted a survey of 20 adults. She wants to report the frequency distribution of the ages of the survey respondents. The respondents were the following ages in years: 52, 34, 32, 29, 63, 40, 46, 54, 36, 36, 24, 19, 45, 20, 28, 29, 38, 33, 49, 37
  • 3. Round the class interval width to 10. The class intervals are 19 ≤ a < 29, 29 ≤ a < 39, 39 ≤ a < 49, 49 ≤ a < 59, and 59 ≤ a < 69. 3 Relative frequency distributions: It indicates what percentage of the total number of observations each category belongs to. Example: Relative frequency distribution From this table, the gardener can make observations, such as that 19% of the bird feeder visits were from chickadees and 25% were from finches. 4 Cumulative frequency distributions: A frequency distribution is the sum of the first frequency and all frequencies below it. We must add each value to the next, then add the sum to the next, and so on until the last value is reached. The whole sum of all frequencies will be the last cumulative frequency. Example: Cumulative frequency distribution
  • 4. From this table, the sociologist can make observations such as 13 respondents (65%) were under 39 years old, and 16 respondents (80%) were under 49 years old. How to graph a frequency distribution? Pie charts, bar charts, and histograms are all ways of graphing frequency distributions. The best choice depends on the type of variable and what you’re trying to communicate. 1 Pie chart A pie chart is a graph that shows the relative frequency distribution of a nominal variable. A pie chart is a circle that’s divided into one slice for each value. The size of the slices shows their relative frequency. This type of graph can be a good choice when you want to emphasize that one variable is especially frequent or infrequent, or you want to present the overall composition of a variable. 2 Bar chart A bar chart is a graph that shows the frequency or relative frequency distribution of a categorical variable (nominal or ordinal). The y-axis of the bars shows the frequencies or relative frequencies, and the x-axis shows the values. Each value is represented by a bar, and the length or height of the bar shows the frequency of the value.
  • 5. A bar chart is a good choice when you want to compare the frequencies of different values. It’s much easier to compare the heights of bars than the angles of pie chart slices. 3 Histogram A histogram is a graph that shows the frequency or relative frequency distribution of a quantitative variable. It looks similar to a bar chart.