SlideShare a Scribd company logo
1 of 8
Download to read offline
for Agriculture Spring 2013
Esri News
continued on page 3
Clearwater Seafoods Limited is a global
leader in the seafood industry and the largest
harvester of wild shellfish in the Atlantic
Ocean off Canada. The award-winning
company has built its business around a
Clearwater Seafoods Achieves Sustainable
Operations through GIS
Courtesy of Esri Canada Limited
core commitment to long-term sustainability
and responsible fishing. Always looking to
improve operations, Clearwater invests signifi-
cantly in technologies that enable top-quality
seafood to be delivered from ocean to plate.
A recent investment in GIS has resulted in
significant cost savings, minimized impact on
ocean ecosystems, and promoted a sustain-
able approach to fishing.
 Footprint of Clam Harvest Distribution with Survey Positions
Spring 2013
Esri News for Agriculture is a publication of the
Agriculture Solutions Group of Esri.
To contact the Esri Desktop Order Center, call 1-800-447-9778
within the United States or 909-793-2853, ext. 1-1235, outside
the United States.
Visit the Esri website at esri.com.
View Esri News for Agriculture online at esri.com/agriculture or
scan the code below with your smartphone.
Advertise with Us
E-mail ads@esri.com.
Submit Content
To submit articles for publication in Esri News for Agriculture,
contact Jim Baumann at jbaumann@esri.com.
Manage Your Subscription
To update your mailing address or subscribe or unsubscribe to
Esri publications, visit esri.com/publications.
International customers should contact an Esri distributor to
manage their subscriptions.
For a directory of distributors, visit esri.com/distributors.
Circulation Services
For back issues, missed issues, and other circulation services,
e-mail requests@esri.com; call 909-793-2853, extension 2778; or
fax 909-798-0560.
2 Esri News for Agriculture  Spring 2013
Contents
1	 Clearwater Seafoods Achieves Sustainable Operations
through GIS
4	 ACLEP Digs Deep to Create National Soil Database
6	 Will Breadfruit Solve the World Hunger Crisis?
The information contained in this work is the exclusive property of Esri or its licensors. This work is protected
under United States copyright law and other international copyright treaties and conventions. No part of this
work may be reproduced or transmitted in any form or by any means, electronic or mechanical, including
photocopying and recording, or by any information storage or retrieval system, except as expressly
permitted in writing by Esri. All requests should be sent to Attention: Contracts and Legal Services Manager,
Esri, 380 New York Street, Redlands, CA 92373-8100 USA.
The information contained in this work is subject to change without notice.
The Geographic Advantage, Esri, the Esri globe logo, 3D Analyst, ArcAtlas, ArcCatalog, ArcData, ArcDoc,
ArcEditor, ArcExplorer, ArcGIS, the ArcGIS logo, ArcGlobe, ArcIMS, ARC/INFO, ArcInfo, ArcLogistics,
ArcMap, ArcNetwork, ArcNews, ArcObjects, ArcPad, ArcPress, ArcReader, ArcSDE, ArcSurvey, ArcToolbox,
ArcTools, ArcUser, ArcView, ArcVoyager, ArcWatch, ArcWeb, ArcWorld, ArcXML, Business Analyst Online,
BusinessMAP, CommunityInfo, EDN, Geography Network, GIS Day, MapData, MapObjects, Maplex,
MapStudio, ModelBuilder, MOLE, NetEngine, RouteMAP, SDE, Sourcebook•America, StreetMap, Tapestry,
@esri.com, esri.com, arcgis.com, geographynetwork.com, gis.com, and gisday.com are trademarks,
service marks, or registered marks of Esri in the United States, the European Community, or certain other
jurisdictions.
Other companies and products or services mentioned herein may be trademarks, service marks, or
registered marks of their respective mark owners.
Copyright © 2013 Esri.
All rights reserved.
Printed in the United States of America.
Based in Nova Scotia, Clearwater harvests,
processes, markets, and sells premium
shellfish and seafood to a variety of markets
worldwide. The company must balance a
high level of production with a commitment
to responsible fisheries management—a
practice that draws on science to ensure sus-
tainable exploitation. As a largely geographic
undertaking, sustainable fisheries manage-
ment requires the ability to intersect and
analyze many layers of data including species
abundance and composition, feeding and
reproduction, historical fishing efforts, and
oceanographic/ecosystem conditions.
	 Forecasting where and what type of harvest
will be available is also a key component of
responsible fishing. This can be achieved
through assessment models that predict the
Clearwater Seafoods Achieves Sustainable Operations through GIS  continued from cover
location, stage of growth, and populations of
various biomasses. Access to this information
improves fishing success rates and also helps
protect the ocean’s diverse ecosystems by
minimizing impact on nontarget species.
	 “GIS serves as the ideal platform to analyze,
model, and forecast outcomes so that we can
significantly reduce the cost of harvesting,” says
Jim Mosher, director of harvest/science man-
agement, Clearwater Seafoods Limited. “More
importantly, it enables us to plan our activities in
a much broader context so that we can fulfill our
core commitment to long-term sustainability.”
	 In addition to resource analysis, fisher-
ies must strategically route ships to ensure
sustainability and reduce fuel emissions.
With a large and diverse fleet of oceangoing
vessels along with rising fuel costs, Clearwater
decided to invest in technology that could
serve as a platform to intersect and analyze
diverse data.
	 Clearwater selected Esri’s ArcGIS for
Desktop and the Spatial Analyst extension to
study fish resources and population dynam-
ics. This technology enables the company
to overlay spatial and temporal fishing data,
including bathymetry (the study of under-
water depth and ocean floors), sediment
types, survey data, harvest areas, and benthic
habitat, to quickly identify potential growth
areas. Staff can also factor in weather influ-
ences, species biology, lunar cycles, and other
relevant data to determine the most effective
methods of harvesting resources.
 Historic data depicts the spatial distribution of lobster catch per trap along the southern coast of Nova Scotia.
continued on page 5
3Spring 2013  esri.com/agriculture
Australia’s 7.69 million square kilometers of
land are arguably its most valuable natural
asset, particularly when it comes to the na-
tion’s food security. But this vast landscape’s
geographic diversity means that developing
and maintaining detailed, accurate soil infor-
mation—crucial to the effective management
of the agribusiness sector—is no easy feat.
	 Traditionally, soil records have only been
available in hard copy, and since soil data
was managed differently by the states and
territories, the records were sometimes dif-
ficult to locate. To ensure the nation’s soil data
could be properly maintained and accessed,
the Australian Collaborative Land Evaluation
Program (ACLEP) identified the need for a
nationally consistent and publicly available
land and soil information system.
	 ACLEP partnered with Esri’s distributor in
Australia, Esri Australia Pty. Ltd., to overhaul
existing disparate information systems
and develop an online portal for national
soil data management and delivery. Using
ACLEP Digs Deep to Create
National Soil Database
Courtesy of Esri Australia Pty. Ltd.
 Australian Soil Resource Information System (detail)
 Soil Sample: Red Kurosol  Soil Sample: Semiaquic Podosol
4 Esri News for Agriculture  Spring 2013
ArcGIS Spatial Analyst is used to facilitate
interpolation techniques. Leveraging this tool,
complex surfaces can be analyzed to reveal
patterns that may not be readily apparent
in raw data. The density, magnitude, and
concentration of underwater harvest species
can be measured at strategically dispersed
sample locations and then extrapolated to ac-
curately predict values in other locations. This
makes it significantly easier to uncover high
concentrations of harvest species and take a
more targeted approach to operations.
	 Through access to a geodatabase of histori-
cal data, the company can identify trends
based on what was accomplished in previous
years and plan fishing activities to maximize
output. Historical data can also be analyzed to
ensure that harvest species are not overfished,
a critical objective of responsible fishing
practices.
	 A more strategic approach to vessel routing
has enabled Clearwater to significantly reduce
harvesting costs and take steps toward
effectively reducing its carbon footprint. By
equipping its fleet with sophisticated habitat
imaging and vessel monitoring systems, the
company has also been able to ensure that
only targeted areas are fished.
	 Access to a GIS-based database further
supports targeted activities by enabling
analysts to review historic data. Overlaying
this historical information with survey data
makes it easy to readily identify areas that
have already been harvested, supporting the
spatial management of resources. They can
also leverage patterns in the data to model
and predict where there is most likely to be an
abundance of harvest species.
	 As an environmental leader, Clearwater
recognizes the importance of long-term sus-
tainability and works toward ensuring that all
harvesting activities promote a healthy ocean
environment. GIS provides the company with
a cost-effective tool to intersect diverse data-
sets so that Clearwater can better understand
targeted resources and their connections to
the broader ecosystem. As a result, the com-
pany is able to take an informed approach to
harvesting that limits the impact of fishing
activities and promotes sustainability both at
sea and on land.
Clearwater Seafoods Achieves
Sustainable Operations
through GIS
continued from page 3
cutting-edge ArcGIS technology to literally
map the geographic elements contained
within the data, ACLEP developed the
Australian Soil Resource Information System
(ASRIS), a publicly accessible interactive map-
ping website.
	 ASRIS is underpinned by Australia’s first
comprehensive, nationally consistent soil data-
base, which integrates land and soil data from
all state and territory databases. Soil is a vital
part of the equation in any development or
agricultural project, as it determines to a large
extent how the land may be used. For example,
agricultural industries can use ASRIS to make
informed management decisions by consider-
ing soil-related issues such as water holding
capacity, erodibility, or salinity. Developers can
also use ASRIS to identify soil types prior to
building commencement, potentially avoiding
costly problems associated with excavation,
swelling clays, and unstable land.
	 David Jacquier, land and water project man-
ager for the Commonwealth Scientific and
Industrial Research Organisation (CSIRO), says
that GIS technology provides the public and
agribusiness stakeholders with instant access
to essential land and soil information.
	 “By making all the country’s soil data avail-
able through one mapping interface, ASRIS
presents complex information in an accessible
format that transcends a user’s education, lan-
guage, and technical experience,” says Jacquier.
“Users select the area they’re interested in learn-
ing about, and with a click of their mouse, they
can see soil data and information that previously
might have taken hours or days to locate.”
	 ASRIS mapping tools benefit a multitude of
industries and individuals, including gov-
ernment departments, agricultural groups,
researchers, developers, and the broader
community. “Streamlining the way these
stakeholders access soil data is an enormous
step toward our goal of better matching land
use with land suitability,” says Jacquier.
	 ASRIS contains seven levels of soil and
land data—which can be switched on and
off depending on the detail of information
required—and provides general descriptions
of soil types and landforms as well as more
detailed information on properties such as
soil depth, texture, and acidity. By streamlin-
ing access to soil information, ASRIS enhances
regional growth and sustainability by improv-
ing the understanding of soils and ensuring
suitability for development.
	 “Soil data is vital to our environmental
sustainability, and with GIS technology, this
information is now more readily available in a
useful, consistent format,” concludes Jacquier.
Agriculture researcher Susana
Crespo has joined Esri’s natural re-
sources team as its new agriculture
specialist. Crespo was a research
analyst for HarvestChoice, part of
the International Food Policy Research Institute
(IFPRI) before moving to Esri. She received her
master’s degree in international development
and social change from Clark University in
Worcester, Massachusetts.
	 “Susana is a welcome addition to our team,”
says Geoff Wade, natural resources man-
ager. “She brings a wealth of experience and
passion in applying Esri solutions to critical
challenges in the agriculture industry.”
	 At HarvestChoice, Crespo designed solu-
tions for managing global agriculture spatial
datasets, which supported IFPRI’s efforts
to collaborate and share spatial data across
International Researcher to Help
Guide Esri’s Agriculture Initiatives
centers to minimize duplication and maximize
access to that information.
	 “I believe that a more fluid flow of informa-
tion leads to increased food security, more
adaptive climate mitigation strategies, and
better use of scarce financial and natural
resources worldwide,” says Crespo. “It is my
purpose to support these endeavors through
the smart adoption and application of spatial
technology, and being part of Esri’s natural
resources team will help me advance these
goals while supporting the team’s mission.”
E-mail Susana Crespo at
screspo@esri.com or follow
her on Twitter:
@AgMapper.
5Spring 2013  esri.com/agriculture
A map can be a powerful visual tool, but can
a map help solve world hunger, rejuvenate
agricultural soil, and prevent mosquito-borne
infections? Can a map help slow global warm-
ing and spur sustainable economic develop-
ment in tropical regions around the world?
Perhaps a map alone can’t do these things,
but a map can help display the real potential
of a very special tree, the breadfruit.
	 Breadfruit (Artocarpus altilis) is a tropical
tree originally from Papua New Guinea with
a rich and storied history. This starchy staple
crop has been grown in the Pacific for close
to 3,000 years and was introduced to other
tropical regions more than 200 years ago. The
trees are easy to grow and thrive under a wide
range of ecological conditions, producing
abundant, nutritious food for decades without
the labor, fertilizer, and chemicals used to
grow field crops.
	 These multipurpose trees improve soil
conditions and protect watersheds while
providing food, timber, and animal feed. All
parts of the tree are used—even the male
flowers, which are dried and burned to repel
mosquitoes. Because of its multiple uses
and long, productive, low-maintenance life,
Will Breadfruit Solve the World Hunger Crisis?
New Developments in an Innovative Food Crop
By Matthew P. Lucas and Diane Ragone, National Tropical Botanical Garden
 This map is based on the 2011 Global Hunger Index score displayed per country.
 Breadfruit is extremely productive, producing an average of 150–200 and up to as many as
600 nutritious fruits per season.
breadfruit was spread throughout the tropical
Pacific by intrepid voyagers. Hawaii is one
of the many island chains where breadfruit,
or ulu in Hawaiian, was cultivated as a major
staple. It is fitting that now Hawaii is home to
the headquarters of an organization devoted
to promoting the conservation and use of
breadfruit for food and reforestation around
the world.
	 The Breadfruit Institute, within the nonprofit
National Tropical Botanical Garden (NTBG),
is a major center for the tree’s conservation
and research of more than 120 varieties from
throughout the Pacific, making it the world’s
largest repository of breadfruit. As a result of
this work, the institute has received requests
from numerous countries seeking quality
breadfruit varieties for tree-planting projects.
To address this need, the Breadfruit Institute
has developed innovative propagation
methods, making it possible to produce and
ship thousands, or even millions, of breadfruit
plants anywhere in the world.
	 These breadfruit tree-planting projects can
help alleviate hunger and support sustainable
agriculture, agroforestry, and income genera-
tion. Most of the world’s one billion hungry
people live in the tropics—the same region
where breadfruit can be grown. However, as
Dr. Diane Ragone, author and director of the
Breadfruit Institute, has learned, stating these
facts and illustrating them are two very differ-
ent things. A strong realization is made when a
person sees the data from the United Nations
Food and Agriculture Organization global map
on world hunger coupled with a map showing
areas suitable for growing breadfruit.
	 It was originally this type of powerful visual
aid Ragone wanted when she began working
with NTBG’s GIS coordinator and coauthor
Matthew Lucas. To create such a map, Lucas
began by constructing a model within ArcGIS
using WorldClim 30-second resolution
global raster datasets of interpolated climate
6 Esri News for Agriculture  Spring 2013
 Different varieties of breadfruit are conserved in the world’s largest collection of breadfruit
at the Breadfruit Institute in Hawaii. (Photo credit: © Jim Wiseman, courtesy of the Breadfruit
Institute)
 Map showing zones of “best” and “suitable” growing conditions for breadfruit.
conditions compiled from the past 50 years
(Hijmans et al. 2005). With the GIS, monthly
rainfall and temperature data was condensed
into total annual rainfall, mean annual tem-
perature, and minimum and maximum annual
temperature. Then, the annual climate data
was reclassified.
	 “Suitable” and “best” ranges of rainfall and
temperature were identified after referring
to the breadfruit profile written by Ragone
for Traditional Trees of Pacific Islands (Elevitch
2006). The best ranges in mean temperature
and rainfall were given a value of 2, whereas
suitable conditions were given a value of 1;
conditions that were deemed too low or high
were given a value of -10. ArcGIS was used to
combine all the reclassified climate datasets.
The final output resulted in a global dataset
that now displayed areas deemed unsuitable
for growing breadfruit as < 0, areas assumed
suitable with a value of < 4 and > 0, and
best areas with a value of 4. This data was
displayed in combination with 2011 Global
Hunger Index scores entered into a vector
dataset of countries. The resultant map helps
the viewer see the real potential breadfruit
development has for tropical regions.
	 With this new visual aid completed, Ragone
and Josh Schneider, cofounder of Cultivaris/
Global Breadfruit, a horticultural partner that
propagates breadfruit trees for global distribu-
tion, attended the World Food Prize sympo-
sium in October 2011. The breadfruit suitability
map was shared with Calestous Juma, professor
of the practice of international development
and director of the Science, Technology, and
Globalization Project at the Belfer Center for
Science and International Affairs at the Harvard
Kennedy School. Juma has extensive experi-
ence and contacts in Africa.
	 The map was also shared with the former
president of Nigeria, Olusegun Obasanjo. It
was at Obasanjo’s invitation that Schneider vis-
ited Nigeria and met with government officials
and researchers to discuss breadfruit planting
projects. Due to the relatively fine scale (1 km)
of the original datasets, a more detailed map
of Nigeria showing areas suitable for growing
breadfruit, along with roads and cities, was an
invaluable tool during discussions.
	 The World Food Prize meeting also inspired
the creation of similar country-specific maps
that have been shared with organizations and
individuals working in Haiti, Ghana, Jamaica,
Central America, and China. The maps
provide government officials, foundations,
and potential donors with clear information
about the potential of breadfruit in specific
areas. The maps have spurred the question,
What countries are best suited for growing
breadfruit? ArcGIS was used to combine the
breadfruit suitability data with a vector layer of
country borders. This not only resulted in a list
of countries that could grow breadfruit but also
made it easy to identify and rank the amount of
area each country has that is suitable and best
for growing breadfruit.
	 It became clear that this map, the data
within it, and the ArcGIS methodology used
to construct it provided not only a power-
ful visual aid but also a useful research tool.
Armed with such maps and the information
they convey, Lucas and Ragone are continuing
to pair what has been learned about bread-
fruit cultivation with ArcGIS to help under-
stand and display future breadfruit potential.
They are currently working on a climate
change analysis that uses datasets of various
future climate models and scenarios in an at-
tempt to quantify areas that have the highest
likelihood of sustainable breadfruit develop-
ment. They are also working on publishing
an online map displaying global breadfruit
growing potential. Finally, it is the hope of
the Breadfruit Institute and NTBG that future
breadfruit development will be expanded
and that ArcGIS will help guide potential
breadfruit-growing countries in planning and
implementing planting projects of this very
special tree.
7Spring 2013  esri.com/agriculture
Presorted
Standard
US Postage
Paid
Esri
380 New York Street
Redlands, California 92373-8100  usa
133937  xxxx7.2M4/13sp
Esri International User Conference
You are GIS.
You gain knowledge, share expertise, and help us understand our world.
There’s a place where GIS goes beyond coordinates, breaks free of categories, and reaches past
analysis. A place where products are launched, ideas are shared, and inspiration is set loose.
Join us at the Esri UC. Register today at esri.com/ucagriculture.
United we map!
Esri International User Conference
July 8–12, 2013 | San Diego Convention Center

More Related Content

Similar to Esri News for Agriculture Spring 2013 issue

Esri News for Oceans Fall 2012 newsletter
Esri News for Oceans Fall 2012 newsletterEsri News for Oceans Fall 2012 newsletter
Esri News for Oceans Fall 2012 newsletterEsri
 
Tanaka_FishTechbyOceanEyes.pdf
Tanaka_FishTechbyOceanEyes.pdfTanaka_FishTechbyOceanEyes.pdf
Tanaka_FishTechbyOceanEyes.pdfkasahara2
 
GIS for Maritime Users
GIS for Maritime UsersGIS for Maritime Users
GIS for Maritime UsersEsri
 
Spring 2013
Spring 2013Spring 2013
Spring 2013Esri
 
FY 2013 R&D REPORT January 6 2014 - National Oceanic and Atmospheric Administ...
FY 2013 R&D REPORT January 6 2014 - National Oceanic and Atmospheric Administ...FY 2013 R&D REPORT January 6 2014 - National Oceanic and Atmospheric Administ...
FY 2013 R&D REPORT January 6 2014 - National Oceanic and Atmospheric Administ...Lyle Birkey
 
Spring 2013
Spring 2013Spring 2013
Spring 2013Esri
 
Xeriscape North Carolina
Xeriscape North CarolinaXeriscape North Carolina
Xeriscape North CarolinaSimm846q
 
Using Systems Engineering Technology to Improve Efficiency of Small Oyster Fa...
Using Systems Engineering Technology to Improve Efficiency of Small Oyster Fa...Using Systems Engineering Technology to Improve Efficiency of Small Oyster Fa...
Using Systems Engineering Technology to Improve Efficiency of Small Oyster Fa...IRJET Journal
 
Fisheries Data Interoperability WG - Anton Ellenbroek FAO
Fisheries Data Interoperability WG - Anton Ellenbroek FAOFisheries Data Interoperability WG - Anton Ellenbroek FAO
Fisheries Data Interoperability WG - Anton Ellenbroek FAOBlue BRIDGE
 
SAGB Conference 2013 - Speaker Summaries
SAGB Conference 2013 - Speaker SummariesSAGB Conference 2013 - Speaker Summaries
SAGB Conference 2013 - Speaker SummariesShellfish Association
 
2013 Uplift Report: Quantifying Ecological Uplift
2013 Uplift Report: Quantifying Ecological Uplift2013 Uplift Report: Quantifying Ecological Uplift
2013 Uplift Report: Quantifying Ecological UpliftThe Freshwater Trust
 
Exploring the role of aquaculture in our marine space
Exploring the role of aquaculture in our marine spaceExploring the role of aquaculture in our marine space
Exploring the role of aquaculture in our marine spaceMcGuinness Institute
 
NAVIGATION ALERT SYSTEM FOR FISHERMEN WITH SOLAR POWER HARVESTING
NAVIGATION ALERT SYSTEM FOR FISHERMEN WITH SOLAR POWER HARVESTINGNAVIGATION ALERT SYSTEM FOR FISHERMEN WITH SOLAR POWER HARVESTING
NAVIGATION ALERT SYSTEM FOR FISHERMEN WITH SOLAR POWER HARVESTINGAM Publications
 
GIS-Based Web Services Provide Rapid Analysis and Dissemination of Maritime Data
GIS-Based Web Services Provide Rapid Analysis and Dissemination of Maritime DataGIS-Based Web Services Provide Rapid Analysis and Dissemination of Maritime Data
GIS-Based Web Services Provide Rapid Analysis and Dissemination of Maritime DataEsri
 
Fairclough et al 2014 citizen science in fisheries science
Fairclough et al 2014 citizen science in fisheries scienceFairclough et al 2014 citizen science in fisheries science
Fairclough et al 2014 citizen science in fisheries scienceDavid Fairclough
 
Coffin landsat8 data in social values for ecosytem services
Coffin landsat8 data in social values for ecosytem servicesCoffin landsat8 data in social values for ecosytem services
Coffin landsat8 data in social values for ecosytem servicesGeCo in the Rockies
 
Coffin landsat8 data in social values for ecosytem services
Coffin landsat8 data in social values for ecosytem servicesCoffin landsat8 data in social values for ecosytem services
Coffin landsat8 data in social values for ecosytem servicesGeCo in the Rockies
 
Ocean GIS Initiative
Ocean GIS InitiativeOcean GIS Initiative
Ocean GIS InitiativeEsri
 

Similar to Esri News for Agriculture Spring 2013 issue (20)

Esri News for Oceans Fall 2012 newsletter
Esri News for Oceans Fall 2012 newsletterEsri News for Oceans Fall 2012 newsletter
Esri News for Oceans Fall 2012 newsletter
 
The Oceans and Fisheries Partnership / Len Garces
The Oceans and Fisheries Partnership / Len GarcesThe Oceans and Fisheries Partnership / Len Garces
The Oceans and Fisheries Partnership / Len Garces
 
Tanaka_FishTechbyOceanEyes.pdf
Tanaka_FishTechbyOceanEyes.pdfTanaka_FishTechbyOceanEyes.pdf
Tanaka_FishTechbyOceanEyes.pdf
 
GIS for Maritime Users
GIS for Maritime UsersGIS for Maritime Users
GIS for Maritime Users
 
Spring 2013
Spring 2013Spring 2013
Spring 2013
 
FY 2013 R&D REPORT January 6 2014 - National Oceanic and Atmospheric Administ...
FY 2013 R&D REPORT January 6 2014 - National Oceanic and Atmospheric Administ...FY 2013 R&D REPORT January 6 2014 - National Oceanic and Atmospheric Administ...
FY 2013 R&D REPORT January 6 2014 - National Oceanic and Atmospheric Administ...
 
Spring 2013
Spring 2013Spring 2013
Spring 2013
 
Xeriscape North Carolina
Xeriscape North CarolinaXeriscape North Carolina
Xeriscape North Carolina
 
Using Systems Engineering Technology to Improve Efficiency of Small Oyster Fa...
Using Systems Engineering Technology to Improve Efficiency of Small Oyster Fa...Using Systems Engineering Technology to Improve Efficiency of Small Oyster Fa...
Using Systems Engineering Technology to Improve Efficiency of Small Oyster Fa...
 
Fisheries Data Interoperability WG - Anton Ellenbroek FAO
Fisheries Data Interoperability WG - Anton Ellenbroek FAOFisheries Data Interoperability WG - Anton Ellenbroek FAO
Fisheries Data Interoperability WG - Anton Ellenbroek FAO
 
SAGB Conference 2013 - Speaker Summaries
SAGB Conference 2013 - Speaker SummariesSAGB Conference 2013 - Speaker Summaries
SAGB Conference 2013 - Speaker Summaries
 
2013 Uplift Report: Quantifying Ecological Uplift
2013 Uplift Report: Quantifying Ecological Uplift2013 Uplift Report: Quantifying Ecological Uplift
2013 Uplift Report: Quantifying Ecological Uplift
 
Exploring the role of aquaculture in our marine space
Exploring the role of aquaculture in our marine spaceExploring the role of aquaculture in our marine space
Exploring the role of aquaculture in our marine space
 
NAVIGATION ALERT SYSTEM FOR FISHERMEN WITH SOLAR POWER HARVESTING
NAVIGATION ALERT SYSTEM FOR FISHERMEN WITH SOLAR POWER HARVESTINGNAVIGATION ALERT SYSTEM FOR FISHERMEN WITH SOLAR POWER HARVESTING
NAVIGATION ALERT SYSTEM FOR FISHERMEN WITH SOLAR POWER HARVESTING
 
GIS-Based Web Services Provide Rapid Analysis and Dissemination of Maritime Data
GIS-Based Web Services Provide Rapid Analysis and Dissemination of Maritime DataGIS-Based Web Services Provide Rapid Analysis and Dissemination of Maritime Data
GIS-Based Web Services Provide Rapid Analysis and Dissemination of Maritime Data
 
C sigma short abstract - v. 2
C sigma short abstract - v. 2C sigma short abstract - v. 2
C sigma short abstract - v. 2
 
Fairclough et al 2014 citizen science in fisheries science
Fairclough et al 2014 citizen science in fisheries scienceFairclough et al 2014 citizen science in fisheries science
Fairclough et al 2014 citizen science in fisheries science
 
Coffin landsat8 data in social values for ecosytem services
Coffin landsat8 data in social values for ecosytem servicesCoffin landsat8 data in social values for ecosytem services
Coffin landsat8 data in social values for ecosytem services
 
Coffin landsat8 data in social values for ecosytem services
Coffin landsat8 data in social values for ecosytem servicesCoffin landsat8 data in social values for ecosytem services
Coffin landsat8 data in social values for ecosytem services
 
Ocean GIS Initiative
Ocean GIS InitiativeOcean GIS Initiative
Ocean GIS Initiative
 

More from Esri

INIA- CISA: Análisis de las amenazas en la fauna silvestre
INIA- CISA: Análisis de las amenazas en la fauna silvestreINIA- CISA: Análisis de las amenazas en la fauna silvestre
INIA- CISA: Análisis de las amenazas en la fauna silvestreEsri
 
Aena Aeropuerto Adolfo Suárez-Barajas crea potentes aplicaciones para sus cli...
Aena Aeropuerto Adolfo Suárez-Barajas crea potentes aplicaciones para sus cli...Aena Aeropuerto Adolfo Suárez-Barajas crea potentes aplicaciones para sus cli...
Aena Aeropuerto Adolfo Suárez-Barajas crea potentes aplicaciones para sus cli...Esri
 
Plataforma Smart City de Móstoles
Plataforma Smart City de MóstolesPlataforma Smart City de Móstoles
Plataforma Smart City de MóstolesEsri
 
ArcGIS Online para Organizaciones
ArcGIS Online para OrganizacionesArcGIS Online para Organizaciones
ArcGIS Online para OrganizacionesEsri
 
Molina de Segura se convierte en una smart city
Molina de Segura se convierte en una smart cityMolina de Segura se convierte en una smart city
Molina de Segura se convierte en una smart cityEsri
 
Portal for ArcGIS
Portal for ArcGISPortal for ArcGIS
Portal for ArcGISEsri
 
An Effective Tool for Drinking Water Protection
An Effective Tool for Drinking Water ProtectionAn Effective Tool for Drinking Water Protection
An Effective Tool for Drinking Water ProtectionEsri
 
GeoCollector for ArcPad
GeoCollector for ArcPadGeoCollector for ArcPad
GeoCollector for ArcPadEsri
 
GeoCollector for ArcGIS for Windows Mobile
GeoCollector for ArcGIS for Windows MobileGeoCollector for ArcGIS for Windows Mobile
GeoCollector for ArcGIS for Windows MobileEsri
 
Data Appliance for ArcGIS
Data Appliance for ArcGISData Appliance for ArcGIS
Data Appliance for ArcGISEsri
 
Esri and BlackBridge
Esri and BlackBridgeEsri and BlackBridge
Esri and BlackBridgeEsri
 
GeoPlanner for ArcGIS
GeoPlanner for ArcGISGeoPlanner for ArcGIS
GeoPlanner for ArcGISEsri
 
Esri and AccuWeather
Esri and AccuWeatherEsri and AccuWeather
Esri and AccuWeatherEsri
 
Esri and Airbus Defense & Space
Esri and Airbus Defense & SpaceEsri and Airbus Defense & Space
Esri and Airbus Defense & SpaceEsri
 
Esri US Data Fact Sheet
Esri US Data Fact SheetEsri US Data Fact Sheet
Esri US Data Fact SheetEsri
 
ArcGIS for Server on Microsoft Azure Jumpstart
ArcGIS for Server on Microsoft Azure JumpstartArcGIS for Server on Microsoft Azure Jumpstart
ArcGIS for Server on Microsoft Azure JumpstartEsri
 
ArcGIS for the Military--Maritime Operations
ArcGIS for the Military--Maritime OperationsArcGIS for the Military--Maritime Operations
ArcGIS for the Military--Maritime OperationsEsri
 
Esri Geoportal Server
Esri Geoportal ServerEsri Geoportal Server
Esri Geoportal ServerEsri
 
ArcGIS GeoEvent Extension for Server
ArcGIS GeoEvent Extension for ServerArcGIS GeoEvent Extension for Server
ArcGIS GeoEvent Extension for ServerEsri
 
The NATO Core Geographic Services System
The NATO Core Geographic Services SystemThe NATO Core Geographic Services System
The NATO Core Geographic Services SystemEsri
 

More from Esri (20)

INIA- CISA: Análisis de las amenazas en la fauna silvestre
INIA- CISA: Análisis de las amenazas en la fauna silvestreINIA- CISA: Análisis de las amenazas en la fauna silvestre
INIA- CISA: Análisis de las amenazas en la fauna silvestre
 
Aena Aeropuerto Adolfo Suárez-Barajas crea potentes aplicaciones para sus cli...
Aena Aeropuerto Adolfo Suárez-Barajas crea potentes aplicaciones para sus cli...Aena Aeropuerto Adolfo Suárez-Barajas crea potentes aplicaciones para sus cli...
Aena Aeropuerto Adolfo Suárez-Barajas crea potentes aplicaciones para sus cli...
 
Plataforma Smart City de Móstoles
Plataforma Smart City de MóstolesPlataforma Smart City de Móstoles
Plataforma Smart City de Móstoles
 
ArcGIS Online para Organizaciones
ArcGIS Online para OrganizacionesArcGIS Online para Organizaciones
ArcGIS Online para Organizaciones
 
Molina de Segura se convierte en una smart city
Molina de Segura se convierte en una smart cityMolina de Segura se convierte en una smart city
Molina de Segura se convierte en una smart city
 
Portal for ArcGIS
Portal for ArcGISPortal for ArcGIS
Portal for ArcGIS
 
An Effective Tool for Drinking Water Protection
An Effective Tool for Drinking Water ProtectionAn Effective Tool for Drinking Water Protection
An Effective Tool for Drinking Water Protection
 
GeoCollector for ArcPad
GeoCollector for ArcPadGeoCollector for ArcPad
GeoCollector for ArcPad
 
GeoCollector for ArcGIS for Windows Mobile
GeoCollector for ArcGIS for Windows MobileGeoCollector for ArcGIS for Windows Mobile
GeoCollector for ArcGIS for Windows Mobile
 
Data Appliance for ArcGIS
Data Appliance for ArcGISData Appliance for ArcGIS
Data Appliance for ArcGIS
 
Esri and BlackBridge
Esri and BlackBridgeEsri and BlackBridge
Esri and BlackBridge
 
GeoPlanner for ArcGIS
GeoPlanner for ArcGISGeoPlanner for ArcGIS
GeoPlanner for ArcGIS
 
Esri and AccuWeather
Esri and AccuWeatherEsri and AccuWeather
Esri and AccuWeather
 
Esri and Airbus Defense & Space
Esri and Airbus Defense & SpaceEsri and Airbus Defense & Space
Esri and Airbus Defense & Space
 
Esri US Data Fact Sheet
Esri US Data Fact SheetEsri US Data Fact Sheet
Esri US Data Fact Sheet
 
ArcGIS for Server on Microsoft Azure Jumpstart
ArcGIS for Server on Microsoft Azure JumpstartArcGIS for Server on Microsoft Azure Jumpstart
ArcGIS for Server on Microsoft Azure Jumpstart
 
ArcGIS for the Military--Maritime Operations
ArcGIS for the Military--Maritime OperationsArcGIS for the Military--Maritime Operations
ArcGIS for the Military--Maritime Operations
 
Esri Geoportal Server
Esri Geoportal ServerEsri Geoportal Server
Esri Geoportal Server
 
ArcGIS GeoEvent Extension for Server
ArcGIS GeoEvent Extension for ServerArcGIS GeoEvent Extension for Server
ArcGIS GeoEvent Extension for Server
 
The NATO Core Geographic Services System
The NATO Core Geographic Services SystemThe NATO Core Geographic Services System
The NATO Core Geographic Services System
 

Recently uploaded

Apidays Singapore 2024 - Building Digital Trust in a Digital Economy by Veron...
Apidays Singapore 2024 - Building Digital Trust in a Digital Economy by Veron...Apidays Singapore 2024 - Building Digital Trust in a Digital Economy by Veron...
Apidays Singapore 2024 - Building Digital Trust in a Digital Economy by Veron...apidays
 
08448380779 Call Girls In Greater Kailash - I Women Seeking Men
08448380779 Call Girls In Greater Kailash - I Women Seeking Men08448380779 Call Girls In Greater Kailash - I Women Seeking Men
08448380779 Call Girls In Greater Kailash - I Women Seeking MenDelhi Call girls
 
04-2024-HHUG-Sales-and-Marketing-Alignment.pptx
04-2024-HHUG-Sales-and-Marketing-Alignment.pptx04-2024-HHUG-Sales-and-Marketing-Alignment.pptx
04-2024-HHUG-Sales-and-Marketing-Alignment.pptxHampshireHUG
 
How to Troubleshoot Apps for the Modern Connected Worker
How to Troubleshoot Apps for the Modern Connected WorkerHow to Troubleshoot Apps for the Modern Connected Worker
How to Troubleshoot Apps for the Modern Connected WorkerThousandEyes
 
Powerful Google developer tools for immediate impact! (2023-24 C)
Powerful Google developer tools for immediate impact! (2023-24 C)Powerful Google developer tools for immediate impact! (2023-24 C)
Powerful Google developer tools for immediate impact! (2023-24 C)wesley chun
 
How to Troubleshoot Apps for the Modern Connected Worker
How to Troubleshoot Apps for the Modern Connected WorkerHow to Troubleshoot Apps for the Modern Connected Worker
How to Troubleshoot Apps for the Modern Connected WorkerThousandEyes
 
08448380779 Call Girls In Civil Lines Women Seeking Men
08448380779 Call Girls In Civil Lines Women Seeking Men08448380779 Call Girls In Civil Lines Women Seeking Men
08448380779 Call Girls In Civil Lines Women Seeking MenDelhi Call girls
 
Axa Assurance Maroc - Insurer Innovation Award 2024
Axa Assurance Maroc - Insurer Innovation Award 2024Axa Assurance Maroc - Insurer Innovation Award 2024
Axa Assurance Maroc - Insurer Innovation Award 2024The Digital Insurer
 
Exploring the Future Potential of AI-Enabled Smartphone Processors
Exploring the Future Potential of AI-Enabled Smartphone ProcessorsExploring the Future Potential of AI-Enabled Smartphone Processors
Exploring the Future Potential of AI-Enabled Smartphone Processorsdebabhi2
 
Handwritten Text Recognition for manuscripts and early printed texts
Handwritten Text Recognition for manuscripts and early printed textsHandwritten Text Recognition for manuscripts and early printed texts
Handwritten Text Recognition for manuscripts and early printed textsMaria Levchenko
 
The Role of Taxonomy and Ontology in Semantic Layers - Heather Hedden.pdf
The Role of Taxonomy and Ontology in Semantic Layers - Heather Hedden.pdfThe Role of Taxonomy and Ontology in Semantic Layers - Heather Hedden.pdf
The Role of Taxonomy and Ontology in Semantic Layers - Heather Hedden.pdfEnterprise Knowledge
 
Scaling API-first – The story of a global engineering organization
Scaling API-first – The story of a global engineering organizationScaling API-first – The story of a global engineering organization
Scaling API-first – The story of a global engineering organizationRadu Cotescu
 
How to convert PDF to text with Nanonets
How to convert PDF to text with NanonetsHow to convert PDF to text with Nanonets
How to convert PDF to text with Nanonetsnaman860154
 
Bajaj Allianz Life Insurance Company - Insurer Innovation Award 2024
Bajaj Allianz Life Insurance Company - Insurer Innovation Award 2024Bajaj Allianz Life Insurance Company - Insurer Innovation Award 2024
Bajaj Allianz Life Insurance Company - Insurer Innovation Award 2024The Digital Insurer
 
Understanding Discord NSFW Servers A Guide for Responsible Users.pdf
Understanding Discord NSFW Servers A Guide for Responsible Users.pdfUnderstanding Discord NSFW Servers A Guide for Responsible Users.pdf
Understanding Discord NSFW Servers A Guide for Responsible Users.pdfUK Journal
 
presentation ICT roal in 21st century education
presentation ICT roal in 21st century educationpresentation ICT roal in 21st century education
presentation ICT roal in 21st century educationjfdjdjcjdnsjd
 
08448380779 Call Girls In Friends Colony Women Seeking Men
08448380779 Call Girls In Friends Colony Women Seeking Men08448380779 Call Girls In Friends Colony Women Seeking Men
08448380779 Call Girls In Friends Colony Women Seeking MenDelhi Call girls
 
Raspberry Pi 5: Challenges and Solutions in Bringing up an OpenGL/Vulkan Driv...
Raspberry Pi 5: Challenges and Solutions in Bringing up an OpenGL/Vulkan Driv...Raspberry Pi 5: Challenges and Solutions in Bringing up an OpenGL/Vulkan Driv...
Raspberry Pi 5: Challenges and Solutions in Bringing up an OpenGL/Vulkan Driv...Igalia
 
From Event to Action: Accelerate Your Decision Making with Real-Time Automation
From Event to Action: Accelerate Your Decision Making with Real-Time AutomationFrom Event to Action: Accelerate Your Decision Making with Real-Time Automation
From Event to Action: Accelerate Your Decision Making with Real-Time AutomationSafe Software
 
ProductAnonymous-April2024-WinProductDiscovery-MelissaKlemke
ProductAnonymous-April2024-WinProductDiscovery-MelissaKlemkeProductAnonymous-April2024-WinProductDiscovery-MelissaKlemke
ProductAnonymous-April2024-WinProductDiscovery-MelissaKlemkeProduct Anonymous
 

Recently uploaded (20)

Apidays Singapore 2024 - Building Digital Trust in a Digital Economy by Veron...
Apidays Singapore 2024 - Building Digital Trust in a Digital Economy by Veron...Apidays Singapore 2024 - Building Digital Trust in a Digital Economy by Veron...
Apidays Singapore 2024 - Building Digital Trust in a Digital Economy by Veron...
 
08448380779 Call Girls In Greater Kailash - I Women Seeking Men
08448380779 Call Girls In Greater Kailash - I Women Seeking Men08448380779 Call Girls In Greater Kailash - I Women Seeking Men
08448380779 Call Girls In Greater Kailash - I Women Seeking Men
 
04-2024-HHUG-Sales-and-Marketing-Alignment.pptx
04-2024-HHUG-Sales-and-Marketing-Alignment.pptx04-2024-HHUG-Sales-and-Marketing-Alignment.pptx
04-2024-HHUG-Sales-and-Marketing-Alignment.pptx
 
How to Troubleshoot Apps for the Modern Connected Worker
How to Troubleshoot Apps for the Modern Connected WorkerHow to Troubleshoot Apps for the Modern Connected Worker
How to Troubleshoot Apps for the Modern Connected Worker
 
Powerful Google developer tools for immediate impact! (2023-24 C)
Powerful Google developer tools for immediate impact! (2023-24 C)Powerful Google developer tools for immediate impact! (2023-24 C)
Powerful Google developer tools for immediate impact! (2023-24 C)
 
How to Troubleshoot Apps for the Modern Connected Worker
How to Troubleshoot Apps for the Modern Connected WorkerHow to Troubleshoot Apps for the Modern Connected Worker
How to Troubleshoot Apps for the Modern Connected Worker
 
08448380779 Call Girls In Civil Lines Women Seeking Men
08448380779 Call Girls In Civil Lines Women Seeking Men08448380779 Call Girls In Civil Lines Women Seeking Men
08448380779 Call Girls In Civil Lines Women Seeking Men
 
Axa Assurance Maroc - Insurer Innovation Award 2024
Axa Assurance Maroc - Insurer Innovation Award 2024Axa Assurance Maroc - Insurer Innovation Award 2024
Axa Assurance Maroc - Insurer Innovation Award 2024
 
Exploring the Future Potential of AI-Enabled Smartphone Processors
Exploring the Future Potential of AI-Enabled Smartphone ProcessorsExploring the Future Potential of AI-Enabled Smartphone Processors
Exploring the Future Potential of AI-Enabled Smartphone Processors
 
Handwritten Text Recognition for manuscripts and early printed texts
Handwritten Text Recognition for manuscripts and early printed textsHandwritten Text Recognition for manuscripts and early printed texts
Handwritten Text Recognition for manuscripts and early printed texts
 
The Role of Taxonomy and Ontology in Semantic Layers - Heather Hedden.pdf
The Role of Taxonomy and Ontology in Semantic Layers - Heather Hedden.pdfThe Role of Taxonomy and Ontology in Semantic Layers - Heather Hedden.pdf
The Role of Taxonomy and Ontology in Semantic Layers - Heather Hedden.pdf
 
Scaling API-first – The story of a global engineering organization
Scaling API-first – The story of a global engineering organizationScaling API-first – The story of a global engineering organization
Scaling API-first – The story of a global engineering organization
 
How to convert PDF to text with Nanonets
How to convert PDF to text with NanonetsHow to convert PDF to text with Nanonets
How to convert PDF to text with Nanonets
 
Bajaj Allianz Life Insurance Company - Insurer Innovation Award 2024
Bajaj Allianz Life Insurance Company - Insurer Innovation Award 2024Bajaj Allianz Life Insurance Company - Insurer Innovation Award 2024
Bajaj Allianz Life Insurance Company - Insurer Innovation Award 2024
 
Understanding Discord NSFW Servers A Guide for Responsible Users.pdf
Understanding Discord NSFW Servers A Guide for Responsible Users.pdfUnderstanding Discord NSFW Servers A Guide for Responsible Users.pdf
Understanding Discord NSFW Servers A Guide for Responsible Users.pdf
 
presentation ICT roal in 21st century education
presentation ICT roal in 21st century educationpresentation ICT roal in 21st century education
presentation ICT roal in 21st century education
 
08448380779 Call Girls In Friends Colony Women Seeking Men
08448380779 Call Girls In Friends Colony Women Seeking Men08448380779 Call Girls In Friends Colony Women Seeking Men
08448380779 Call Girls In Friends Colony Women Seeking Men
 
Raspberry Pi 5: Challenges and Solutions in Bringing up an OpenGL/Vulkan Driv...
Raspberry Pi 5: Challenges and Solutions in Bringing up an OpenGL/Vulkan Driv...Raspberry Pi 5: Challenges and Solutions in Bringing up an OpenGL/Vulkan Driv...
Raspberry Pi 5: Challenges and Solutions in Bringing up an OpenGL/Vulkan Driv...
 
From Event to Action: Accelerate Your Decision Making with Real-Time Automation
From Event to Action: Accelerate Your Decision Making with Real-Time AutomationFrom Event to Action: Accelerate Your Decision Making with Real-Time Automation
From Event to Action: Accelerate Your Decision Making with Real-Time Automation
 
ProductAnonymous-April2024-WinProductDiscovery-MelissaKlemke
ProductAnonymous-April2024-WinProductDiscovery-MelissaKlemkeProductAnonymous-April2024-WinProductDiscovery-MelissaKlemke
ProductAnonymous-April2024-WinProductDiscovery-MelissaKlemke
 

Esri News for Agriculture Spring 2013 issue

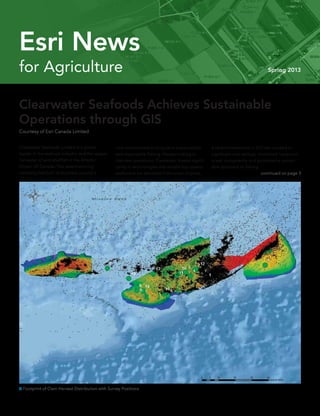
  • 1. for Agriculture Spring 2013 Esri News continued on page 3 Clearwater Seafoods Limited is a global leader in the seafood industry and the largest harvester of wild shellfish in the Atlantic Ocean off Canada. The award-winning company has built its business around a Clearwater Seafoods Achieves Sustainable Operations through GIS Courtesy of Esri Canada Limited core commitment to long-term sustainability and responsible fishing. Always looking to improve operations, Clearwater invests signifi- cantly in technologies that enable top-quality seafood to be delivered from ocean to plate. A recent investment in GIS has resulted in significant cost savings, minimized impact on ocean ecosystems, and promoted a sustain- able approach to fishing.  Footprint of Clam Harvest Distribution with Survey Positions
  • 2. Spring 2013 Esri News for Agriculture is a publication of the Agriculture Solutions Group of Esri. To contact the Esri Desktop Order Center, call 1-800-447-9778 within the United States or 909-793-2853, ext. 1-1235, outside the United States. Visit the Esri website at esri.com. View Esri News for Agriculture online at esri.com/agriculture or scan the code below with your smartphone. Advertise with Us E-mail ads@esri.com. Submit Content To submit articles for publication in Esri News for Agriculture, contact Jim Baumann at jbaumann@esri.com. Manage Your Subscription To update your mailing address or subscribe or unsubscribe to Esri publications, visit esri.com/publications. International customers should contact an Esri distributor to manage their subscriptions. For a directory of distributors, visit esri.com/distributors. Circulation Services For back issues, missed issues, and other circulation services, e-mail requests@esri.com; call 909-793-2853, extension 2778; or fax 909-798-0560. 2 Esri News for Agriculture  Spring 2013 Contents 1 Clearwater Seafoods Achieves Sustainable Operations through GIS 4 ACLEP Digs Deep to Create National Soil Database 6 Will Breadfruit Solve the World Hunger Crisis? The information contained in this work is the exclusive property of Esri or its licensors. This work is protected under United States copyright law and other international copyright treaties and conventions. No part of this work may be reproduced or transmitted in any form or by any means, electronic or mechanical, including photocopying and recording, or by any information storage or retrieval system, except as expressly permitted in writing by Esri. All requests should be sent to Attention: Contracts and Legal Services Manager, Esri, 380 New York Street, Redlands, CA 92373-8100 USA. The information contained in this work is subject to change without notice. The Geographic Advantage, Esri, the Esri globe logo, 3D Analyst, ArcAtlas, ArcCatalog, ArcData, ArcDoc, ArcEditor, ArcExplorer, ArcGIS, the ArcGIS logo, ArcGlobe, ArcIMS, ARC/INFO, ArcInfo, ArcLogistics, ArcMap, ArcNetwork, ArcNews, ArcObjects, ArcPad, ArcPress, ArcReader, ArcSDE, ArcSurvey, ArcToolbox, ArcTools, ArcUser, ArcView, ArcVoyager, ArcWatch, ArcWeb, ArcWorld, ArcXML, Business Analyst Online, BusinessMAP, CommunityInfo, EDN, Geography Network, GIS Day, MapData, MapObjects, Maplex, MapStudio, ModelBuilder, MOLE, NetEngine, RouteMAP, SDE, Sourcebook•America, StreetMap, Tapestry, @esri.com, esri.com, arcgis.com, geographynetwork.com, gis.com, and gisday.com are trademarks, service marks, or registered marks of Esri in the United States, the European Community, or certain other jurisdictions. Other companies and products or services mentioned herein may be trademarks, service marks, or registered marks of their respective mark owners. Copyright © 2013 Esri. All rights reserved. Printed in the United States of America.
  • 3. Based in Nova Scotia, Clearwater harvests, processes, markets, and sells premium shellfish and seafood to a variety of markets worldwide. The company must balance a high level of production with a commitment to responsible fisheries management—a practice that draws on science to ensure sus- tainable exploitation. As a largely geographic undertaking, sustainable fisheries manage- ment requires the ability to intersect and analyze many layers of data including species abundance and composition, feeding and reproduction, historical fishing efforts, and oceanographic/ecosystem conditions. Forecasting where and what type of harvest will be available is also a key component of responsible fishing. This can be achieved through assessment models that predict the Clearwater Seafoods Achieves Sustainable Operations through GIS  continued from cover location, stage of growth, and populations of various biomasses. Access to this information improves fishing success rates and also helps protect the ocean’s diverse ecosystems by minimizing impact on nontarget species. “GIS serves as the ideal platform to analyze, model, and forecast outcomes so that we can significantly reduce the cost of harvesting,” says Jim Mosher, director of harvest/science man- agement, Clearwater Seafoods Limited. “More importantly, it enables us to plan our activities in a much broader context so that we can fulfill our core commitment to long-term sustainability.” In addition to resource analysis, fisher- ies must strategically route ships to ensure sustainability and reduce fuel emissions. With a large and diverse fleet of oceangoing vessels along with rising fuel costs, Clearwater decided to invest in technology that could serve as a platform to intersect and analyze diverse data. Clearwater selected Esri’s ArcGIS for Desktop and the Spatial Analyst extension to study fish resources and population dynam- ics. This technology enables the company to overlay spatial and temporal fishing data, including bathymetry (the study of under- water depth and ocean floors), sediment types, survey data, harvest areas, and benthic habitat, to quickly identify potential growth areas. Staff can also factor in weather influ- ences, species biology, lunar cycles, and other relevant data to determine the most effective methods of harvesting resources.  Historic data depicts the spatial distribution of lobster catch per trap along the southern coast of Nova Scotia. continued on page 5 3Spring 2013  esri.com/agriculture
  • 4. Australia’s 7.69 million square kilometers of land are arguably its most valuable natural asset, particularly when it comes to the na- tion’s food security. But this vast landscape’s geographic diversity means that developing and maintaining detailed, accurate soil infor- mation—crucial to the effective management of the agribusiness sector—is no easy feat. Traditionally, soil records have only been available in hard copy, and since soil data was managed differently by the states and territories, the records were sometimes dif- ficult to locate. To ensure the nation’s soil data could be properly maintained and accessed, the Australian Collaborative Land Evaluation Program (ACLEP) identified the need for a nationally consistent and publicly available land and soil information system. ACLEP partnered with Esri’s distributor in Australia, Esri Australia Pty. Ltd., to overhaul existing disparate information systems and develop an online portal for national soil data management and delivery. Using ACLEP Digs Deep to Create National Soil Database Courtesy of Esri Australia Pty. Ltd.  Australian Soil Resource Information System (detail)  Soil Sample: Red Kurosol  Soil Sample: Semiaquic Podosol 4 Esri News for Agriculture  Spring 2013
  • 5. ArcGIS Spatial Analyst is used to facilitate interpolation techniques. Leveraging this tool, complex surfaces can be analyzed to reveal patterns that may not be readily apparent in raw data. The density, magnitude, and concentration of underwater harvest species can be measured at strategically dispersed sample locations and then extrapolated to ac- curately predict values in other locations. This makes it significantly easier to uncover high concentrations of harvest species and take a more targeted approach to operations. Through access to a geodatabase of histori- cal data, the company can identify trends based on what was accomplished in previous years and plan fishing activities to maximize output. Historical data can also be analyzed to ensure that harvest species are not overfished, a critical objective of responsible fishing practices. A more strategic approach to vessel routing has enabled Clearwater to significantly reduce harvesting costs and take steps toward effectively reducing its carbon footprint. By equipping its fleet with sophisticated habitat imaging and vessel monitoring systems, the company has also been able to ensure that only targeted areas are fished. Access to a GIS-based database further supports targeted activities by enabling analysts to review historic data. Overlaying this historical information with survey data makes it easy to readily identify areas that have already been harvested, supporting the spatial management of resources. They can also leverage patterns in the data to model and predict where there is most likely to be an abundance of harvest species. As an environmental leader, Clearwater recognizes the importance of long-term sus- tainability and works toward ensuring that all harvesting activities promote a healthy ocean environment. GIS provides the company with a cost-effective tool to intersect diverse data- sets so that Clearwater can better understand targeted resources and their connections to the broader ecosystem. As a result, the com- pany is able to take an informed approach to harvesting that limits the impact of fishing activities and promotes sustainability both at sea and on land. Clearwater Seafoods Achieves Sustainable Operations through GIS continued from page 3 cutting-edge ArcGIS technology to literally map the geographic elements contained within the data, ACLEP developed the Australian Soil Resource Information System (ASRIS), a publicly accessible interactive map- ping website. ASRIS is underpinned by Australia’s first comprehensive, nationally consistent soil data- base, which integrates land and soil data from all state and territory databases. Soil is a vital part of the equation in any development or agricultural project, as it determines to a large extent how the land may be used. For example, agricultural industries can use ASRIS to make informed management decisions by consider- ing soil-related issues such as water holding capacity, erodibility, or salinity. Developers can also use ASRIS to identify soil types prior to building commencement, potentially avoiding costly problems associated with excavation, swelling clays, and unstable land. David Jacquier, land and water project man- ager for the Commonwealth Scientific and Industrial Research Organisation (CSIRO), says that GIS technology provides the public and agribusiness stakeholders with instant access to essential land and soil information. “By making all the country’s soil data avail- able through one mapping interface, ASRIS presents complex information in an accessible format that transcends a user’s education, lan- guage, and technical experience,” says Jacquier. “Users select the area they’re interested in learn- ing about, and with a click of their mouse, they can see soil data and information that previously might have taken hours or days to locate.” ASRIS mapping tools benefit a multitude of industries and individuals, including gov- ernment departments, agricultural groups, researchers, developers, and the broader community. “Streamlining the way these stakeholders access soil data is an enormous step toward our goal of better matching land use with land suitability,” says Jacquier. ASRIS contains seven levels of soil and land data—which can be switched on and off depending on the detail of information required—and provides general descriptions of soil types and landforms as well as more detailed information on properties such as soil depth, texture, and acidity. By streamlin- ing access to soil information, ASRIS enhances regional growth and sustainability by improv- ing the understanding of soils and ensuring suitability for development. “Soil data is vital to our environmental sustainability, and with GIS technology, this information is now more readily available in a useful, consistent format,” concludes Jacquier. Agriculture researcher Susana Crespo has joined Esri’s natural re- sources team as its new agriculture specialist. Crespo was a research analyst for HarvestChoice, part of the International Food Policy Research Institute (IFPRI) before moving to Esri. She received her master’s degree in international development and social change from Clark University in Worcester, Massachusetts. “Susana is a welcome addition to our team,” says Geoff Wade, natural resources man- ager. “She brings a wealth of experience and passion in applying Esri solutions to critical challenges in the agriculture industry.” At HarvestChoice, Crespo designed solu- tions for managing global agriculture spatial datasets, which supported IFPRI’s efforts to collaborate and share spatial data across International Researcher to Help Guide Esri’s Agriculture Initiatives centers to minimize duplication and maximize access to that information. “I believe that a more fluid flow of informa- tion leads to increased food security, more adaptive climate mitigation strategies, and better use of scarce financial and natural resources worldwide,” says Crespo. “It is my purpose to support these endeavors through the smart adoption and application of spatial technology, and being part of Esri’s natural resources team will help me advance these goals while supporting the team’s mission.” E-mail Susana Crespo at screspo@esri.com or follow her on Twitter: @AgMapper. 5Spring 2013  esri.com/agriculture
  • 6. A map can be a powerful visual tool, but can a map help solve world hunger, rejuvenate agricultural soil, and prevent mosquito-borne infections? Can a map help slow global warm- ing and spur sustainable economic develop- ment in tropical regions around the world? Perhaps a map alone can’t do these things, but a map can help display the real potential of a very special tree, the breadfruit. Breadfruit (Artocarpus altilis) is a tropical tree originally from Papua New Guinea with a rich and storied history. This starchy staple crop has been grown in the Pacific for close to 3,000 years and was introduced to other tropical regions more than 200 years ago. The trees are easy to grow and thrive under a wide range of ecological conditions, producing abundant, nutritious food for decades without the labor, fertilizer, and chemicals used to grow field crops. These multipurpose trees improve soil conditions and protect watersheds while providing food, timber, and animal feed. All parts of the tree are used—even the male flowers, which are dried and burned to repel mosquitoes. Because of its multiple uses and long, productive, low-maintenance life, Will Breadfruit Solve the World Hunger Crisis? New Developments in an Innovative Food Crop By Matthew P. Lucas and Diane Ragone, National Tropical Botanical Garden  This map is based on the 2011 Global Hunger Index score displayed per country.  Breadfruit is extremely productive, producing an average of 150–200 and up to as many as 600 nutritious fruits per season. breadfruit was spread throughout the tropical Pacific by intrepid voyagers. Hawaii is one of the many island chains where breadfruit, or ulu in Hawaiian, was cultivated as a major staple. It is fitting that now Hawaii is home to the headquarters of an organization devoted to promoting the conservation and use of breadfruit for food and reforestation around the world. The Breadfruit Institute, within the nonprofit National Tropical Botanical Garden (NTBG), is a major center for the tree’s conservation and research of more than 120 varieties from throughout the Pacific, making it the world’s largest repository of breadfruit. As a result of this work, the institute has received requests from numerous countries seeking quality breadfruit varieties for tree-planting projects. To address this need, the Breadfruit Institute has developed innovative propagation methods, making it possible to produce and ship thousands, or even millions, of breadfruit plants anywhere in the world. These breadfruit tree-planting projects can help alleviate hunger and support sustainable agriculture, agroforestry, and income genera- tion. Most of the world’s one billion hungry people live in the tropics—the same region where breadfruit can be grown. However, as Dr. Diane Ragone, author and director of the Breadfruit Institute, has learned, stating these facts and illustrating them are two very differ- ent things. A strong realization is made when a person sees the data from the United Nations Food and Agriculture Organization global map on world hunger coupled with a map showing areas suitable for growing breadfruit. It was originally this type of powerful visual aid Ragone wanted when she began working with NTBG’s GIS coordinator and coauthor Matthew Lucas. To create such a map, Lucas began by constructing a model within ArcGIS using WorldClim 30-second resolution global raster datasets of interpolated climate 6 Esri News for Agriculture  Spring 2013
  • 7.  Different varieties of breadfruit are conserved in the world’s largest collection of breadfruit at the Breadfruit Institute in Hawaii. (Photo credit: © Jim Wiseman, courtesy of the Breadfruit Institute)  Map showing zones of “best” and “suitable” growing conditions for breadfruit. conditions compiled from the past 50 years (Hijmans et al. 2005). With the GIS, monthly rainfall and temperature data was condensed into total annual rainfall, mean annual tem- perature, and minimum and maximum annual temperature. Then, the annual climate data was reclassified. “Suitable” and “best” ranges of rainfall and temperature were identified after referring to the breadfruit profile written by Ragone for Traditional Trees of Pacific Islands (Elevitch 2006). The best ranges in mean temperature and rainfall were given a value of 2, whereas suitable conditions were given a value of 1; conditions that were deemed too low or high were given a value of -10. ArcGIS was used to combine all the reclassified climate datasets. The final output resulted in a global dataset that now displayed areas deemed unsuitable for growing breadfruit as < 0, areas assumed suitable with a value of < 4 and > 0, and best areas with a value of 4. This data was displayed in combination with 2011 Global Hunger Index scores entered into a vector dataset of countries. The resultant map helps the viewer see the real potential breadfruit development has for tropical regions. With this new visual aid completed, Ragone and Josh Schneider, cofounder of Cultivaris/ Global Breadfruit, a horticultural partner that propagates breadfruit trees for global distribu- tion, attended the World Food Prize sympo- sium in October 2011. The breadfruit suitability map was shared with Calestous Juma, professor of the practice of international development and director of the Science, Technology, and Globalization Project at the Belfer Center for Science and International Affairs at the Harvard Kennedy School. Juma has extensive experi- ence and contacts in Africa. The map was also shared with the former president of Nigeria, Olusegun Obasanjo. It was at Obasanjo’s invitation that Schneider vis- ited Nigeria and met with government officials and researchers to discuss breadfruit planting projects. Due to the relatively fine scale (1 km) of the original datasets, a more detailed map of Nigeria showing areas suitable for growing breadfruit, along with roads and cities, was an invaluable tool during discussions. The World Food Prize meeting also inspired the creation of similar country-specific maps that have been shared with organizations and individuals working in Haiti, Ghana, Jamaica, Central America, and China. The maps provide government officials, foundations, and potential donors with clear information about the potential of breadfruit in specific areas. The maps have spurred the question, What countries are best suited for growing breadfruit? ArcGIS was used to combine the breadfruit suitability data with a vector layer of country borders. This not only resulted in a list of countries that could grow breadfruit but also made it easy to identify and rank the amount of area each country has that is suitable and best for growing breadfruit. It became clear that this map, the data within it, and the ArcGIS methodology used to construct it provided not only a power- ful visual aid but also a useful research tool. Armed with such maps and the information they convey, Lucas and Ragone are continuing to pair what has been learned about bread- fruit cultivation with ArcGIS to help under- stand and display future breadfruit potential. They are currently working on a climate change analysis that uses datasets of various future climate models and scenarios in an at- tempt to quantify areas that have the highest likelihood of sustainable breadfruit develop- ment. They are also working on publishing an online map displaying global breadfruit growing potential. Finally, it is the hope of the Breadfruit Institute and NTBG that future breadfruit development will be expanded and that ArcGIS will help guide potential breadfruit-growing countries in planning and implementing planting projects of this very special tree. 7Spring 2013  esri.com/agriculture
  • 8. Presorted Standard US Postage Paid Esri 380 New York Street Redlands, California 92373-8100  usa 133937  xxxx7.2M4/13sp Esri International User Conference You are GIS. You gain knowledge, share expertise, and help us understand our world. There’s a place where GIS goes beyond coordinates, breaks free of categories, and reaches past analysis. A place where products are launched, ideas are shared, and inspiration is set loose. Join us at the Esri UC. Register today at esri.com/ucagriculture. United we map! Esri International User Conference July 8–12, 2013 | San Diego Convention Center