P. B. Andersen, "Electric vehicles in a Distributed and Integrated market using Sustainable energy and Open Networks " in Integrating Electric Vehicles Into Modern Power Networks, DTU, Copenhagen, 2010
Similar to P. B. Andersen, "Electric vehicles in a Distributed and Integrated market using Sustainable energy and Open Networks " in Integrating Electric Vehicles Into Modern Power Networks, DTU, Copenhagen, 2010
Similar to P. B. Andersen, "Electric vehicles in a Distributed and Integrated market using Sustainable energy and Open Networks " in Integrating Electric Vehicles Into Modern Power Networks, DTU, Copenhagen, 2010 (20)
P. B. Andersen, "Electric vehicles in a Distributed and Integrated market using Sustainable energy and Open Networks " in Integrating Electric Vehicles Into Modern Power Networks, DTU, Copenhagen, 2010
1. PLUG-IN HYBRID ELECTRIC VEHICLES AS REGULATING POWER PROVIDERS:
CASE STUDIES OF SWEDEN AND GERMANY
Andersson, S‐La1; Elofsson, A. K.b; Galus, M. D.b; Göransson, L.a; Karlsson, S.a; Johnsson, F.a;
Andersson, G.b
a
Department of Energy and the Environment, Chalmers University of Technology, Göteborg, Sweden
b
Power Systems Laboratory, ETH Zurich, 8092 Zürich, Switzerland
1
Corresponding author. Present address: Vattenfall Power Consultant AB, Box 475, 401 27 Göteborg,
Sweden. Email: sara‐linnea.andersson@vattenfall.com Telephone: +46 31 7746932. Fax: +46 31
629750
Abstract
This study investigates Plug-in Hybrid Electric Vehicles (PHEVs) as providers of regulating power in
the form of primary, secondary and tertiary frequency control. Previous studies have shown that
PHEVs could generate substantial profits while providing ancillary services. This study investigates
under what conditions PHEVs can generate revenues using actual market data, i.e. prices and
activations of regulating power, from Sweden and Germany from four months in 2008 by emulating
the PHEV market participation with an agent-based model for individual vehicles in a fleet subject to a
simulated movement pattern. Costs for infrastructure and vehicle-to-grid equipment are not included
in the analysis. The simulation results indicate that maximum average profits generated on the German
markets are in the range of 30 to 80 € per vehicle and month whereas the Swedish regulating power
markets give no profit.
In addition, an analysis is performed to identify strengths, weaknesses, opportunities, and threats
(SWOT) of PHEVs as regulating power providers. Based on the simulation results and the SWOT
analysis, characteristics for an ideal regulating power market for PHEVs are presented.
1
2. Key words: PHEV, ancillary services, frequency control, V2G, regulating power markets.
1 Introduction
Plug-in Hybrid Electric Vehicles (PHEVs) have both an internal combustion engine and an electric
motor with onboard electric energy storage (i.e. a battery), which can be charged from the electric
grid. PHEVs are considered a promising option to achieve a cost-efficient and stringent control of
CO2 emissions in the transportation sector (Grahn et al 2009, Hedenus et al 2009). The flexibility in
charging and the possibilities to charge the vehicle during hours of low electric load, for instance
during the night, may decrease the costs of electricity generation (for a given load) and facilitate the
integration of intermittent renewable electricity generation (Lund and Kempton 2008, Göransson
2008, Göransson et al., 2009).
It has also been proposed to let PHEVs participate in grid ancillary services such as frequency control.
This would have two large advantages: it would make it less expensive to own a PHEV (Kempton &
Tomic, 2005) and more regulating power would allow for a more efficient integration of renewable
intermittent power production in the system (Larsen et al, 2008).
Real time frequency control is needed in all power systems. When more electricity is produced than
consumed, the frequency will go up and regulation down is needed. Regulation down means either an
increase in consumption of electricity or reduced production; a PHEV could provide this simply by
charging its battery as decided by the Transmission System Operator (TSO). When the consumption of
electricity is higher than the production, the frequency in the system will decrease and there is a need
for regulation up. This is provided through decreasing load or increasing production (Rebours, 2007).
A PHEV could offer regulation up by discharging its battery into the grid, if it is equipped for vehicle
to grid (V2G) power flows. If a PHEV is charging at a moment when regulation up is needed, the
service could also be provided by stopping the charging operation.
2
3. The value of the regulating power market of which the PHEVs could potentially have a share of is
substantial. The total annual market value and market size of the German regulating power markets
(here defined as the markets where real time frequency control is traded) is 770 million € and 11 000
MW (cited from the German TSOs’ internet platform for publication of regulating power data,
Regelleistung, 2008). Corresponding numbers for Sweden are 37.5 million € (using exchange rate 1
SEK = 0.1 €) and 1000 MW (Hjalmarsson & Söder, 2001). It is of interest to estimate the number of
PHEVs required to providing the corresponding regulating power. It can first be noted that an average
personal vehicle is parked for more than 20 hours a day (Brooks and Gage, 2001), and even during
rush hour, more than 80% of all cars are parked (Lund & Kempton, 2008).
To estimate the total number of PHEVs needed to cover the demand for regulating power, three
assumptions are made: a) that the required infrastructure is available so that 80% of the PHEV fleet is
connected to the grid at any time; b) that each PHEV is connected to the grid with a 3.5kW single
phase connection, hereafter called connection capacity; and c) that a negligible amount of the
connected vehicles have empty or full batteries at any time. These assumptions give that the total
demand for regulating power would be met if 2.25 million PHEVs in Germany and 180 000 PHEVs in
Sweden participated as regulating power providers. This corresponds to 5.5 % of the car fleet in
Germany, and 4.2 % in Sweden. Each year around 3.2 million new cars are registered in Germany and
280 000 in Sweden (Anfac, 2009). As an order of magnitude estimation, this implies that if all new
cars sold in the two countries were PHEVs with V2G opportunities, within one year these PHEVs
could deliver all regulating power needed in Germany and Sweden.
To keep the frequency stable, three types of control are used: primary, secondary and tertiary
frequency control, as defined by the Union for the Co-ordination of Transmission of Electricity
(UCTE) (UCTE, 2004). This study investigates PHEV participation in all these types of real time
frequency control.
Primary frequency control is the first type of control to respond to a frequency deviation. This is done
automatically within seconds after a disturbance or if an unbalance between the load and generation
3
4. would occur. Its purpose is to stabilize the frequency, possibly at another level than its nominal value.
In Sweden, there are two types of primary control: Frequency controlled Normal operation Reserve
(FNR), and Frequency controlled Disturbance Reserve (FDR). They are activated in different
frequency intervals; while FNR is utilized between 49.9-50.1 Hz, FDR is active in the intervals 49.5-
49.9 Hz and 50.1-50.5 Hz (Kristiansen, 2007).
When the primary control has stabilized the frequency, secondary control comes in to restore the
frequency to its nominal value of 50 Hz, to restore the tie-line power between control areas, and to
relieve the units participating in the primary frequency control. Secondary control is activated
automatically in the UCTE system. However, for this type of regulating power it is important where
the deviation from the planned load or production occurred as the TSO in the area of disturbance is
responsible for delivering the required regulating power (UCTE, 2004). Secondary control in this
meaning does not exist in Sweden (Kristiansen, 2007).
Tertiary frequency control is defined as manually activated regulation by the TSO (UCTE, 2004).
Normally activation is done by a phone call to a power plant operator (Verbic & Gubina, 2004). The
purpose of the tertiary control is to restore the secondary control reserve (UCTE, 2004).
All types of control are offered on markets were the TSO contracts regulating power. An actor
(defined as a provider of regulating power, e.g. a power plant operator) can offer a specific capacity to
any of the regulating power markets, but only to one market at the time. However, the same capacity
can simultaneously be offered as regulation up and regulation down. A provider of frequency control
can be paid for its services in either or both of the following two ways. A capacity price can be paid to
an actor that is ready to deliver regulating power with short notice. An energy price can be paid for the
regulating energy that is actually delivered. In the case of regulation up, the energy price is paid to the
actor that delivers energy. In the case of regulation down, the actor pays for the energy it extracts from
the grid as regulation down, but it pays a lower price than what would be the case if buying the energy
on the normal power market.
4
5. The possible profitability of PHEVs or other electric drive and/or fuel cell vehicles acting as
regulating power has been treated in a number of previous studies. Kempton & Tomic (2005)
estimated profits for battery and fuel cell vehicles providing different types of ancillary services: peak
load power, spinning reserves and regulation (approximately corresponding to primary and secondary
control). They concluded that providing regulation is highly profitable for electric vehicles; a net profit
in the range of 112-165 €/month and vehicle (using exchange rate 1$ = 0.776 €) providing a regulating
power of 10-15 kW. In another study they have looked at profitability for EV fleets in four different
US ancillary service markets for different years, and found a net profit for different years and markets
in the range of 6-45 €/month and vehicle providing 2.9-6 kW of regulation down (Tomic & Kempton
2007). They also concluded that adding regulation up usually results in much lower net profit. The
Kempton and Tomic regulating power market studies apply estimated average values for both prices
and activation frequency of the different types of regulating power. Williams & Kurani (2007) used
the same method to investigate a number of vehicle types and maximum connection capacities. A
large span of net profits is found, but more conservative than Kempton and Tomic: from a loss of 1.5
€/month and vehicle for spinning reserves, to a profit of 82 €/month and vehicle for regulation. Brooks
(2002) estimated the value created by PHEVs on a regulating power market corresponding to primary
or secondary control in study. The results lie in the range 196-326 €/month, and represent gross value
generated, which means that battery degradation and infrastructure costs need to be subtracted from
the values. All of the above studies are made for US, which implies that the price levels on the
regulating power markets could differ significantly from those of the European countries investigated
in this work. There are few estimates for Europe. Larsen et al. (2008) estimated profits for electric
drive vehicles (EVs) providing secondary and tertiary control in Denmark. They obtained returns in
the range of 6 to 160 €/month and vehicle (using exchange rate 1 DKK = 0.135 €), depending on the
market and the connection capacity. A calculation for the Portuguese market using average prices
arrived at a net revenue of around 20 €/month and vehicle providing 3.5 kW of regulation services
(Camus et al. 2009).
5
6. The purpose of this study is to investigate if there are possibilities for PHEVs to generate profits on the
European regulating power market, and to use actual regulating power market data to in order to
simulate vehicle behaviour and possible profits generated on typical regulating power markets.
Sweden and Germany are chosen as study cases since data was readily available for these two
countries, but also because they have significantly different electricity generation mixes, with hydro
and nuclear power dominating in Sweden, while thermal power is the predominant power source of
the German power system. In addition, the study aims at investigating the market structures of these
regulating power markets and their implications on PHEVs as regulating power providers. The
research questions are thus:
• From an economic perspective: with the current market prices, to what extent is it of interest
for PHEVs to act as regulating power providers on the Swedish and German markets?
• From a market perspective: with the current market designs, to what extent is it possible for
PHEVs to act as regulating power providers on the Swedish and German markets?
• How would a regulating power market be designed to best suit PHEVs?
Below, the model that was developed to simulate PHEV behavior on the regulating power markets is
described, and results from the simulations with the model are presented. A sensitivity analysis is also
presented, varying the cost of battery degradation, the size of the connection capacity per vehicle, and
the market prices of regulating power. Thereafter, a SWOT-analysis is made of PHEVs as regulating
power providers. This forms a basis for suggesting a regulating power market ideal for PHEVs, as well
as for the discussion.
2 Simulation of PHEVs Delivering Regulating Power
2.1 Model description
In order to estimate the profits that could be generated by PHEVs on the present regulating power
markets in Sweden and Germany, a simulation model was developed in Matlab. The model simulates
6
7. the behavior of 500 individual PHEVs on the regulating power markets in Sweden or in Germany
during January, April, July and October 2008. In the model, the cars are assumed to drive 2x35 min
each day, supposedly from home to work and from work to home. No weekly or seasonal variations in
the driving pattern have been included. The remaining time the cars are parked and during this time
they are assumed to be plugged in and can participate on the regulating power market. While parked,
the model assumes for each minute the car to perform one of four actions optimizing its economics:
1. Deliver regulation down
2. Deliver regulation up
3. Charge (without participating in regulating power market),
4. Wait.
Which action is chosen is determined by a number of conditions (if-clauses): For a car to deliver
regulation up or down during minute A, regulation up or down, respectively, must have been activated
on the market investigated during minute A. Additionally, the PHEVs’ bid must be activated (further
details on this below). Moreover, the car must have a battery that is neither empty nor full,
respectively during minute A-1. Any regulation up delivered is thus compensated by charged
electricity and not by extra use of fuel. The car will charge if the time left to its departure is shorter
than the time needed to charge up the battery, so that the car always leaves with a fully charged
battery. In a real-life situation, this would only be possible if the driver always knows when she or he
will depart and share this information with the aggregator/TSO, which is rather optimistic with regards
to user acceptance. Yet, this is one of the possible agreements that could be made between the driver
and the TSO. Other possible agreements or contracts, not further studied here, could include that
battery SOC may never go below 50%, or contracts without any constraints on battery SOC.
The output from the model is the maximum profit per day for each vehicle under the assumptions
made. The profit consists of three parts:
7
8. • Capacity payments: defined as the income the PHEVs have for being available. This is
counted as pure profit; no costs for infrastructure and V2G equipment have been included in
this study.
• Profit from selling regulation down: defined as the savings made from charging the battery
at the regulation down price instead of the standard price for charging (defined below).
• Profit from selling regulation up: defined as the price received for selling regulation up
minus the price paid for buying the energy sold as regulation up plus costs for additional
degradation of the battery (all of which defined below.)
Real market prices and demands of regulating power for each minute of the four months given above
are used as input to the model. For the Swedish case, data on both prices and activated amounts of
regulating power were given by Ripstrand (2008). For the German case, data on contracted amounts
and prices were taken from Regelleistung (2008), whereas data on activation of regulating power were
taken from Vattenfall (2008c). Thus, the profits generated and energy transactions made by the
PHEVs are in principle profits that could actually have been made if the PHEVs had been on the
market in 2008. Furthermore, the model simulates a “best case scenario” with respect to the profit of
the PHEVs, implying that the results are the highest possible profits from acting on the reserve power
market in 2008. This is motivated by the necessity to investigate if there is any economic justification
for implementing PHEVs as regulating power providers. Moreover, the profits presented here are
average maximum profits generated by one vehicle during a month, which possibly would need to be
shared between several parties. These parties could be the vehicle owner, the aggregator (defined as a
company that organizes the V2G-services of many vehicles being the interface between the TSO and
the vehicle owners, see e.g. (Brooks, 2002)) and perhaps other entities, while also covering additional
equipment and infrastructure costs.
Primary control is activated automatically, triggered by a frequency deviation. In the model, the cars
thus deliver regulation up when the frequency is below 50 Hz, and regulation down when the
frequency is above 50 Hz. The regulation characteristics applied in the model are straightforward; as
8
9. soon as the frequency drops below or goes above 50.00 Hz, the maximum power (3,5 kW) is delivered
from or to the vehicles, respectively. The frequency used is the actual frequency in the Nordel and
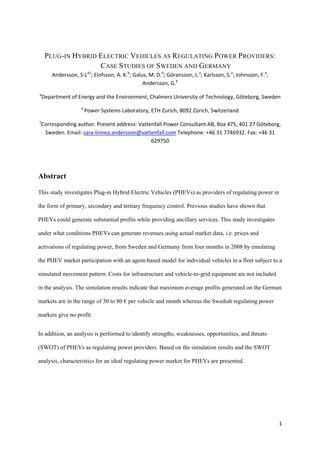
UCTE system during the modeled months of 2008 (Thor, 2008; Biernacka, 2008). Figure 1 presents
the frequency in the two countries during July 2nd 2008 as an example. The black line represents
frequency in Germany and the grey line represents frequency in Sweden. On this day frequency
deviations were larger in Sweden.
Power system frequencies on 2 July 2008
50.15
Sweden
Germany
50.1
50.05
Frequency (Hz)
50
49.95
49.9
49.85
05.00 10.00 15.00 20.00
Time (h)
Figure 1: Example of frequency variations in the Swedish and German power systems (Nordel and UCTE) during 2 July 2008.
To participate on the primary regulating market, an actor makes a bid for capacity that is accepted or
rejected by the TSO. All accepted actors then deliver primary control whenever the frequency deviates
from 50 Hz, irrespective of the price for actually delivering the demanded energy. Actors that deliver
primary control are given a capacity payment in both Sweden and Germany, according to a pay-as-bid
system (each accepted actor receives the price of their bid). In Germany, the bid the PHEVs make in
the model is the maximum bid accepted during that time period, known from Regelleistung (2008). In
Sweden, the capacity bid made by the vehicles is assumed to be a representative average bid per hour
according to the Swedish TSO (Bäck, 2008). Additionally, energy is paid in primary control in
Sweden, at the same price set for tertiary control energy during that hour (Bäck, 2008). Energy
delivered in primary control in Germany is not paid (Schulz, 2008). Table 1 gives the bids made by the
PHEVs in the model, and actual price intervals and mean prices on the markets during the simulated
months. Table 1 also provides the share of time that different types of control were activated during
9
10. the simulated months, to enable comparison e.g. that tertiary control is activated much more in
Sweden than in Germany.
Table 1: The bids the PHEVs make on the different markets in the model, and actual prices occurring on the markets during 2008,
given as a min-max interval of accepted bids, and a mean accepted bid in brackets.
Primary Secondary Tertiary
Sweden 1 Germany 2 Germany 3 Sweden 4 Germany 5
PHEV bid Capacity 0.09 for FNR and Highest accepted Highest accepted bid . Highest
Up and 0.36 for FDR bid during each during each period accepted bid
6
Down during the day and period (one (peak/off peak time during each
(€/MW/h) 0.42 (FNR) and 1.7 month). during one month) period (4h)
(FDR) 7 during the
night 8
Energy Up No bidding - 143.2 9 182.6 10 216.7 11
(€/MWh)
Energy Highest accepted bid Spot price Highest
Down during each period accepted bid
(€/MWh) during each
period
Actual Capacity Unknown. PEHV 15-32 (19) Peak time: 15-46 (22) No capacity 0-188 (6) 13
prices: Up bids above are Off-peak time: 6-8 (7) 12 price
Minimum- (€/MW/h) representative
maximum Capacity averages Peak time: 3-5 (4) 0-6 (2)
(mean) Down Off-peak time: 5-19 (8)
accepted (€/MW/h)
bids during Energy Up Same as in tertiary No energy price. Peak time: 97-700 (157) 2-125 14 (55) 99-1600 (405)
simulated (€/MWh) control. Off peak time: 58-260
months (112).
Energy Peak time: 0-26 (8) 0-95 (48) 0-8 (1)
Down Off peak time: 0-9 (1)
(€/MWh)
Share of time that control FNR: 99% 98% 16 99% 17 76% 18 4% 19
was active during simulated FDR: 2% 15
months (%)
For secondary and tertiary control, the activation is based on bids, so that when a demand for
regulation up arises the actor with the lowest bid is activated first, the second lowest bid activated
second, and so forth (inversely for regulation down, i.e. the actor who is willing to pay the highest
a
Bäck (2008)
2
Regelleistung.net (2008)
3
Ibid.
4
Ripstrand (2008)
5
Regelleistung.net (2008)
6
07.00-21.00
7
Bids originally made for frequency response, and are 3.5SEK/MW/Hz/h for both FNR and FDR during daytime and
20SEK/MW/Hz/h during nighttime. The Swedish TSO then adds 1SEK to all accepted bids, so calculations here are based on 4.5 and
21SEK/MW/Hz. Frequency bands are 0.8Hz for FDR and 0.2Hz for FNR.
8
21.00-07.00
9
(106.4 €/MWh (price for charging) + 30 €/MWh (cost of battery degradation) )* 1.05 (for profit)
10
(106.4 €/MWh (price for charging) + 100 €/MWh (cost of battery degradation) )* 1.05 (for profit)
11
(73.9 €/MWh (price for charging) + 100 €/MWh (cost of battery degradation) )* 1.05 (for profit)
12
Bids originally made per month, here assumed 276 h peak time (weekdays 8.00-20.00) and 468 h off peak time (all other time) per
month
13
Bids originally made per 4 h
14
With one extreme incident of a price at 960 €/MWh removed
15
Thor (2008)
16
Biernacka (2008)
17
Vattenfall (2008c)
18
Ripstrand (2008)
19
Vattenfall (2008c)
10
11. price for energy bought as regulation down is activated first). Both capacity and energy payments are
given to actors on German secondary and tertiary markets according to a pay-as-bid system. Actors on
the Swedish tertiary market receive only an energy payment, which on the other hand is priced
according to marginal cost principle (meaning that all activated actors are paid the bid of the last
activated actor). In the model, the PHEVs are always accepted for capacity, at the highest bid that was
accepted during that time period, in accordance with the best case scenario. An indication of the price
levels on the different markets is given in Table 1. For regulation up energy, the vehicles make a bid
that covers the costs they have for delivering the energy plus a 5% profit margin. The cars will be
activated for regulation up if this bid is lower than bids that were actually activated during each time
period. For regulation down energy, the bids the cars make are such that they are always the first to be
activated (in this ideal best case scenario, the bids of the competitors are assumed to be known).
Because delivering regulation down only means charging at a lower price, this is the most profitable
strategy for the cars.
In the model, each PHEV has a battery capacity of 10 kWh with a maximum depth of discharge at
20% of full capacity (i.e. maximum 8 kWh can be utilized). Charging and discharging efficiencies are
set at 94% (Söderbom, 2008). The data set containing arrival and departure times of the individual
vehicles and corresponding states of charge, based on actual driving cycle composition, is taken as
output from the model described by Galus & Andersson (2008; 2009). The vehicles are assumed to be
connected to the grid with a connection capacity of 3.5 kW, corresponding to a European standard of
household plugs (230 V, 16 A). This is significantly lower than several previous studies have used, but
it is assumed to be the rating for a first generation of PHEVs with slow charging (Söderbom, 2008).
The cost for battery degradation is difficult to estimate, because the Li-ion technology is fairly new
and rapidly developing. A Li-ion battery lasts for 2000-4000 deep cycles (Markel & Simpson, 2006),
and estimated future battery investment cost in the case of mass production lie in the range of 200-
500$ per kWh of battery (Williams & Kurani, 2007; Bergman, 2008; Söderbom, 2008). The cost for
battery degradation is non-linear with respect to cycle depth. Assuming for simplicity that only full
11
12. discharge cycles are used, the cost of battery degradation per unit of energy throughput in the battery
can be calculated as,
B (1)
Df =
C f ⋅ E max
where Df is the cost of battery degradation per unit of energy throughput at full discharge cycles, B is
the battery investment cost per unit battery size, Cf is the number of possible full cycles during a
battery lifetime, and Emax is the usable share of a unit of battery (e.g. if a battery can be discharged
down to a depth of SOC = 0.2, then Emax = 0.8). Cf · Emax therefore represents the total amount of
energy throughput that a battery unit can have during its lifetime. This is a simplified equation that
does not take the complexities of battery degradation into account, and it is used only to get an
estimate of what battery degradation could cost. Using Equation (1) with a battery investment cost of
300 $/kWh, a lifetime of 3000 cycles and a depth of discharge of 80%, results in a battery degradation
cost of 100 €/MWh (assuming 1$ ≈ 0.8€). This figure is used for tertiary control, which is assumed to
have deep discharge cycles. The battery cycles are likely to be less deep in primary and secondary than
in tertiary control, which results in a battery degradation that is around 1/3 of that at deep discharge
cycles (Kempton & Tomic, 2005). Here, a degradation cost of 30 €/MWh has been used for primary
and secondary control. Charging is assumed to be done at a fixed price, e.g. through the car owner’s
normal electricity supplier. The Swedish electricity price is 73.9 €/MWh, taken from Vattenfall’s 1-
year fixed price contract per 2008 for private consumers, with taxes subtracted (Vattenfall, 2008a).
The corresponding price in Germany is 106.4 €/MWh (Vattenfall, 2008b). Taxes, other fees, and
subsidies have been excluded, since it would complicate the study considerably without necessarily
giving additional insights. Moreover, excluding taxes and fees gives an estimate of the potential profits
without interference of tax and subsidy systems, which may change rapidly.
2.2 PHEV profit on current German and Swedish Markets
Figure 2 presents the average monthly profit generated per PHEV in all types of regulating markets for
both countries (upper plot), and the corresponding average energy transactions (lower plot), that is
energy that has been delivered as regulation up and down or charged without regulating power market
12
13. participation. It can be seen that even under a maximum profit simulation like the one at hand, none of
the Swedish regulating power markets are profitable for PHEVs to act on. Average profits per vehicle
range from a loss of 19 €/month for primary FNR to 7 €/month profit for tertiary control, with primary
FDR yielding 0.5 €/month profit. A PHEV providing control in Germany can generate a fairly high
maximum profit on all three markets: 50 €/month when acting as primary control, 80 €/month as
secondary control and 30 €/month as tertiary control.
The higher profits in Germany can be explained by higher price levels on both capacity and energy for
regulating power. In Sweden, there is a capacity payment on the primary market, but it is small
compared with German price levels (see Table 1). Moreover, prices for control energy in Sweden are
normally close to the spot price, whereas in Germany there is a two orders of magnitude difference
between the prices for regulation up and down (as seen in Table 1). As seen in Figure 2, the PHEVs
are activated for regulation up on the tertiary market in Germany, which implies that the PHEVs’ bid
is low enough to be activated on this market (Table 1 shows that the PHEV’s bid is 217 €/MWh
compared with an average bid for regulation up of 405 €/MWh). In Sweden, the PHEVs bid for
regulation up (183 €/MWh) is not within the span of activated bids during 2008 (2-125 €/MWh), and
is thus never activated. For regulation down, the PHEVs are always the first to be activated in the
model. This implies that since tertiary control is active most of the time in Sweden (see Table 1), the
cars almost always fill their batteries on regulation down energy when delivering tertiary control in
Sweden. However, since the energy price the cars pay for the regulation down energy is similar to the
price of the energy they would normally have charged, the profit is still small. The explanation for the
difference in price levels on the Swedish and German regulating power markets is that regulating
power in Sweden is generally delivered by hydro power plants, which have a significantly lower cost
for providing this service than the coal fired power plants that prevalently provide regulating power in
Germany (Hjalmarsson & Söder, 2001).
The German secondary regulating power market is the most attractive for PHEVs because it combines
two advantageous factors: capacity payments are high on the secondary regulating power market and
13
14. the PHEVs acting on this market are often activated for regulation down (as seen in Figure 2) at a very
attractive price (mean peak price 8 €/MWh, mean off peak price 1 €/MWh as seen in Table 1).
The reason that PHEVs delivering Swedish FNR generate a negative profit is related to activation.
FNR is almost constantly active whereas FDR is seldom activated, as seen in Table 1 and in the lower
plot in Figure 2. This has a large impact on the results since for the primary regulating power market
in Sweden, the energy payment is defined without relation to the cost of the actor (as described in the
Methodology section above). Hence, PHEVs deliver regulation up at a loss.
Average monthly profit generated per vehicle
100
50
/car
0
−50
Swe: FNR Swe: FDR Swe: tertiary Ger: primary Ger: secondary Ger: tertiary
Average monthly energy transactions made per vehicle
800
Regulation up
Regulation down
600
Charge
kWh/car
400
200
0
Swe: FNR Swe: FDR Swe: tertiary Ger: primary Ger: secondary Ger: tertiary
Figure 2. Upper graph: Average profit generated by one PHEV during one month on the different markets. Lower graph: Average
energy transactions (regulation up, regulation down, and charging without regulating power market participation) made by one
PHEV during one month on the different markets.
Figure 3 visualizes the profits generated on all markets divided in a number of different categories in
order to show from where the profit originates. In the upper plot, the profit generated by one vehicle
during the time parked at home is compared with the profit generated during the time parked at work.
In the middle plot, the profit coming from capacity payments is compared with the profit (or loss)
14
15. originating from energy payments. In the bottom plot, profit from providing regulation up is compared
with the profit from providing regulation down. In all cases shown in Figure 2, the sum of the two
categories in each market is the total profit.
In the upper plot of Figure 3, it can be seen that profit from the time parked at home is, on all markets
where profit is generated, larger than the profit from the time parked at work. This is sometimes due to
the longer time parked at home, and sometimes due to higher prices during the night. Irrespectively,
this implies that if PHEVs are to make profit by providing regulating power, it would be better to
install the required infrastructure for night time connection (e.g. at people’s homes) than daytime
connection (e.g. work place parking lots for staff).
From the middle plot in Figure 3, it becomes obvious that capacity payments make very important
contributions to the total profit on all German markets. If only energy would have been paid for on the
German markets, the profit would range from a loss of 7 €/month to a profit of 20 €/month on the
different markets. The highest in the range, 20 €/month, is not likely to be enough to motivate PHEV
participation on the market. Since the capacity payment on the present Swedish primary market is low,
capacity payments do not make a major contribution to the profit on any of the Swedish markets.
The lower graph in Figure 3 gives a comparison of the profit contributions from delivering regulation
up and down. Generally, delivering regulation down will always be interesting to PHEVs, as it implies
that they can charge at a lower cost. Delivering regulation up is more “risky” for the PEHVs as the
simulation results indicate that this is done at a loss on the primary regulating power markets.
However, if capacity is paid for, this income can cover the losses made in providing regulation up (see
German primary control in middle plot in Figure 3). The results indicate that if PHEVs are providing
regulating power it may be wise to only offer regulation down. Thus, this would avoid the risk of a
loss. The results indicate that also the Swedish primary FNR could generate a profit of 20 €/month if
only offering regulation down. Simulations give that profits in Germany range from around 60
€/month for primary control, to around 40 €/month for secondary control, down to less than 10
€/month for the tertiary market. Although these profits are significantly lower than when offering both
15
16. up and down regulation, the simpler equipment and infrastructure required to implement PHEVs as
regulation down (i.e. less costly with no V2G possibility) may offset some of the lower profits.
Delivering regulation down only requires a remote controlled charger.
Figure 3. Upper graph: Comparison of average profit generated by one PHEV one month from the time parked at home and the
time parked at work. Middle graph: Comparison of average profit generated by one PHEV one month originating from capacity and
energy payments. Lower graph: Comparison of average profit generated by one PHEV one month by providing regulation up and
down.
2.3 Sensitivity Analysis
Figure 4 summarizes the results from the sensitivity analysis. The analysis comprised simulations in
which three important input parameters were varied: cost of battery degradation, connection capacity
and market prices of regulating power. The simulations are performed for data from July 2008, which
means that the original profits in Figure 4 differ slightly from the average profits in Figure 2.
The cost of battery degradation was lowered to 1/100th of its original value (1 €/MWh for tertiary
control and 0.3 €/MWh for primary and secondary control) with the intention to illustrate how profits
could be affected in a possible future where significant advances in battery technology have taken
16
17. place, i.e. where batteries are less expensive and have longer life lengths than today. Yet, the cost for
battery degradation is given per unit throughput of energy, not per unit battery size. Contrary to what
one might expect, this parameter is the one that affects the results the least of the parameters varied.
The reason is that the battery degradation cost only becomes important when the vehicles sell
significant amounts of regulation up, which only happens on the primary markets. FNR is the market
that is the most affected by a lower battery degradation cost with an increase in average monthly profit
from a loss of around 19 €/month to a profit of around 6 € per vehicle. A less expensive battery also
implies that the PHEVs are sometimes, although rarely, activated for regulation on the secondary
regulating power market in Germany and the tertiary regulating power market in Sweden. For the
original case the simulation gives that PHEVs are never activated for regulation up.
The connection capacity was increased from 3.5 kW to 15 kW, with 15 kW being closer to what
previous studies have used (10-15 kW by Kempton & Tomic (2005), 1.8-17.9 kW by Williams &
Kurani (2007), 7 and 18 kW by Brooks (2002) and 2 and 20 kW by Larsen et al. (2008). The increase
in connection capacity to 15 kW has the largest effect on the results. In German primary and
secondary control, the profits increase from 60 to 260 €/month and from 110 to 390 €/month,
respectively. The reason is the large capacity payment, which of course increases when the connection
capacity increases. However, as discussed in the introduction, a first estimate indicates that the
regulating power markets could be saturated already at modest market shares of PHEVs, even with 3.5
kW connection. With an increased connection capacity, the profit per participating vehicle could be
substantially larger, but the number of participating vehicles would decrease correspondingly.
Interestingly, in Swedish FNR, the loss increases with an increased connection capacity (increased
loss from 19 to 54 €/month). Here, the increased capacity payment is not large enough to compensate
the increased amount of regulation up sold at a loss. In Swedish FDR, the profit does increase, but
only from 0.5 to 1.2 €/month and vehicle.
Market prices for regulating power have been varied both up and down, in each case by 20%. To
simulate increased regulating power prices, capacity prices and bids for regulation up were increased
with 20%, while bids for regulation down were decreased by 20%. These variations intend to simulate
17
18. a possible future with a higher demand for regulating power, such as would be the case in a system
with increased fraction of intermittent power supply. An increase in regulating power prices influences
all markets to some extent, making the profits somewhat higher. On all markets except for primary
FNR, increased regulating power prices by 20% raise the profits more than having a battery
degradation cost of 1/100th of the original. However, a 20% raise in regulating power prices change the
FNR profit to positive values (compared to a loss of 19 €/month in the original case). The case in
which capacity and energy are lowered by 20% illustrates a case when PHEVs have entered the
market at a fairly large scale, and have therefore influenced the price for regulating power. Naturally,
all profits per PHEV decrease in this case. Also in this case FNR is the most sensitive, with an
increase in loss from 19 to 35 €/month.
18
19. Figure 4. Sensitivity analysis of the average profit generated by one PHEV during one month for variations in battery degradation,
connection capacity and regulating power price.
3 SWOT Analysis of PHEVs as Regulating Power and the Ideal
Regulating Power Market for PHEVs
A SWOT analysis was made to identify the Strengths, Weaknesses, Opportunities and Threats of
PHEVs as regulating power providers. The first two factors are internal to the PHEVs, meaning that
they concern positive (strengths) and negative (weaknesses) features and properties of the PHEVs as
regulating power providers. The last two factors are external and are features of the regulating power
market, and other actors on these markets, which will have an influence on the ability of PHEVs to
serve as regulating power providers. A more thorough description of the SWOT analysis as a tool is
given by Ritsch (2004).
19
20. Table 2 summarizes the result from the SWOT analysis of PHEVs as providing regulating power with
the aim to provide a first basis for design of a regulating power market which would be tailored for the
characteristics of PHEVs. Some of the opportunities and threats from the SWOT analysis are treated
further in the Discussion section.
Table 2: Summary of the qualitative SWOT analysis made for PHEVs as regulating power.
Internal External
Strengths Opportunities
• No cost for being available • Increased demand for regulating power due to
• Regulation down is charging of the battery and increased intermittency (renewable energy) in
can be provided cost efficiently the power system
• Fast delivery/acceptance of energy, i.e.short • Political will to introduce PHEV and to support
Positive
activation time. electrification of the car fleet
• Many PHEVs in a system could be seen as a • Liberalisation of regulating power market –
guarantee of stable capacity political pressure to lower entrance barrier
• Compared to EVs, PHEVs have the possibility • Other actors also put pressure on the regulating
to use gasoline to provide regulation up when power market to change
battery is empty • Potential economic incentive for PHEVs to
participate is substantial on some markets
Weaknesses Threats
• Limited connection capacity • Conservative and inflexible market
• Limited energy storage in the battery (cannot • Oligopoly market structure
provide regulation down when battery is full) • High security and delivery requirements
• Mobile devices - difficult to guarantee constant • Large bid sizes
capacity if a small number of cars participates • Long market time frames
• Human factor: people can forget to plug in their • Long contract times
cars or feel uncomfortable about the TSO • Infrastructure development needed
controlling their charging operation. • Standardisation issues
• Regulation up has a high cost • Co-operational challenges - automotive industry
Negative
• The cost for delivering up- and down- and power suppliers
regulation differs significantly • Lower prices on regulating power due to PHEVs
• Regulation up implies energy losses in on the regulating power market
charging and discharging of the batteries • Symmetric bids and package prices which makes
the bidding system inflexible, and does not allow
offering only regulation up/down etc.
• TSOs may not trust PHEVs as regulating power
providers
• Risk of technology lock-in, i.e. if charging
infrastructure initially is installed without V2G
possibilities
As can be seen from Table 2, a major strength of the PHEV as regulating power resource is that it can
deliver electricity from its battery to the grid or start charging within seconds. This enables short
activation times and makes PHEVs fast enough for all types of frequency control. An obvious
weakness is that the energy storage in the battery is limited, which put constraints on the length of the
periods that PHEVs can be activated for frequency control (energy is limited). When the battery is full,
no more regulation down can be delivered.
20
21. The connection capacity of the plug through which the PHEV is connected will obviously limit the
regulation power provided by each PHEV. This power is very low compared to that of a power station,
which is another weakness of PHEVs acting on the regulating power markets of today, where large
bids are required. This makes activation of PHEV regulating power more complicated, as many small
units need to be activated. Thus, a possibility to pool a certain number of vehicles, e.g. through an
aggregator, is needed.
A possible problem with PHEVs as regulating power is that they are mobile (cf. Table 2), which
means that the TSO cannot know for certain if a specific vehicle is available at a specific time.
Considering the importance of a stable and secure power system, this is of course a major weakness
when considering individual vehicles. However, with a large number of vehicles aggregated and
offered to the market as one unit, this weakness will be significantly less problematic, since the
probability that all aggregated vehicles are driving simultaneously is small. As noted before, even
during rush hour, more than 80% of all cars are parked (Lund & Kempton, 2008).
When a PHEV delivers regulation up there is a significant energy loss, as energy is first charged and
then discharged from the battery (94% charging and discharging efficiency is used in the present
simulations, with other studies applying both higher or lower charging efficiencies (Galus &
Andersson, 2009)). This can be compared with a few percent efficiency loss for hydro and coal power
delivering regulating power (Hjalmarsson & Söder, 2001), although pumped hydro has higher losses.
Thus, this is a weakness for PHEVs as regulating power providers (cf. Table 2) since costs increase
and there will be an increased overall energy loss in the system.
In summary, based on Table 2 it can be concluded that PHEVs have some features that make them
suited as regulating power providers in certain situations. One of the most important strengths is that a
PHEV’s flexible cost of being available for regulating power is zero, that is, there is no extra cost for
keeping the vehicle plugged in once the fixed infrastructure and equipment costs are paid for. Another
major strength is the cost efficient provision of regulation down. These strengths could be an asset to
society, if the regulating power market is re-designed so that the weaknesses identified will be less
21
22. significant. Table 3 proposes a regulating power market suited for PHEVs and compares this market to
the Swedish and German markets of today. The ideal market is described and explained below.
Table 3. Comparison of key parameters of the regulating power markets investigated in the simulations, and a market designed to be
ideal for PHEVs (Bäck, 2008; Nordel, 2008; Schulz, 2008)
Ideal for Primary Secondary Tertiary
PHEVs Sweden Germany Germany Sweden Germany
Energy/Capacity Energy and Energy and Only Energy and Only energy is Energy and
Price capacity capacity is capacity is capacity is paid paid capacity is paid
payment paid paid
Regulation up/down Asymmetric Symmetric Symmetric Asymmetric Asymmetric Asymmetric
Contract time Short, e.g. 1h 8h 1 month Two periods per 1h 4h
month: Peak time
& off-peak time
Market time frame Short, e.g. less Weekly and Monthly Monthly market Market open from Daily market
than 1h. hourly markets market 14 days until 30
Procurement minutes before
several times operation hour
daily.
Minimum bid size Small, e.g. less FNR: 1MW 20 5 MW 10 MW 10 MW 15 MW
than 1MW. FDR: 4MW
Number of sellers Many actors 5 actors (1 5 actors 5 actors 5 actors 23 actors (5
large) large)
From the PHEV point of view, markets with both energy and capacity payments are preferred. Since
the PHEV’s cost for keeping the capacity ready is zero or close to zero, capacity payments quickly
become profitable. Hence, PHEVs have an advantageous position for competing with other actors on a
market with capacity payments, since the PHEVs can make low capacity bids. Concerning energy, a
PHEV delivering regulation down simply corresponds to charging its battery. It is of course an
attractive deal for PHEVs to be given a capacity price for just being plugged in, and then charge the
battery with cheap or even free electricity. However, the conditions differ considerably for regulation
up. Then the costs for supplying the grid with electricity correspond to the cost for battery degradation
due to extra cycling and the electricity cost for the energy stored in the battery, both of which are high
in comparison to expected profit. This has two implications. Firstly, an energy payment will make the
PHEVs compete on fair terms with other actors on the market, because then bids can be made in
correspondence with the costs for PHEVs providing regulating power (cf. primary regulating power
markets where energy is not paid or paid without relation to the costs, and where PHEVs have to sell
regulation up at a loss). Secondly, it is difficult for PHEVs to compete on markets where bids are
made symmetrically for both up and down regulation. Here, PHEVs are not able to take advantage of
20
10 MW/Hz on both markets
22
23. their competitive edge (very low costs for regulation down) as they are forced to place bids that cover
their high costs for regulation up. From a regulating power market point of view, this is also
unfortunate, as it could rise the prices and prevent the most cost efficient solution, where each actor
does only what it does most cost efficiently. Hence, it is ideal for PHEV to act with asymmetric bids,
i.e. bids on either up or down regulation.
The contract time is defined as the period during which an actor guarantees regulating power. In order
to utilize the plugged-in capacity the aggregator needs to vary the size of its bid in accordance with the
amount of PHEVs plugged in. Ideal for PHEVs would thus be a short contract time such as one hour.
The market time frame is defined as the time period between market closure and delivery. This is
important to PHEVs because an aggregator that offers the PHEV-capacity from one parking lot has
difficulties in knowing long before how many cars will be parked during a specific time. These
unpredicted variations suggest that PHEVs need a short market time frame, i.e. a bidding process close
to delivery, to be able to adjust the bids to the amount of PHEVs plugged in. Ideal for PHEVs would
be to make their bids just a few minutes before delivery. However, fairly good estimates of available
capacity can be made based on experience.
The minimum bid size is defined as the smallest capacity that actors are allowed to offer on the
regulating power markets. Since each car only can provide a small amount of capacity (limited by
connection capacity) and energy (limited by battery size), the PHEV would gain from small bid sizes.
This would lower the entrance barrier to the market, so that also a small number of cars or even a
single PHEV could enter. It would also be preferable if small regulating power sources would be able
to pool. In an ideal case, no geographical consideration of the sources pooled would be taken, which
would allow for pooling of PHEVs over large areas. On the secondary and tertiary German regulating
power markets pooling is allowed if the entities are located within the same control area. Pooling
which crosses the control areas is possible for secondary control in Germany, but not for primary and
tertiary control (Bundesnetzagentur, 2006; Regelleistung, 2009).
23
24. The number of sellers on each market is relevant to PHEVs, because the fewer sellers, the closer the
market is to monopoly or oligopoly. A market with a monopoly or oligopoly market structure is likely
to be less flexible and more difficult to enter. Ideal for PHEVs is thus many actors on the markets.
From the organizational market perspective, the current Swedish regulating power markets seem more
suited for PHEV entry than the German markets, as the bid sizes are smaller and the time aspects
generally more flexible in Sweden (see Table 3). Concerning types of control, the smallest bid sizes
are currently found on the primary control markets in both countries, and the tertiary markets are the
most flexible concerning time. However, there are important obstacles to overcome on all markets in
both countries.
4 Discussion
Most energy policy incentives call for drastic reductions in CO2 emissions over the coming decades,
which will increase the need for renewable energy sources of intermittent character such as wind
power. A larger share of intermittent power production in the electric system will lead to a higher
demand for regulating power. Replacement of coal-fired power plants (or other base load plants) with
intermittent power production implies that parts of the regulating power used today (from coal-fired
plants) could disappear. This could provide a window of opportunity for PHEVs as regulating power
providers.
As seen in the SWOT-analysis, the current design of regulating power markets is in many cases
inflexible and not well suited for PHEVs and other small actors. One reason for this is the present high
requirement on security, which inevitably leads to inflexibility in some respects.
The interest in reducing CO2 emissions could also lead to a political will to support an electrification
of the car fleet. One way of implementing this could be to increase the flexibility of the regulating
power markets, in order to open up for PHEVs as actors and thus enable these to generate the profits
described in this study. Other smaller players (e.g. owners of stationary fuel cells or small scale hydro
power stations) would also have interest in a more flexible regulating power markets, which increases
24
25. the pressure on the market. Moreover, the entire electricity market is under liberalization in Europe,
which in turn could lead to higher pressure to avoid an oligopoly on regulating power.
However, as indicated in the introduction, a relatively small amount of PHEVs could cover the entire
demand for regulating power. This implies that a saturated supply of regulating power provided by
PHEVs could be reached rather fast if there is a strong diffusion of PHEVs. An introduction of PHEVs
to such an extent would affect the prices on the regulating power market, and the profits generated by
each PHEV would become lower. Since the PHEVs can hold capacity available at no cost, their
inclusion on the market would probably lead to lower capacity payments or even energy payments
only. Although not attractive from a PHEV owner perspective, decreasing prices for regulating power
would be preferable from a societal point of view, since it implies that the service of regulating power
is provided in a more cost efficient way.
The infrastructure needed to implement PHEV as regulating power requires interaction between two
large industries which previously have had little in common: the automotive industry and the utility
industry. An important question to resolve is who will make the investments in the infrastructure; the
car manufactures or the utilities. Standardization and infrastructure decisions must be resolved, a
process which may result in lock-in effects or dead ends for equipment suppliers. If the charging
infrastructure is initially installed without V2G possibilities, it might be difficult to change the
standards afterwards. However, V2G is hardly an interesting option before there is a fairly large
number of PHEVs on the streets, and these first PHEVs need charging infrastructure.
For power producers/suppliers, PHEVs would both be a new category of costumer but also a new
potential competitor on the regulating power market. An electrified car fleet that charges during off-
peak hours, would imply a better utilization of power plants (Göransson, 2008) and little or no new
power capacity would be needed (Bergman, 2008). This offers a possibility for the power producer to
sell full capacity also during off peak hours without an additional fixed cost. In addition, the efficiency
of the power plants is higher if they produce energy at the rated power, which is possible if production
can be maintained during the night. Not providing regulating power also means a higher overall
25
26. efficiency for the power plants. In all these respects, PHEVs are beneficial to the power producers.
However, in the simulations the PHEVs often fill their batteries on regulation down energy. This
indicates that PHEVs would potentially not be new electricity consumers for the power producer, but
mainly new competitors on the regulating power market. On the other hand, with a large fraction of
PHEVs in the car fleet this would not be true for all PHEVs, since the entire market for regulation
down would be covered already at low PHEV diffusion rates (e.g. by 3% of the car fleet in Germany).
5 Conclusions
An assessment of PHEVs as regulating power providers has been made based on a simulation model
together with an assessment of the regulating power markets in Sweden and Germany. The model,
which was developed in this work, uses real regulating power market data from the two countries, i.e.
applying current prices and demands on the regulating power markets.
The simulation results show that the current German regulating power markets give significantly
higher profit for the PHEV than the Swedish markets. In Sweden PHEVs cannot generate profits on
any type of the regulating power markets (i.e. on any type of frequency control), especially
considering that the simulations in this study were carried out for a maximum profit case.
With respect to the infrastructure required in order for the PHEVs to act on the regulating power
markets, the simulations give that construction of infrastructure is most important in places where
PHEVs are parked during the night, rather than where they are parked in daytime. Company cars may
have the advantage that they often are parked in the same parking lot during daytime and nighttime,
which simplifies the construction of such an infrastructure.
A suitable way to start introducing PHEVs as regulating power could be to offer only regulation down.
This would be possible on markets with non-symmetric bidding, i.e. secondary and tertiary markets
today.
26
27. Concerning the connection capacity, this study does not indicate that a large connection capacity per
vehicle would be better from a system perspective. A large connection capacity would result in a
higher profit per vehicle on most markets, but since the market could be saturated with PHEV
regulating power quickly in either case, it might not be motivated to add extra infrastructural costs for
a higher regulating capacity.
6 Acknowledgement
This work was in part financed by the AGS project ‘‘Pathways to Sustainable European Energy
Systems’’.
7 References
Anfac (Spanish Automobile Association) (2009). European Motor Vehicle Park 2007. Retrieved 31
March 2009, from http://www.acea.be/index.php/news/news_detail/vehicles_in_use/
Bergman, S. (2008). Plug-in hybrider. Elhybridfordon för framtiden. (Translation: Plug-in hybrids.
Electric hybrid vehicles for the future.) Rapport 08:10. Stockholm: Elforsk.
Biernacka, I. (2008). Frequency data for the UCTE system. Email, 16 December 2008. PSE Operator
S.A. (TSO of Poland).
Brooks, A. N. (2002). Vehicle-to-Grid Demonstration Project: Grid Regulation Ancillary Service with
a Battery Electric Vehicle. San Dimas, CA: AC Propulsion.
Brooks, A., and Gage, T. (2001). Integration of Electric Drive Vehicles with the Electric Power Grid -
a New Value Stream. EVS 18. Berlin.
Bundesnetzagentur (2006). Beschlusskammer 6. (Translation: Board of decision 6). Retrieved 31
March 2009, from http://www.bundesnetzagentur.de/media/archive/7318.pdf
Bäck, C. (2008). Interviews in Råcksta and by phone, and emails, October – December 2008. Svenska
Kraftnät.
27
28. Camus C, J. Esteves ,T.L. Farias (2009) Electric Vehicles and the Electricity Sector Regulatory
Framework: The Portuguese example Proceedings of EVS24, Stavanger, May 13-16 2009.
Galus, M.D., Andersson, G. (2008). Demand Management of Grid Connected Plug-In Hybrid Electric
Vehicles (PHEV). Energy 2030 Conference, 2008. ENERGY 2008. IEEE , pp.1-8, Atlanta, GA.
Galus, M. D., Andersson, G. (2009). Power System Considerations of Plug-In Hybrid Electric
Vehicles based on a Multi Energy Carrier Model. IEEE Proceedings of Power and Energy Society
(PES) General Meeting, (pp. 1-8). Calgary, Canada.
Göransson, L. (2008). Wind Power in Thermal Power Systems. Licentiate thesis: Department of
Energy and the Environment. Göteborg, Chalmers University of Technology.
Göransson, L., Karlsson, S., Johnsson, F. (2009). Plug-in hybrid electric vehicles as a mean to reduce
CO2 emissions from electricity production. Proceedings of EVS24, Stavanger, May 13-16 2009.
Grahn M., Azar, C., Williander, M.I., Andersson, J.E. , Mueller, S.A. , Wallington, T.J. ( 2009). Fuel
and vehicle technology choices for passenger vehicles in achieving stringent CO2 targets: connections
between transportation and other energy sectors. Environmental Science and Technology, 43: 3365-
3371.
Hedenus, F., Karlsson, S., Azar, C. , Sprei, F. (2009). The transportation energy carrier of the future.
System interactions between the transportation and stationary sectors in a carbon constrained world.
Proceedings of EVS24, Stavanger, May 13-16 2009.
Hjalmarsson, L., Söder, L. (2001). Systemtjänster (Translation: Balance Services). Stockholm: Royal
Institute of Technology KTH.
Kempton, W., Tomic, J. (2005). Vehicle-to-grid power fundamentals: Calculating capacity and net
revenue. Journal of Power Sources 144(1): 268-279.
28
29. Kristiansen, T. (2007). The Nordic approach to market-based provision of ancillary services. Energy
Policy, 35: 3681-3700.
Larsen, E., Chandrashekhara, D. K. , Östergård, J. (2008). Electric Vehicles for Improved Operation of
Power Systems with High Wind Power Penetration. IEEE Energy 2030. Atlanta, GA.
Lund, H., Kempton, W. (2008). Integration of renewable energy into the transport and electricity
sectors through V2G. Energy Policy, 36, 3578-3587.
Markel, T., Simpson, A. (2006). Plug-In Hybrid Electric Vehicle Energy Storage System Design.
Advanced Automotive Battery Conference. Baltimore, Maryland, National Renewable Energy
Laboratory.
Nordel (2008). Description of Balance Regulation in the Nordic Countries. Nordel (Organisation for
the Nordic Transmission System Operators).
Rebours, Y. G. (2007). Some Salient Features of the Management of Frequency and Voltage Control
Ancillary Services. Power Engineering Society General Meeting, 2007. IEEE, p.1-6.
Regelleistung (2008). Regelleistung.net, Ausschreibungsergebnisse (Translation: Announcement of
results) Retrieved 2 November 2008, from
https://www.regelleistung.net/regelleistungWeb/veroeffentlichung/VeroeffentlichungController.jpf?ne
xtpage=AUS_ERG.
Regelleistung (2009). Regelleistung.net, Anbieteranforderungen SRL Poolkonzept (Translation:
Requirements on provider of secondary control) Retrieved 31 March 2009, from
https://www.regelleistung.net/regelleistungWeb/download/public/20090130_Anbieteranforderungen_
SRL_Poolkonzept
29
30. Ritsch, K. (2004). Wissensorientierte Gestaltung von Wertschöpfungsnetzwerken. TU Graz.
Dissertation. Retrieved 31 March 2009, from http://www.wm-
forum.org/files/dissertationen/Dissertation-Ritsch.pdf
Ripstrand, P. (2008). Email, 28 October 2008. Historical control power market data. Nordpool.
Schulz, G. (2008). Phone interview, 20 November 2008. Vattenfall Europe Transmission.
Söderbom, J. (2008). Emails and interviews, October-December 2008. Vattenfall AB.
Thor, T. (2008). Email, 3 November 2008. Frequency data. Svenska Kraftnät.
Tomic, J., Kempton, W. (2007). Using fleets of electric-drive vehicles for grid support. Journal of
Power Sources 168: 459–468.
UCTE (Union for the Co-ordination of Transmission of Electricity) (2004). Operation Handbook
Retrieved 15 September 2008 from http://www.ucte.org/resources/publications/ophandbook/
Vattenfall (2008a). Vattenfall Production Nordic. Jämför elpriser - prislista och jämförpris.
(Translation: Compare power prices) Retrieved 20 October 2008, from
http://www.vattenfall.se/www/vf_se/vf_se/500776priva/500806el/575797detal/index.jsp.
Vattenfall (2008b). Vattenfall Europe. Berlin Klassik Privatstrom. (Translation: Berlin Classic Private
Consumers) Retrieved 20 October 2008, from
http://www.vattenfall.de/www/vf/vf_de/202436priva/202496produ/704834berli/index.jsp.
Vattenfall (2008c). Vattenfall Transmission Europe. Eingesetzte Minutenreserve. (Translation:
Activated tertiary control), and Eingesetzte Sekundärregelleistung (Translation: Activated secondary
control) Retrieved 1 November 2008, from
http://www.vattenfall.de/www/trm_de/trm_de/178414ausgl/177385regel/178488abruf/177777einge/in
dex.jsp. and
30