1. Abstract
!Bumble bees (genus Bombus) are wild pollinators that are important, from an ecological and
economic standpoint. Many Bombus species are suffering from severe population declines. Research on Bombus
populations will aid in the understanding of the severity of their sudden decline. The goal of this project is to
assess the diversity of Bombus in two counties in Michigan: Wayne and Oakland. The results of this study will
provide insights to the local diversity and abundance of these insects, potentially reveal refugia, and contribute
to the understanding of their decline. Data were collected on the following: species identities, frequency, the
location, type of habitat, and local weather . These data were compared to a similar study preformed in
Kanawha County, West Virginia in order to determine population shifts and patterns.
Introduction
Bumble bees (Bombus spp.) are are the native social pollinators of North America. They play
an incredibly vital part in the pollination of plants, flowers and crops all over the world (Bumble Bee
Conservation Trust 2014). Along with their relative, the honey bee (Apis mellifera), Bombus are very important
ecologically and economically (Grixti et al. 2009). Because of their long tongues, bumble bees can pollinate
flowers that Apis mellifera cannot pollinate as effectively. The pollination services that bumble bees provide
have an economic value well into the billions, each year (Goulson 2003).
Bumble bees are facing many problems that are resulting in population decreases and
collapses of multiple different species, on a global level (Kleijn and Raemakers 2008). The relative abundance
and distributions of several bumble bees species have been compromised over the past few decades due to
multiple factors. Studies have not found a concrete reason for their decline, but strong correlations have been
made with intensive agriculture, parasites, pesticides and climate change (Carvell et al. 2011; Kerr et al. 2015).
Many North American bumble bee species have shown rapid population decreases, and collapses in the past
decade (Cameron et al. 2011). In the past two decades there have been four species that have shown a huge
plummet in population numbers: B. occidentalis, B. affinis, B. pensylvanicus, and B. terricola (Brown 2011;
Kaufman 2011). Two of these species have been majorly observed to be declining in the eastern more region of
the United States: B. affinis and B. terricola (Colla and Packer 2008).
The ultimate goal of this project is to get a better picture of the relative abundances and
distributions of the native bumble bees. The results of this project will contribute to the understanding of the
local diversity of these insects, but will also generate valuable data regarding the decline of these pollinators and
perhaps identify the locations of refugia where declining species may occur in higher densities than expected.
Methods
To asses the local distributions and relative abundances of the populations in Wayne and
Oakland Counties, Bombus were collected as free flying foragers from four target sites, two in Wayne County
and two in Oakland. The two sites in Wayne County were Lola Valley Park and Hillcrest Park. The Oakland
county sites were Carpenter Lake Nature Preserve and Lahser Park. Each site was visited once a week between
the times of 10 AM and 2 PM. The duration of one hour and thirty minutes was spent at each site, collecting
individual foragers in a large butterfly net by aerial sweep. The Bumble bees were immediately transferred into
a vial for identification, while quality captures were transferred into a jar saturated with ethyl acetate. Some of
the individual foragers that were captured were identified and released back out into the wild, once
identification was finished. The individuals that were not able to be identified in the field were taken back to the
lab for identification. Quality individuals were kept and pinned for collection. Collection took place during the
months of June, July, August and September 2015, since those are the months that bumble bee colonies are a
their peak. The data collected throughout this study was on the identities of species, locations, frequencies, and
weather. The frequency of individuals was calculated using the proportions of each species collected. For
example, there were 103 B. bimaculatus collected through the survey, and a total of 608 bumble bees, therefore
the proportion of B. bimaculatus would be 103/608 or 0.169. The frequency was calculated for each species,
including the species found in West Virginia. The frequencies are compared in Figure 2.
Diversity index calculations were used to analyze the evenness of each species captured and
identified. The Shannon-Wiener index takes into account species richness and proportions, and
explores the diversity of community (Maryland Sea Grant 2015). The Shannon-Wiener diversity index
(H) can be used to find the ‘evenness’ of the populations. The evenness of populations is how
similar the abundance's of the different species are, and the value ranges from 0-1 (Maryland Sea
Grant 2015). An evenness value of 1 indicates complete evenness of a population, and the value
decreases when the community is skewed toward one, or a few species (Synonym 2015). H values
typically range from 1.5-3.5, but the minimum value is 0, and values are rarely seen above 4
(Magurran 2004, Maryland Sea Grant 2015). H increases as the richness and evenness increase
(Magurran 2004). Simpson index is a measure of dominance, and measures the probability of two
individuals from a population infinitely large being selected at random, and those two individuals
being from the same species (Magurran 2004). The values of the Simpson index range from 0-1, with
higher values indicating less diversity in the community (Barcelona Field Studies Centre S.L 2015).
Discussion
Several different species of bumble bees have been in decline since the 1950’s, and this
decline has morphed into complete population collapses for some species (Brown 2011). Over the last two
decades these populations’ decline has become even more dramatic (Cameron et al. 2011). Research has been
performed in many different areas all over the United States, Canada and especially Europe, but this study is the
first of its kind in Michigan. The condition of the Bombus populations in Michigan is not well known; therefore
the goal is to get a better idea of the status of these important insects.
This survey covered only a small portion of the state, two counties: Wayne County and
Oakland County. Four collection sites were chosen, two in each county. Lola Valley Park and Hillcrest Park are
located in Wayne County, and Lahser Park and Carpenter Lake Nature Preserve are located in Oakland County.
The ultimate goal of this project is to get a better picture of the abundance and distributions of the native bumble
bees. Although the survey area was comparatively a small region, the data collected is analogous to other
projects and studies that have been performed in other sectors of the United States and Europe. The patterns
observed with the bumble bees collected and identified showed a similar pattern compared to the study
performed in West Virginia in 2014. On the other hand, statistical analysis showed that the findings were not
significantly similar whatsoever.
In the past two decades there have been four species that have shown a huge plummet in
population numbers: B. occidentalis, B. affinis, B. pensylvanicus, and B. terricola (Brown 2011; Kaufman
2011). Two of these species have been majorly observed to be declining in the eastern more region of the United
States: B. affinis and B. terricola (Colla and Packer 2008). These four species showed to absent from the survey
performed in Michigan, although a single B. terricola, and two B. pensylvanicus were found in the survey done
in West Virginia in 2014. This observation supports the previous evidence showing the population decline of
these four species. For the few endangered bees found in West Virginia, the observations conclude that those
species are very scarce, but not completely absent, suggesting that there may be areas of refugia that were not
identified. These areas of refugia could be supporting the few colonies of endangered species left. The
difficultly with this study being the first of its kind in Wayne and Oakland Counties, Michigan, is that there was
no previous data to compare to. The only data that could compare was the same study done in Kanawha County,
West Virginia in 2014. Statistical analysis comparing the data collected in both loci showed significant
differences between states, sites and species. This could be due to the significant habitat differences between the
states and sites of collection. The lack of similarity in flora between sites accounts for the significant differences
between species also, because different species feed and pollinate from different flowers. Another factor
explaining the differences is the fact that different species have different tongue lengths, and therefore each
species is selective in the flowers they chose. Competition between species with similar tongue lengths could
possibly explain the frequencies of species found at each site.
Although the bumble bee species mentioned previously are in severe decline, there are species
that are abundant and flourishing. Three of the species seen in the data consumed the majority of the data,
together representing 91% of the total fauna collected. The pattern has also been seen in other studies done;
therefore it was expected to see an abundance of these species. Based on the findings, fauna collection was
dominated by a few species, and the diversity analyses support that finding also.
While it is apparent that as a whole, bumble bees are declining, it is equally apparent that
whatever is lowering the fitness of many Bombus, does not affect all species equally (Lozier and Cameron
2009). Contributing to the mystery of the disappearing bumble bees is the fact that it may have a phylogenetic
basis. Though there have been many hypotheses proposed to explain the declines observed in bumble bees
(pesticides, Nosema bombii infections, agricultural intensification) the actual cause remains elusive. The hope is
that the findings from this study will contribute substantially to the understanding of this ecological catastrophe.
References
!Brown, Mark J. F. 2011. The Trouble With Bumble Bees. Nature. 469.7329:169.
Bumble Bee Conservation Trust. 2014. Heritage Lottery Fund, Scottish Natural History, and The Redwing
Trust, n.d.
Cameron SA, Lozier JD, Strange JP, Koch JB, Cordes N, Solter LF, Griswold TL. 2011. Patterns of
widespread decline in North American bumble bees. Proc. Natl. Acad. Sci. USA 108:662-667.
Colla S, Packer L. 2008. Evidence for decline in eastern North American bumblebees (Hymenoptera: Apidae),
with special focus on Bombus affinis Cresson. Biodivers. Conserv. 17:1379-1391.
Carvell C., J. L. Osborne, A. F. G. Bourke, S. N. Freeman, R. F. Pywell and M. S. Heard. 2011. Bumble
bee species' responses to a targeted conservation measure depend on landscape context and habitat quality.
Ecological Applications. 21.5:1760-1771.
Grixti JC, Wong LT, Cameron SA, Favret C. 2009. Decline of bumble bees (Bombus) in the North American
Midwest. Biol. Conserv. 142:75-84.
Goulson D. 2003. Effects of introduced bees on native ecosystems. Annu. Rev. Ecol. Systemat. 34:1-26.
Kaufman, Rachel. 2014. Bumblebees Taking a Nosedive in North America. National Geographic.
Kerr ———————————
Kleijn, David and Ivo Raemakers. 2008.A Retrospective Analysis of Pollen Host Plant Use by Stable and
Declining Bumble Bee Species. Ecology. 89.7:1811-1823.
!!
Density and Diversity of Bumble bee species; a comparison of Wayne and Oakland counties, Michigan, and Kanawha county, West Virginia.
By Erica Bickham
Faculty sponsor Dr. Jamin Eisenbach
B. impatiens B. bimaculatus
B. fervidus
B. griseocollis
B. auricomus
Eastern Michigan University
West Virginia
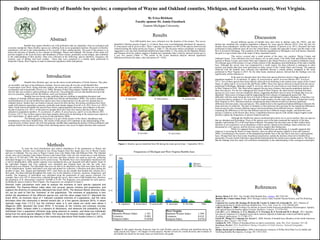
Shannon-Wiener Index: 1.349
Evenness: 0.614
Simpson Index: 0.6761
Michigan
Shannon-Wiener Index: 1.101
Evenness: 0.684
Simpson Index: 0.4446
Figure 2: Bar graph showing frequency data for each Bombus species collected and identified during the
study period (see Figure 1 for images of each species). Results of tests for overall diversity and evenness of
the bumble bee fauna for the study areas are listed below the graph.
Figure 1: Bombus species identified from MI during the study period (June – September 2015).
Frequencies of Michigan and West Virginia Bumble bees
0
0.18
0.35
0.53
0.7
B. impatiens B. bimaculatus B. griseocollis B. auricomis B. fervidus Other
MI bees
WV bees
386
242
103
212
69
21 31
61412
Results
Over 600 bumble bees were collected over the duration of the project. The survey
identified 5 Bombus species (Figure 1), of which, three were overwhelmingly dominant (B. impatiens,
B. bimaculatus and B. griseocollis). These 3 species represented over 90% of the species observed and
collected during the study period (see Figure 1; Table 1). The diversity indices calculated, as expected,
suggested a very unevenly distributed bumble bee fauna (Table 1). The values for the Shannon-Wiener
and Simpson diversity indices suggest a bumble bee community that is heavily skewed toward one or
a very few species (Table 1). The results of the G-test statistical analysis showed significant
differences between the states, sites and species (P < 0.05).
!
2. B. auricomus B. bimaculatus B. griseocollis B. impatiens B. pensylvanicus
B. impatiens B. griseocollis B. auricomus B. bimaculatus B. pensylvanicus B. fervidus B. terricola B. vagans
B. perplexus
B. perplexus