SlideShare a Scribd company logo
1 of 14
Download to read offline
©INTERNATIONAL CENTRE FOR DIARRHOEAL
DISEASE RESEARCH, BANGLADESH
J HEALTH POPUL NUTR	 2015 Mar;33(1):92-105
ISSN 1606-0997 | $ 5.00+0.20
Correspondence and reprint requests:
Dr. S.M. Mostafa Kamal
Visiting Research Fellow
Unit for the Enhancement of Academic
Performance
University of Malaya
50603 Kuala Lumpur, Malaysia
and
Professor
Department of Mathematics
Islamic University
Kushtia 7003
Bangladesh
Email: kamaliubd@yahoo.com
Fax: +6-03-2246-3348
INTRODUCTION
Due to economic situation of developed countries,
health concern mainly on overweight receives
graver attention. The ‘dual burden’ of health con-
cern caused through both underweight and over-
weight is significantly important for public health
policy in developing nations to address (1-3). Stud-
ies confirm that these days the problem of over-
weight in developing nations is gradually taking
the driving seat superseding the concerns of under-
weight due to changes of food habit and lifestyle
and working culture (1). There is evidence that this
Dual Burden of Underweight and Overweight
among Women in Bangladesh: Patterns,
Prevalence, and Sociodemographic Correlates
S.M. Mostafa Kamal1
, Che Hashim Hassan2
, Gazi Mahabubul Alam2
1
Department of Mathematics, Islamic University, Kushtia 7003, Bangladesh and Visiting Research Fellow, Unit for the
Enhancement of Academic Performance, University of Malaya, 50603 Kuala Lumpur, Malaysia; 2
Unit for the Enhancement
of Academic Performance, University of Malaya, 50603 Kuala Lumpur, Malaysia
ABSTRACT
The discourse of dual burden caused through underweight and overweight is well-documented globally but
this issue and its connection with women’s health in Bangladesh is yet to be explored widely. To enrich the
current debate, this study, in the context of Bangladesh, examines the patterns, prevalence, and socioeconomic
factors influencing the ever-married women of being underweight and overweight over normal weight. Data
used in this study have been extracted from the most recent 2011 Bangladesh Demographic and Health Sur-
vey. To achieve results connected with the research objectives, both bivariate and multivariate statistical analy-
ses have been employed. In bivariate analysis, we used seven categories of BMI cutoff points for Asian countries
as prescribed by World Health Organization (WHO). Multinomial logistic regression model was constructed to
investigate the net effect of socioeconomic factors on underweight, pre-overweight, and overweight over nor-
mal weight. The results confirm the co-existence of underweight and overweight among women as we found
the prevalence of underweight, normal weight, pre-overweight, overweight, and obesity to be 24.1%, 46.7%,
12.8%, 13.5%, and 2.9% respectively. Compared to the richest, the women from the poorest households were
significantly (p<0.001) most likely to be underweight (OR=2.75, 95% CI 2.27-3.35) and least likely to be over-
weight (OR=0.15, 95% CI 0.12-0.19) over normal weight. The urban women, compared to their rural counter-
parts, were significantly (p<0.001) less likely to be underweight (OR=0.80, 95% CI 0.71-0.91) and more likely
to be overweight (OR=1.33, 95% CI 1.18-1.51) than normal weight. The other socioeconomic grades that were
most marked to be underweight and overweight are age, women’s education, marital status, age at first child-
birth, parity, number of children aged ≤5 years at the household, and food security. The findings confirm the
dual burden of both under- and overweight. Systematic and regular monitoring and surveillance of the social
trajectory of nutritional status of women and men in Bangladesh is crucial to develop apposite strategy that
addresses the persistent and chronic problem of underweight and the emerging problem of overweight. The
dual existence of both types of malnutrition among women in Bangladesh must be taken into consideration
so that public health interventions may be adopted through appropriate policy.
Key words: Dual burden; Malnutrition; Overweight; Underweight; Bangladesh
Kamal SMM et al.Dual burden of underweight and overweight in Bangladeshi women
Volume 33 | Number 1 | March 2015 93
increase has been faster in the developing countries
(2). The positive relationship between obesity and
socioeconomic position in developing countries
stood in sharp contrast with the inverse association
observed in developed countries where the preva-
lence of obesity is higher among women from low
socioeconomic groups (3).
A landmark review of studies on socioeconomic
status and obesity supports the view that obesity in
the developing world would be essentially a non-
communicable disease of the socioeconomic elite
(2). The problem relating to body mass index (BMI)
for both men and women should receive equal at-
tention. However, concerns relating to women in
developing countries deserve extra attention be-
cause of cultural and economic backdrops, which
hinder the blanching between male and female
counterparts. An augmented number of literature
asserts that an increased BMI of women is inde-
pendently associated with increasing risk of adverse
obstetric and neonatal outcome (4-6). The risks of
overweight also include diabetes mellitus, increased
risk of cardiovascular disease, cancer, hypertension,
and other medical problems (7-16). Besides, a low
BMI is often associated with low nutritional status
and adverse health outcomes (12), such as preterm
birth (17,18), low birthweight (17), mental health
impairment (19), increased risk of early mortality
(20), and higher risk of infant mortality (14). Early
and late stillbirths are also associated with under-
weight mothers compared to their normal-weight
counterparts. Anaemia is also associated with ma-
ternal underweight (9). Low pre-pregnancy BMI
and short stature of women are known risk factors
of poor maternal and birth outcomes. In develop-
ing countries, like Bangladesh, maternal under-
weight is a leading risk factor of preventable death
and diseases.
Both lean and obese women carry a risk of adverse
pregnancy outcome and overall poor maternal and
child health status. Thus, there is growing recogni-
tion of a ‘double burden’ of malnutrition among
populations in both affluent and less-affluent
countries (21), i.e. the co-existence of undernu-
trition (e.g. stunting or underweight) with over-
weight, which has been observed at the national
and household levels (22); this suggests the necessi-
ty of population-based assessments of the patterns,
prevalence, and determinants of underweight and
overweight among women of reproductive age. Us-
ing BMI as an important indicator of nutritional
status, it is our aim to examine the nature of the re-
lation between individual sociodemographic cate-
gory and nutritional status among married women
of Bangladesh and also investigate to what extent
the factors influence the women to be underweight
and overweight.
MATERIALS AND METHODS
Data for this study have been used from the most
recent 2011 Bangladesh Demographic and Health
Survey (BDHS) (23). A nationally-representative
household-based sample was created through a
stratified and two-stage cluster-sampling strategy.
A uniform sampling design was adopted across all
regions with urban and rural samples drawn sepa-
rately and in proportion to the population of the
regions, unless oversampling was required for any
region or group. For both urban and rural areas,
geographic sampling units were obtained, and ran-
dom sampling of households was done in chosen
units. The survey provides consistent and reliable
estimates of fertility, age at first marriage, family
planning, utilization of maternal and child health-
care services, nutrition of children and adults, ma-
ternal and child health, knowledge and awareness
about sexually transmitted diseases (STDs)/sexually
transmitted infections (STIs), HIV/AIDS, and other
health-related indicators at the national as well as
the regional levels.
The 2011 BDHS gathered information on 17,749
ever-married women aged 15-49 years. The women
with various missing information and those who
were pregnant during the survey were excluded
from analysis. After excluding women with miss-
ing information (n=407) on the outcome measure
and those who were pregnant (n=1,069) during
the survey, the final sample for analysis stood at
16,273. Table 1 provides descriptive characteristics
of the weighted sample that have been tabulated
according to nutritional status for variables consid-
ered in the study.
Outcome measure
Women’s weight status, indicated by their BMI
category, was used as the outcome variable in the
analyses. BMI was calculated as weight in kg di-
vided by height in metre squared. This measure-
ment of BMI is generally considered an appropriate
method for epidemiological studies where objective
measurement is less feasible. The well-trained field
staff during at-home interviews measured body-
size. Weight was measured using an electronic scale
with a precision of 0.1 kg, and height was meas-
ured with an adjustable measuring-board designed
for use in survey settings, which can provide accu-
Kamal SMM et al.Dual burden of underweight and overweight in Bangladeshi women
JHPN94
Table 1. Definition of variables and percentage distribution of ever-married women*(N=16,273) aged
15-49 years, BDHS 2011
Exposure variable Description Measurement scale No. %
Demographics
Current age
(completed years)
Current age of the women at
the time of survey
Ordinal
1=15-24 4,674 28.7
2=25-34 5,564 34.2
3=35-49 6,035 37.1
Current marital status Respondent’s marital status at
survey time
Ordinal
1=Married 15,199 93.4
2=Widowed/
Divorced/Separated
1,074 6.6
Age at first childbirth
(years)
Respondent’s age at first
livebirth of child
Ordinal
1=<18 8,050 53.7
2=18+ 6,928 46.3
Parity Number of children ever born
Ordinal
1=<3 8,702 53.5
2=3+ 7,571 46.5
No. of children aged
≤5 years
Total number of children
aged 5 years or below at the
household
Ordinal
1=None 7,950 48.9
2=One 6,018 37.0
3=Two+ 2,305 14.2
Socioeconomics
Women’s education Women’s level of education
Ordinal
0=No education 4,653 28.6
1=Primary 4,889 30.0
2=Secondary 5,581 34.3
3=Higher 1,151 7.1
Employment status Whether respondent was em-
ployed at the time of survey
Binary
0=Not employed 14,096 86.6
1=Employed 2,177 13.4
Wealth index Availability of luxurious ma-
terials in the household
Ordinal
1=Poorest 2,976 18.3
2=Poorer 3,169 19.5
3=Middle 3,265 20.1
4=Richer 3,390 20.8
5=Richest 3,473 21.3
Food security Whether the household had
deficiency of food
Ordinal
1=Secure 10,899 67.0
2=Mild insecurity 3,621 22.3
3=Moderate insecurity 1,269 7.8
4=Severe insecurity 480 3.0
Contd.
Kamal SMM et al.Dual burden of underweight and overweight in Bangladeshi women
Volume 33 | Number 1 | March 2015 95
rate measurements to the nearest 0.1 cm. The BMI
was presented in the raw dataset of the survey. The
WHO consultants suggest seven categories of BMI
cutoff points for Asian countries (24): <16.00 kg/m2
(severe underweight), 16·00-16·99 kg/m2
(moder-
ate underweight), 17·00-18·49 kg/m2
(mild under-
weight), 18·50-22·99 kg/m2
(normal weight), 23.00-
24.99 kg/m2
(pre-overweight), 25.00-29·99 kg/m2
(overweight), and ≥30.00 kg/m2
(obese). Given the
identification of a BMI of 23.00 as a public-health
cutoff for risk of obesity in Asian populations (24)
and the emerging evidence suggesting that lower
cutoffs are appropriate for populations from the
Indian Subcontinent (2,25,26), we narrowed the
normal BMI range of 18.50-24.99 to 18.50-22.99.
Following the abovementioned literature on Asian
countries, we used three grades of underweight and
overweight.
Exposure variables
The study considers demographic, socioeconomic
and environmental factors to assess the nutritional
status of the study women. The effect of one vari-
able on the prevalence of malnutrition is likely to
be confounded with the effects of other variables.
Therefore, demographic, socioeconomic and en-
vironmental characteristics were controlled sta-
tistically. The variables included as covariates are:
women’s current age at interview, current marital
status, age at first childbirth, parity, number of
children aged ≤5 years in the household, women’s
education, place of residence, the region, wealth
quintile, and food security.
Notably, measurement of poverty and food secu-
rity is complex and debatable, particularly due to
the unavailability of direct and reliable information
on household income or expenditure in cross-
sectional sample surveys, like BDHS. Despite this,
the 2011 BDHS has used wealth index in a conven-
tional way as a proxy measure of socioeconomic
status and food security for the first time. The rela-
tive index of household wealth was calculated on
the basis of a standard set of interviewer-observed
assets, including the ownership of consumer items
and dwelling characteristics. Besides, food security
was measured by the response provided by the re-
spondents to the question, “Did you ask food from
relatives or neighbours in the past 12 months di-
rectly?” The operational definition and categories
of the variables are given in Table 1.
Statistical analyses
The weighted prevalence of severe underweight,
moderate underweight, mild underweight, normal
weight, pre-overweight, overweight, and obesity
was obtained for each category using the national
weights assigned by the cluster design at the prima-
ry sampling unit level. The chi-square tests were ap-
plied to study the difference in proportions of dif-
ferent BMI between the categories of the exposure
variables. The checking of multicollinearity by the
estimated variance inflation factor (VIF) shown in
Table 2 from multivariable linear regression model
reveals its non-existence (27).
To assess the net effect of exposure variables on the
outcome measures, multinomial logistic regression
analysis was contemplated to be suitable as the out-
come measure is polychotomous by nature. The
Table 1.—Contd.
Exposure variable Description Measurement scale No. %
Environmental
Place of residence Current place of residence
Ordinal
1=Urban 4,248 26.1
2=Rural 12,025 73.9
Region Place of region
Ordinal
1=Barisal 886 5.4
2=Chittagong 2,928 18.0
3=Dhaka 5,236 32.2
4=Khulna 2,018 12.4
5=Rajshahi 2,442 15.0
6=Rangpur 1,908 11.7
7=Sylhet 854 5.2
Total 16,273 100.0
*Total number of women by different categories of exposure variables may not always be 16,273 due to
missing cases
Kamal SMM et al.Dual burden of underweight and overweight in Bangladeshi women
JHPN96
Pr (yi
= j | xi
)= ——————
exp (χi
βj
)
j
k=1
exp (χi
βj
)∑
multinomial logistic model is the extension of the
binary logistic regression model to outcome meas-
ure with j=1, 2, 3, ..., k nominal outcomes. In its
general form, the probability of an actor i belonging
to category j is given by the following formula (28):
where χi
is a vector containing the values of m co-
variates for person i, and βk
is a vector of m +1 pa-
rameters (β0k,
β1k,
β2k
..., βmk
) for each k=1, 2, 3, ..., j.
To identify the parameters, it is common to choose
one reference category and set the corresponding
vector of parameters equal to a vector of zeroes.
As we did not find substantial differences in the
patterning of the sociodemographic and environ-
mental exposures between the different grades of
underweight, we merged the different grades of un-
derweight to one category of BMI <18.50 labelling
by ‘underweight’. Similarly, we merged overweight
and obesity by labelling as ‘overweight’. The re-
sults of the multinomial logistic regression analy-
ses have been shown by odds ratios (ORs) with
95% confidence interval (CI) for easy understand-
ing. The level of significance was set at 10%. Data
were analyzed using SPSS (version 21) (SPSS Inc.,
Chicago, IL, USA).
Ethical issue
The study was based on a nationally-representative
anonymous dataset for public use, with no identifi-
able information on the survey participants. More-
over, the survey followed all protocols prescribed
by the WHO and was implemented by National
Institute for Population Research and Training
(NIPORT) under the Ministry of Health and Family
Welfare, Government of Bangladesh. Therefore, no
ethics statement is required for this study.
RESULTS
Characteristics of the sample
Most of the respondents were rural residents and
were currently in union, with mean±SD age of
31.2±9.2 years. The mean age at first marriage,
mean age at first childbirth, mean number of
children ever born per ever-married woman was
15.6±2.9 years, 17.8±3.3 years, and 2.7±1.9 (not
shown in Table 1). Only a few proportions of wom-
en had higher education and were employed dur-
ing survey. The large proportion of the respondents
was from Dhaka region. Almost 11% reported to
have deficiency of food whereas five categories of
wealth quintiles demonstrated nearly equal distri-
bution of women.
BMI and sociodemographic factors
The distribution of women across categories of BMI
shows that 46.7% were normal, 24.2% were under-
weight, 12.8% were pre-overweight, and 16.4%
were overweight and obese (Figure 1). The associ-
ated p values in chi-square analysis suggest signifi-
cant difference (p<0.01) in seven categories of BMI
by different groups of exposure variables, except for
the women’s employment status (Table 3). The es-
Obese
Overweight
Pre-overweight
Normal
Mildly thin
Moderately thin
Severely thin
2.9
13.5 Grades of overweight
12.8
14.4
46.7
6.0
3.8
0 10 20
Percentage
30 40 50
GradesofBMI
Grades of underweight
Figure 1. Distribution of ever-married women of reproductive age by different strata of BMI, BDHS 2011
Kamal SMM et al.Dual burden of underweight and overweight in Bangladeshi women
Volume 33 | Number 1 | March 2015 97
timated coefficients of the multivariable regression
model show significant positive relationship be-
tween BMI and current age (p<0.001), women’s level
of education (p<0.001), and wealth index (p<0.001)
whereas negative association was observed for cur-
rent marital status (p<0.001), age at first childbirth
(p<0.001), parity (p<0.001), number of children
aged ≤5 years in household (p<0.001), residence
(urban to rural) (p<0.001), and food security (secure
to insecure) (p<0.001). Region was also a significant
factor (p<0.05) for nutritional status of women.
Trends in BMI by cutoff points
Figure 2 shows that the prevalence of normal
weight was steady in the period 2004 to 2007 and
then decreased by 2.0% from 48.7% to 46.7% dur-
ing 2007 to 2011. We noted significant decrease
of the pervasiveness of underweight for the same
period. The prevalence of underweight decreased
by 9.9%—from 34.2% to 24.1% during 2004 to
2011. The figure exhibits an apparent increasing
trend in all grades of overweight. For instance, the
prevalence of pre-overweight increased by 4.2%—
from 8.2% to 12.4%—whereas the rate of over-
weight and obesity increased by two folds during
the period 2004-2011. Markedly, the addition of all
grades of overweight reveals that the prevalence of
overweight exceeded the underweight body-shape
of women in 2011.
Determinants of underweight,
pre-overweight, and overweight
Table 4 shows the adjusted ORs for underweight,
pre-overweight, and overweight relative to the nor-
mal weight for the covariates considered for analy-
sis. Compared to the elder, the younger were more
likely to be underweight. Age was positively associ-
ated with pre-overweight, overweight, and obesity,
relative to normal weight. The likelihood to be un-
derweight was significantly lower for the currently-
married women than those who were not in union
during the survey. The current marital status was
no longer a significant factor for pre-overweight
and overweight, controlling for other covariates.
The women who had given first childbirth before
the age of 18 years were less likely to be under-
weight, although it showed to have no significant
effect on other categories of BMI. The women with
fewer children aged ≤5 years at the household were
less likely to be underweight and more likely to be
overweight than those who had more.
Women’s level of education was significantly and
negatively associated with being underweight and
was positively associated with pre-overweight and
overweight relative to normal weight. The wealth
quintiles show familiar fashion in the likelihood
of being underweight and overweight. The risk of
being underweight increased systematically with
the decreases in wealth index. In contrast, the risk
of being pre-overweight and overweight decreased
significantly with the increase of standard of liv-
ing index. The higher the food security, the lower
the risk of being underweight. However, food se-
curity had no longer significant effect of being
pre-overweight and overweight.
The rural women, compared to their urban counter-
parts, were more likely to be underweight whereas
urban women were more tended to be overweight
than their rural counterparts. The women living in
theBarisal,Chittagong,Dhaka,Khulna,Rajshahiand
Rangpur regions were less likely to be underweight
compared to the reference region of Sylhet. Besides,
the women from Chittagong, Khulna and Rajshahi
regions were more tended to be pre-overweight and
Table 2. Multivariable regression coefficients and the variance inflation factor (VIF) for predictors
with BMI as outcome measure adjusted for duration of marriage
Predictor Coefficient SE t-value p value VIF
Age 0.087 0.005 16.635 0.000 2.721
Current marital status -0.818 0.122 -6.691 0.000 1.097
Age at first childbirth -0.026 0.010 -2.646 0.008 1.343
Parity -0.174 0.024 -7.355 0.000 2.179
No. of children aged ≤5 years -0.212 0.046 -4.651 0.000 1.345
Women’s level of education 0.383 0.039 9.774 0.000 1.656
Employment status -0.052 0.086 -0.602 0.547 1.074
Wealth quintile 0.760 0.027 28.275 0.000 1.808
Food security -0.140 0.040 -3.485 0.000 1.218
Place of residence -0.823 0.074 -11.082 0.000 1.326
SE=Standard error
Kamal SMM et al.Dual burden of underweight and overweight in Bangladeshi women
JHPN98
Table3.Distributionofever-marriedwomenacrosscategoriesofBMIbydifferentpredictors,BDHS2011
Backgroundcharacteristics
BMI(kg/m2
)category
χ2
<16.0016.00-16.9917.00-18.4918.50-22.9923.00-24.9925.00-29.99≥30.00
Currentage(completedyears)590.54a
15-243.5(165)7.9(371)19.0(887)52.6(2,457)9.1(424)6.8(319)1.1(51)
25-343.0(165)5.4(298)12.4(692)45.6(2,536)14.5(809)16.1(895)3.0(169)
35-494.7(284)5.0(300)12.5(756)43.2(2,609)14.2(858)16.3(982)4.1(247)
Currentmaritalstatus65.75a
Married3.6(549)5.8(877)14.0(2,126)47.2(7,166)13.0(1,976)13.6(2,063)2.9(442)
Widowed/Divorced/Separated6.1(65)8.6(92)19.5(209)40.5(435)10.7(115)12.4(133)2.3(25)
Ageatfirstchildbirth(years)112.26a
<183.9(316)6.1(488)15.2(1,225)48.4(3,893)12.4(999)11.5(926)2.5(203)
18+3.8(261)5.5(384)12.7(882)44.4(3,073)13.7(950)16.4(1,134)3.5(243)
Parity58.78a
<32.8(240)6.2(541)14.3(1,248)46.9(4,084)13.2(1,151)13.8(1,204)2.7(234)
3+4.9(373)5.7(428)14.4(1,087)46.5(3,518)12.4(939)13.1(992)3.1(233)
No.ofchildrenaged≤5years181.55a
None3.8(304)5.3(421)12.8(1,015)45.0(3,575)14.2(1,132)15.5(1,230)3.4(274)
One3.8(228)6.4(387)14.5(872)48.3(2,910)12.2(734)12.3(741)2.4(145)
Two+3.5(82)7.0(161)19.4(448)48.5(1,117)9.7(225)9.8(225)2.1(47)
Women’seducation689.78a
Noeducation5.7(267)6.7(310)17.2(801)48.1(2,239)11.2(521)9.3(430)1.8(83)
Primary4.0(195)7.2(350)15.5(756)48.2(2,356)11.7(572)11.4(559)2.1(101)
Secondary2.6(143)5.1(285)12.7(711)46.0(2,567)13.9(773)16.0(890)3.8(211)
Higher0.8(9)2.0(23)5.8(67)38.2(440)19.5(224)27.5(316)6.2(71)
Employmentstatus6.53
Notemployed3.7(524)6.0(844)14.5(2,039)46.9(6,607)12.7(1,796)13.3(1,876)2.9(410)
Employed4.1(89)5.7(125)13.6(297)45.7(995)13.5(295)14.7(320)2.6(57)
Contd.
Kamal SMM et al.Dual burden of underweight and overweight in Bangladeshi women
Volume 33 | Number 1 | March 2015 99
Table3.—Contd.
Backgroundcharacteristics
BMI(kg/m2
)category
χ2
<16.0016.00-16.9917.00-18.4918.50-22.9923.00-24.9925.00-29.99≥30.00
Wealthindex2,586.34a
Poorest7.6(225)10.2(304)22.1(658)49.0(1,458)6.2(186)4.6(136)0.3(9)
Poorer4.7(149)7.4(235)17.9(568)53.7(1,700)9.7(308)6.0(191)0.6(18)
Middle3.6(119)6.4(208)15.4(503)50.4(1,546)13.1(427)9.9(322)1.2(41)
Richer2.6(88)4.6(154)12.3(417)45.2(1,531)15.2(514)17.3(586)2.9(98)
Richest0.9(33)1.9(68)5.5(189)36.5(1,266)18.9(655)27.7(961)8.6(300)
Foodsecurity498.30a
Food-secure3.1(334)4.9(533)12.7(1,382)45.6(4,973)14.2(1,549)15.8(1,727)3.7(401)
Mildinsecurity4.8(173)7.4(266)16.5(596)49.3(1,784)10.9(395)9.6(349)1.5(56)
Moderateinsecurity5.9(74)10.5(133)19.0(241)49.5(628)7.9(100)6.8(86)0.6(4)
Severeinsecurity6.7(32)7.7(37)24.2(116)44.2(212)9.6(46)7.2(35)0.5(2)
Placeofresidence940.57a
Urban1.9(81)2.9(123)8.7(368)41.4(1,759)16.5(701)22.3(945)6.4(271)
Rural4.4(533)7.0(846)16.4(1,968)48.6(5,843)11.6(1,390)10.4(1,251)1.6(196)
Region239.28a
Barisal4.5(40)6.6(58)15.7(139)48.9(433)11.9(105)10.7(95)1.8(16)
Chittagong3.3(96)4.7(138)14.2(416)45.5(1,332)14.6(427)14.5(426)3.2(93)
Dhaka4.1(217)6.0(314)13.4(704)45.9(2,403)12.5(653)14.4(755)3.6(190)
Khulna2.2(45)4.5(92)12.1(244)46.7(943)14.7(296)16.6(334)3.2(64)
Rajshahi3.6(87)6.7(164)14.4(351)46.5(1,135)13.4(328)13.1(319)2.4(59)
Rangpur3.6(69)6.9(131)16.4(313)51.9(990)10.6(202)9.2(175)1.4(27)
Sylhet7.0(60)8.3(71)19.7(168)42.7(365)9.3(79)10.8(93)2.1(18)
Total3.8(614)6.0(969)14.3(2,336)46.7(7,601)12.8(2,091)13.5(2,196)2.9(467)
Chi-squaretestsforthecross-tabulationbetweeneachvariableandthesevencategoriesofBMI;a
p<0.001
Kamal SMM et al.Dual burden of underweight and overweight in Bangladeshi women
JHPN100
overweight than those of the reference region. In ad-
dition, compared to the women from Sylhet region,
those living in Chittagong and Khulna were signifi-
cantly at increased risk of overweight.
DISCUSSION
The present study, to our knowledge, examines for
the first time the sociodemographic and environ-
mental distribution of nutritional status of ever-
married women with mean age of 31.2±9.2 years,
using the Asia-specific cutoff points of BMI. The
findings document the co-existence of dual burden
of underweight and overweight among women in
Bangladesh, using data of the most recent national-
ly-representative population sample survey cover-
ing all regions of Bangladesh. Findings show that,
in 2011, the prevalence of underweight, normal
weight, and overweight was 24.1%, 46.7%, and
29.2% respectively, suggesting that the incidence
of overweight exceeded underweight for the first
time. The incidence of underweight has decreased
substantially and continually during the period
from 2004 to 2011.
There is an apparent socioeconomic, demographic
and environmental distribution of causal patterns
of nutritional status, with younger women, women
from low socioeconomic position, and rural resi-
dents experiencing a greater risk of underweight,
and the elder women, those from high socioeco-
nomic status, and urban residents experiencing the
greatest risk of being pre-overweight, overweight,
and obese. Our findings are consistent with earlier
studies conducted on women and men from the
neighbouring country India (2,29-32) and other
developing countries (33,34).
The increased likelihood of being underweight
and decreased risk of being overweight among the
younger women, compared to their elder counter-
parts, and decreased risk of underweight among
women who were currently in union may be partly
attributed to physical activity, cultural norms, and
food practising. Biological phenomena are also
concerned with undernutrition of young women
compared to their elders. The ever-married women
who were not currently in union during the survey
were possibly older than were those who were cur-
rently in union. The martially-disrupted women
in Bangladesh may have less physical activity than
those who live with husbands because of limited
outdoor activities due to specific climatic and social
circumstances. Our findings are supported by ear-
lier studies (32,33). Studies pointed that, although
individual behaviours, such as physical activity
and sound nutritional practices, have been demon-
strated to lead to weight loss, scaling up of these
messages to the population level has proven elusive
(35). Increasingly, those responsible for disease pre-
vention have come to emphasize that individual-
level behaviours are not sufficient, by themselves,
to mitigate the worldwide obesity epidemic (36).
50
45
40
35
30
25
20
15
10
5
0
34.2
29.5
48.748.7
46.7
8.2
10.1 10.1
13.5
1.4 1.7 2.9
12.8
7.5
24.1
U
nderw
eight
N
orm
al
Pre-overw
eight
O
verw
eight
O
bese
Percentage
Grades of BMI
Figure 2. Trends in BMI of ever-married women of reproductive age for the period 2004-2011 by
Asia-Pacific standard
2004
2007
2011
Kamal SMM et al.Dual burden of underweight and overweight in Bangladeshi women
Volume 33 | Number 1 | March 2015 101
Table 4. Adjusted odds ratios (95% CI) for the study variables and covariates from multinomial logistic mod-
el predicting underweight, pre-overweight, overweight, and obesity for the ever-married women
Background characteristics
BMI category
Underweight
vs
Normal weight
Pre-overweight
vs
Normal weight
Overweight/Obese
vs
Normal weight
Current age (completed years)
15-24 1.30 (1.12-1.51)a
0.47 (0.39-0.58)a
0.29 (0.24-0.36)a
25-34 0.95 (0.85-1.06) 0.91 (0.80-1.04) 0.81 (0.71-0.91)b
35-49 Reference Reference Reference
Current marital status
Currently married 0.64 (0.54-0.75)a
1.09 (0.86-1.37) 1.01 (0.82-1.25)
Widowed/Divorced/Separated Reference Reference Reference
Age at first childbirth (years)
<18 0.93 (0.85-1.02)d
1.06 (0.95-1.18) 0.96 (0.87-1.07)
18+ Reference Reference Reference
Parity
<3 0.95 (0.85-1.06) 1.24 (1.09-1.41)a
1.10 (0.97-1.24)d
3+ Reference Reference Reference
No. of children aged ≤5 years
None 0.81 (0.71-0.92)a
1.34 (1.12-1.69)a
1.34 (1.13-1.59)a
One 0.87 (0.77-0.98)b
1.21 (1.02-1.44)c
1.19 (1.00-1.40)c
Two+ Reference Reference Reference
Women’s education
No education 1.78 (1.32-2.40)a
0.79 (0.62-1.01)c
0.59 (0.48-0.74)a
Primary 1.73 (1.29-2.31)a
0.79 (0.63-1.00)c
0.69 (0.56-0.85)a
Secondary 1.52 (1.14-2.02)b
0.86 (0.69-1.06) 0.86 (0.71-1.03)d
Higher Reference Reference Reference
Wealth index
Poorest 2.75 (2.27-3.35)a
0.29 (0.23-0.36)a
0.15 (0.12-0.19)a
Poorer 2.00 (1.65-2.42)a
0.41 (0.33-0.49)a
0.17 (0.14-0.20)a
Middle 1.88 (1.56-2.26)a
0.54 (0.45-0.64)a
0.28 (0.24-0.33)a
Richer 1.68 (1.41-2.02)a
0.69 (0.59-0.81)a
0.53 (0.46-0.61)a
Richest Reference Reference Reference
Food security
Food-secure 0.75 (0.60-0.93)b
0.96 (0.68-1.36) 1.14 (0.78-1.67)
Mild insecurity 0.79 (0.63-0.99)c
0.89 (0.63-1.27) 1.03 (0.70-1.51)
Moderate insecurity 0.84 (0.66-1.07) 0.74 (0.50-1.10) 0.86 (0.56-1.33)
Severe insecurity Reference Reference Reference
Place of residence
Urban 0.80 (0.71-0.91)a
1.09 (0.96-1.25) 1.33 (1.18-1.51)a
Rural Reference Reference Reference
Region
Barisal 0.70 (0.55-0.89)a
1.23 (0.88-1.73) 1.12 (0.80-1.55)
Chittagong 0.62 (0.51-0.76)a
1.44 (1.09-1.90)b
1.35 (1.04-1.75)b
Dhaka 0.71 (0.59-0.85)a
1.05 (0.80-1.38) 1.05 (0.82-1.36)
Khulna 0.52 (0.42-0.65)a
1.35 (1.01-1.81)c
1.52 (1.16-1.99)a
Rajshahi 0.67 (0.55-0.81)a
1.33 (0.99-1.77)c
1.37 (1.05-1.80)a
Rangpur 0.60 (0.49-0.74)a
1.08 (0.80-1.46) 0.97 (0.72-1.29)
Sylhet Reference Reference Reference
a
p<0.001; b
p<0.01; c
p<0.05; d
p<0.10
Kamal SMM et al.Dual burden of underweight and overweight in Bangladeshi women
JHPN102
When the parity and total number of children
aged ≤5 years in household are concerned, the lat-
ter one appeared as a more powerful predictor of
women’s nutritional status than the previous one.
For instance, women with low parity (<3) were sig-
nificantly more tended to be pre-overweight and
overweight, relative to normal whereas the women
with fewer children were less likely to be under-
weight and more tended to be obese, including
pre-overweight and overweight. In patriarchal soci-
ety, like Bangladesh, where childrearing is the main
responsibility of women, the adverse lifestyle risk
factors associated with rearing of many children
at a time significantly affect the women’s health
through a complex way, which includes socioeco-
nomic, demographic, mental, psychological and
also biological factors. However, consistent with
earlier studies (37), our findings show significant
negative association between parity and number of
children aged five or below in the household and
BMI.
Findings reveal a strong significant association
between BMI and women’s level of education
and wealth quintile. The higher the level of edu-
cation and the wealth quintile, the lower was the
risk of being underweight. In contrast, the grades
of overweight increased significantly with increase
in women’s level of education and wealth quin-
tile. The increased risk of grades of overweight for
women in more flattering social position is partial-
ly attributed to the capability of boasting up more-
than-adequate food supplies and lesser physical
activities than women belonging to poor socioeco-
nomic status. The higher incidence of overweight
and obesity in higher socioeconomic groups may
be partly explained by the possible indifference to
body-shapes. These differences may contribute to
explaining the strong observed association between
high socioeconomic positions and overweight (2).
Moreover, these days people with increased income
are willing to pay for a larger number of high-calorie
beverages to respond to the elite marketing, which
substantially contribute to gain weight. Thus, in
spite of socioeconomic variability in population,
the increased consumption of high-calorie bever-
ages may explain some of the positive relationship
between wealth quintile and BMI (38). Consist-
ent with many studies (2,29-34), ours suggest that
women belonging to higher socioeconomic posi-
tion are at the elevated risk of being overweight,
and those with poor socioeconomic status are at
increased risk of underweight, further suggesting
the ‘dual burden’ of nutritional status of women in
Bangladesh. A similar result was found in an earlier
study in analyzing socioeconomic and geograph-
ic patterning of under- and overnutrition among
women in Bangladesh (39).
The unavailability of food is strongly associated
with underweight body-shape of women and not
significantly with overweight. Whereas obesity is
associated with privileged circumstances in low-
income countries (40), it is more often associated
with lower socioeconomic status in developed
countries (41). This observation suggests that, in a
more food-abundant environment, socioeconom-
ic factors, such as wealth, education, and income
level, may change the relationship between food
availability and overweight and/or obesity. In the
low- and middle-income countries, these relation-
ships are less consistent (40). Obesity may be asso-
ciated with wealth in some situations but with pov-
erty in others (42). Underweight and overweight
may, sometimes, co-exist in the same neighbour-
hoods (22), or even in the same households (43).
However, our findings are quite in a good agree-
ment with that of low-income countries (40).
The association between socioeconomic status
and BMI in low-income settings, like Bangladesh
suggests that rural people is likely to be subjected
to the changing patterns of food availability, food
composition, and consumption behaviour. Find-
ings reveal that rural women were less likely to be
overweight than those in urban areas. This finding
is similar to that of an Indian study (2). Moreover,
we marked significant regional variation of BMI
among women. The women living in Sylhet re-
gion were at increased risk of underweight relative
to normal weight. The previous BDHSs conducted
in 2004 and 2007 also reported higher prevalence
of underweight among women living in Sylhet
region. Further, the women from Chittagong,
Khulna, and Rajshahi were at increased risk of
overweight and/or obesity than were those from
Sylhet region. These findings underscore that
women living in the more urbanized regions may
be at higher risk of overweight and those living
in the typically agriculture-based region may be at
risk of being underweight. Although the region of
Dhaka is more exposed to urbaniation, the rapid
migration of rural people to Dhaka, the capital city
of Bangladesh, may have attenuated its effect on
being overweight or obese among women. This
finding is also consistent with an earlier study on
Bangladeshi women (39).
Strengths and limitations
The study has several strengths and limitations
Kamal SMM et al.Dual burden of underweight and overweight in Bangladeshi women
Volume 33 | Number 1 | March 2015 103
that urge explanations. The first limitation is that,
we used BMI as the only measure of overweight.
Although BMI is a reliable indicator of body fat-
ness and a low BMI is likely to be a valid proxy for
chronic energy deficiency, BMI does not distin-
guish between body fat and lean body mass. Waist-
circumference (26) and waist-to-hip ratios (44) con-
sequently have been suggested as better markers
of obesity. Recent studies have shown that South
Asians have the poorest correlation between waist-
circumference and BMI when comparing them
against the Europeans, Chinese, and Aboriginal
persons, although the correlation is still substantial
(25). However, BMI is a WHO-prescribed indicator
of nutritional status measurement that is interna-
tionally used. Second, the BMI cutoff points we
used in this study may understate health risk. It is
notable that, a growing body of literature, includ-
ing those on Indians (2,31,32), have used this BMI
cutoff points, which is recommended by WHO and
now globally recognized. Third, as a cross-sectional
study, the present analysis is limited to its ability to
elucidate causal relationships between risk factors
and overweight. BMI can overestimate body fat in
individuals who are very muscular and underesti-
mate body fat in individuals who have lost mus-
cle mass, such as many elderly (45). Despite these,
the strengths of the study include the large sample
consisting of both rural and urban populations,
representativeness of the national population, and
information on potential determinants of under-
weight and overweight.
Conclusions
Bangladesh is facing the dual burden of under-
weight and overweight. The findings suggest that
the nutritional status of women is related to indi-
vidual, socioeconomic and environmental level.
The nutritional status of individuals and societies,
at a given point in time, is likely to reflect the cu-
mulative synergy between physiologic endow-
ments and the social environment (2). It is likely
that the identification of sociodemographic and
environmental factors affecting nutritional status
of women is of great importance for developing
and targeting interventions to face the dual bur-
den of underweight and overweight as these epi-
demics may adversely impact the health of both
mother and child in the long run and thereby
the society as a whole. Regardless, systematic and
regular monitoring and surveillance of the social
trajectory of nutritional status of women and men
in Bangladesh is crucial to develop apposite strate-
gy that addresses the persistent and chronic prob-
lem of underweight and the emerging problem of
overweight. The dual existence of both types of
malnutrition among women in Bangladesh must
be taken into consideration so that public health
interventions may be adopted through appropri-
ate policy.
Conflict of interest: Authors declare no conflicts
of interest.
REFERENCES
1.	 Mendez MA, Monteiro CA, Popkin BM. Overweight
exceeds underweight among women in most devel-
oping countries. Am J Clin Nutr 2005;81:714-21.
2.	 Subramanian SV, Smith GD. Patterns, distribution,
and determinants of under- and overnutrition: a
population-based study of women in India. Am J Clin
Nutr 2006;84:633-40.
3.	 James WPT. The epidemiology of obesity: the size of
the problem. J Intern Med 2008;263:e336-e52. doi:
10.1111/j.1365-2796.2008.01922.x.
4.	 Cedergren MI. Maternal morbid obesity and the
risk of adverse pregnancy outcome. Obstet Gynecol
2004;103:219-24.
5.	 Heslehurst N, Simpson H, Ells LJ, Rankin J, Wilkinson
J, Lang R et al. The impact of maternal BMI status
on pregnancy outcomes with immediate short-term
obstetric resource implications: a meta-analysis. Obes
Rev 2008;9:635-83.
6.	 Oteng-Ntim E, Kopeika J, Seed P, Wandiembe S, Doy-
le P. Impact of obesity on pregnancy outcome in dif-
ferent ethnic groups: calculating population attribut-
able fractions. PLoS One 2013;8:e53749. doi: 10.1371/
journal.pone.0053749.
7.	 Torloni MR, Betrán AP, Horta BL, Nakamura MU, Atal-
lah AN, Moron AF et al. Prepregnancy BMI and the
risk of gestational diabetes: a systematic review of the
literature with meta-analysis. Obes Rev 2009;10:194-
203.
8.	 O’Brien TE, Ray JG, Chan WS. Maternal body mass
index and the risk of preeclampsia: a systematic over-
view. Epidemiology 2003;14:368-74.
9.	 Sahu MT, Agarwal A, Das V, Pandey A. Impact of ma-
ternal body mass index on obstetric outcome. J Obstet
Gynaecol Res 2007;33:655-9.
10.	Knight M; UKOSS. Antenatal pulmonary embo-
lism: risk factors, management and outcomes. BJOG
2008;115:453-61.
11.	Poobalan AS, Aucott LS, Gurung T, Smith WC, Bhat-
tacharya S. Obesity as an independent risk factor for
elective and emergency caesarean delivery in nullipa-
rous women—systematic review and meta-analysis
of cohort studies. Obes Rev 2009;10:28-35.
Kamal SMM et al.Dual burden of underweight and overweight in Bangladeshi women
JHPN104
12.	Ringbäck Weitoft G, Eliasson M, Rosén M. Under-
weight, overweight and obesity as risk factors for
mortality and hospitalization. Scand J Public Health
2008;36:169-76.
13.	FlegalKM,KitBK,OrpanaH,GraubardBI.Association
of all-cause mortality with overweight and obesity us-
ing standard body mass index categories: a systematic
review and meta-analysis. JAMA 2013;309:71-82.
14.	Tennant PWG, Rankin J, Bell R. Maternal body mass
index and the risk of fetal and infant death: a co-
hort study from the North of England. Hum Reprod
2011;26:1501-11.
15.	Cresswell JA, Campbell OM, De Silva MJ, Filippi V.
Effect of maternal obesity on neonatal death in sub-
Saharan Africa: multivariable analysis of 27 national
datasets. Lancet 2012;380:1325-30.
16.	Nagai M, Kuriyama S, Kakizaki M, Ohmori-Matsuda
K, Sone T, Hozawa A et al. Impact of obesity, over-
weight and underweight on life expectancy and life-
time medical expenditures: the Ohsaki cohort study.
BMJ Open 2012;2:e000940. doi:10.1136/bmjopen-
2012-000940.
17.	Kalk P, Guthmann F, Krause K, Relle K, Godes M,
Gossing G et al. Impact of maternal body mass index
on neonatal outcome. Eur J Med Res 2009;14:216-22.
18.	Taylor-Robinson D, Agarwal U, Diggle PJ, Platt MJ,
Yoxall B, Alfirevic Z. Quantifying the impact of dep-
rivation on preterm births: a retrospective cohort
study. PLoS One 2011;6:e23163. doi: 10.1371/journal.
pone.0023163.
19.	Mond J, Rodgers B, Hay P, Owen C. Mental health
impairment in underweight women: do body dissat-
isfaction and eating-disordered behavior play a role?
BMC Public Health 2011;11:547. doi: 10.1186/1471-
2458-11-547.
20.	Robinson MK, Mogensen KM, Casey JD, McKane
CK, Moromizato T, Rawn JD et al. The relationship
among obesity, nutritional status, and mortality in
the critically ill. Crit Care Med 2015;43:87-100.
21.	Popkin BM, Gordon-Larsen P. The nutrition transi-
tion: worldwide obesity dynamics and their deter-
minants. Int J Obes Relat Metab Disord 2004;28(Suppl
3):S2-9.
22.	Doak CM, Adair LS, Monteiro C, Popkin BM. Over-
weight and underweight coexist within households
in Brazil, China and Russia. J Nutr 2000;130:2965-71.
23.	National Institute of Population Research and Train-
ing. Bangladesh Demographic and Health Survey
2011: preliminary report. Dhaka: National Institute
of Population Research and Training, 2012. 46 p.
24.	WHO Expert Consultation. Appropriate body-
mass index for Asian populations and its implica-
tions for policy and intervention strategies. Lancet
2004;363:157-63.
25.	Razak F, Anand S, Vuksan V, Davis B, Jacobs R, Teo KK
et al. Ethnic differences in the relationships between
obesity and glucose-metabolic abnormalities: a cross
sectional population-based study. Int J Obes (Lond)
2005;29:656-67.
26.	Misra A, Vikram NK, Gupta R, Pandey RM, Wasir JS,
Gupta VP. Waist circumference cutoff points and ac-
tion levels for Asian Indians for identification of ab-
dominal obesity. Int J Obes (Lond) 2006;30:106-11.
27.	Chatterjee S, Hadi AS. Regression analysis by exam-
ple. 5th ed. New Jersey, NJ: John Wiley, 2006. 424 p.
28.	Long JS. Regression models for categorical and limit-
ed dependent variables. Thousand Oaks: Sage, 1997.
297 p. (Advanced quantitative techniques in the so-
cial sciences, V. 7).
29.	Shukla HC, Gupta PC, Mehta HC, Hebert JR. Descrip-
tive epidemiology of body mass index of an urban
adult population in western India. J Epidemiol Com-
munity Health 2002;56:876-80.
30.	Ramesh P, Jareena S. Overweight exceeds under-
weight among women in Kerala: an analysis of trends
and determinants. J Hum Ecol 2009;25:93-103.
31.	Subramanian SV, Kawachi I, Smith GD. Income in-
equality and the double burden of under- and over-
nutrition in India. J Epidemiol Community Health
2007;61:802-9.
32.	Subramanian SV, Perkins JM, Khan KT. Do burdens
of underweight and overweight coexist among low-
er socioeconomic groups in India? Am J Clin Nutr
2009;90:369-76.
33.	Janghorbani M, Amini M, Willett WC, Gouya MM,
Delavari A, Alkhani S et al. First nationwide survey of
prevalence of overweight, underweight, and abdomi-
nal obesity in Iranian adults. Obesity 2007;15:2797-
808.
34.	Ly KA, Ton TGN, Ngo QV, Vo TT, Fitzpatrick AL. Dou-
ble burden: a cross-sectional survey assessing factors
associated with underweight and overweight status
in Danang, Vietnam. BMC Public Health 2013;13:35.
doi: 10.1186/1471-2458-13-35.
35.	Berkel LA, Poston WSC, Reeves RS, Foreyt JP. Be-
havioral interventions for obesity. J Am Diet Assoc
2005;105:S35-S43.
36.	Mowafi M, Khadr Z, Subramanian SV, Bennette G,
Hill A, Kawachi I. Are neighborhood education levels
associated with BMI among adults in Cairo, Egypt?
Soc Sci Med 2011;72:1274-83.
37.	Koch E, Bogado M, Araya F, Romero T, Diaz T, Man-
riquez L et al. Impact of parity on anthropometric
measures of obesity controlling by multiple con-
Kamal SMM et al.Dual burden of underweight and overweight in Bangladeshi women
Volume 33 | Number 1 | March 2015 105
founders: a cross sectional study in Chilean women. J
Epidemiol Community Health 2008;62:461-70.
38.	Fernald L. Socio-economic status and body mass
index in low-income Mexican adults. Soc Sci Med
2007;64:2030-42.
39.	Corsi DJ, Kyu HH, Subramanian SV. Socioeco-
nomic and geographic patterning of under- and
overnutrition among women in Bangladesh. J Nutr
2011;141:631-8.
40.	Gulliford MC, Mahabir D, Rocke B. Food insecurity,
food choices, and body mass index in adults: nutri-
tion transition in Trinidad and Tobago. Int J Epidemiol
2003;32:508-16.
41.	Adams EJ, Grummer-Strawn L, Chavez G. Food inse-
curity is associated with increased risk of obesity in
California women. J Nutr 2003;133:1070-4.
42.	Monteiro CA, Conde WL, Popkin BM. Independ-
ent effects of income and education on the risk of
obesity in the Brazilian adult population. J Nutr
2001;131:S881-6.
43.	Florêncio TM, Ferreira HS, de França AP, Cavalcante
JC, Sawaya AL. Obesity and undernutrition in a very-
low-income population in the city of Maceió, north-
eastern Brazil. Br J Nutr 2001;86:277-84.
44.	Yusuf S, Hawken S, Ounpuu S, Bautista L, Franzosi
MG, Commerford P et al.; INTERHEART Study Inves-
tigators. Obesity and the risk of myocardial infarction
in 27,000 participants from 52 countries: a case-con-
trol study. Lancet 2005;366:1640-49.
45.	Paeratakul S, Lovejoy JC, Ryan DH, Bray GA. The re-
lation of gender, race, and socioeconomic status to
obesity and obesity comorbidities in a sample of US
adults. Int J Obes Relat Metab Disord 2002;26:1205-10.

More Related Content

What's hot

National Nutritional Survey 2011
National Nutritional Survey 2011National Nutritional Survey 2011
National Nutritional Survey 2011DrSindhuAlmas
 
Agri-food systems, diets and nutrition: micro-level evidences with a gender p...
Agri-food systems, diets and nutrition: micro-level evidences with a gender p...Agri-food systems, diets and nutrition: micro-level evidences with a gender p...
Agri-food systems, diets and nutrition: micro-level evidences with a gender p...ICRISAT
 
1 s2.0-s1877593410000706-main
1 s2.0-s1877593410000706-main1 s2.0-s1877593410000706-main
1 s2.0-s1877593410000706-mainSatria Kino
 
They Point to More Effective Weight Loss Strategies!
They Point to More Effective Weight Loss Strategies!They Point to More Effective Weight Loss Strategies!
They Point to More Effective Weight Loss Strategies!RENGAN SRINIVASAN
 
Ecological factors in nutrient assessment
Ecological factors in nutrient assessmentEcological factors in nutrient assessment
Ecological factors in nutrient assessmentabhi2095
 
Japan and the "Metabo Law"
Japan and the "Metabo Law"Japan and the "Metabo Law"
Japan and the "Metabo Law"markppt
 
Marissa Menendez Major Project Paper 1-30-15
Marissa Menendez Major Project Paper 1-30-15Marissa Menendez Major Project Paper 1-30-15
Marissa Menendez Major Project Paper 1-30-15Marissa Menendez
 
Prevalence of overweight,obesity and abdominal obesity among adolescent
Prevalence of overweight,obesity and abdominal obesity among adolescentPrevalence of overweight,obesity and abdominal obesity among adolescent
Prevalence of overweight,obesity and abdominal obesity among adolescentTareq Hassan
 
Gynecological and Nutritional Risk Factors for Female Infertility
Gynecological and Nutritional Risk Factors for Female InfertilityGynecological and Nutritional Risk Factors for Female Infertility
Gynecological and Nutritional Risk Factors for Female Infertilityijtsrd
 
Research proposal for obesity prevalence in housewives
Research proposal for obesity prevalence in housewives Research proposal for obesity prevalence in housewives
Research proposal for obesity prevalence in housewives MahwishAurangzeb
 
Proposal defence ugrp
Proposal defence ugrpProposal defence ugrp
Proposal defence ugrpAmal Hayati
 
Education, Policy and Environmental Change, and Evaluation
Education, Policy and Environmental Change, and EvaluationEducation, Policy and Environmental Change, and Evaluation
Education, Policy and Environmental Change, and Evaluationkathleenmarycullinen
 

What's hot (20)

National Nutritional Survey 2011
National Nutritional Survey 2011National Nutritional Survey 2011
National Nutritional Survey 2011
 
Agri-food systems, diets and nutrition: micro-level evidences with a gender p...
Agri-food systems, diets and nutrition: micro-level evidences with a gender p...Agri-food systems, diets and nutrition: micro-level evidences with a gender p...
Agri-food systems, diets and nutrition: micro-level evidences with a gender p...
 
Obesity epid624
Obesity epid624Obesity epid624
Obesity epid624
 
Nutritional assessment
Nutritional assessmentNutritional assessment
Nutritional assessment
 
Niutrtion
NiutrtionNiutrtion
Niutrtion
 
1 s2.0-s1877593410000706-main
1 s2.0-s1877593410000706-main1 s2.0-s1877593410000706-main
1 s2.0-s1877593410000706-main
 
Weight loss 15
Weight loss 15Weight loss 15
Weight loss 15
 
Obesity
ObesityObesity
Obesity
 
They Point to More Effective Weight Loss Strategies!
They Point to More Effective Weight Loss Strategies!They Point to More Effective Weight Loss Strategies!
They Point to More Effective Weight Loss Strategies!
 
Ecological factors in nutrient assessment
Ecological factors in nutrient assessmentEcological factors in nutrient assessment
Ecological factors in nutrient assessment
 
Japan and the "Metabo Law"
Japan and the "Metabo Law"Japan and the "Metabo Law"
Japan and the "Metabo Law"
 
Marissa Menendez Major Project Paper 1-30-15
Marissa Menendez Major Project Paper 1-30-15Marissa Menendez Major Project Paper 1-30-15
Marissa Menendez Major Project Paper 1-30-15
 
Prevalence of overweight,obesity and abdominal obesity among adolescent
Prevalence of overweight,obesity and abdominal obesity among adolescentPrevalence of overweight,obesity and abdominal obesity among adolescent
Prevalence of overweight,obesity and abdominal obesity among adolescent
 
Gynecological and Nutritional Risk Factors for Female Infertility
Gynecological and Nutritional Risk Factors for Female InfertilityGynecological and Nutritional Risk Factors for Female Infertility
Gynecological and Nutritional Risk Factors for Female Infertility
 
Research proposal for obesity prevalence in housewives
Research proposal for obesity prevalence in housewives Research proposal for obesity prevalence in housewives
Research proposal for obesity prevalence in housewives
 
Paper proj
Paper projPaper proj
Paper proj
 
Proposal defence ugrp
Proposal defence ugrpProposal defence ugrp
Proposal defence ugrp
 
Education, Policy and Environmental Change, and Evaluation
Education, Policy and Environmental Change, and EvaluationEducation, Policy and Environmental Change, and Evaluation
Education, Policy and Environmental Change, and Evaluation
 
Hospital Based Prevalence of Malnutrition in Pediatrics
Hospital Based Prevalence of Malnutrition in PediatricsHospital Based Prevalence of Malnutrition in Pediatrics
Hospital Based Prevalence of Malnutrition in Pediatrics
 
Putting the Health in Healthcare: Partnerships with Hospitals
Putting the Health in Healthcare: Partnerships with HospitalsPutting the Health in Healthcare: Partnerships with Hospitals
Putting the Health in Healthcare: Partnerships with Hospitals
 

Similar to Dual burden of underweight and overweight among women in bangladesh patterns, prevalence, and sociodemographic correlates

body fat percentage, BMI and skin fold thickness_21838-79565-1-PB
body fat percentage, BMI and skin fold thickness_21838-79565-1-PBbody fat percentage, BMI and skin fold thickness_21838-79565-1-PB
body fat percentage, BMI and skin fold thickness_21838-79565-1-PBThant Zin
 
SCOPE AND DELIMITATION OF THE STUDY.docx
SCOPE AND DELIMITATION OF THE STUDY.docxSCOPE AND DELIMITATION OF THE STUDY.docx
SCOPE AND DELIMITATION OF THE STUDY.docxMarebelManabat
 
Anaemia and low birth weight
Anaemia and low birth weightAnaemia and low birth weight
Anaemia and low birth weightdwi handayani
 
Prevalence of anemia and socio-demographic factors associated with anemia amo...
Prevalence of anemia and socio-demographic factors associated with anemia amo...Prevalence of anemia and socio-demographic factors associated with anemia amo...
Prevalence of anemia and socio-demographic factors associated with anemia amo...IOSR Journals
 
2005 06-13 overweight-childrenadolescents
2005 06-13 overweight-childrenadolescents2005 06-13 overweight-childrenadolescents
2005 06-13 overweight-childrenadolescentsPediatriasur
 
Factors Associated with Anemia among Pregnant Women of Underprivileged Ethnic...
Factors Associated with Anemia among Pregnant Women of Underprivileged Ethnic...Factors Associated with Anemia among Pregnant Women of Underprivileged Ethnic...
Factors Associated with Anemia among Pregnant Women of Underprivileged Ethnic...Prabesh Ghimire
 
Prevalence of anemia in adolescent girls and its co relation with demographic...
Prevalence of anemia in adolescent girls and its co relation with demographic...Prevalence of anemia in adolescent girls and its co relation with demographic...
Prevalence of anemia in adolescent girls and its co relation with demographic...Younis I Munshi
 
Sam journal article review
Sam journal article reviewSam journal article review
Sam journal article reviewBeatriz Breva
 
Prevalence and determinant factors of overweight and obesity among preschool ...
Prevalence and determinant factors of overweight and obesity among preschool ...Prevalence and determinant factors of overweight and obesity among preschool ...
Prevalence and determinant factors of overweight and obesity among preschool ...Alexander Decker
 
RELATIONSHIP BETWEEN MATERNAL OBESITY AND PRENATAL, METABOLIC SYNDROME, OBSTE...
RELATIONSHIP BETWEEN MATERNAL OBESITY AND PRENATAL, METABOLIC SYNDROME, OBSTE...RELATIONSHIP BETWEEN MATERNAL OBESITY AND PRENATAL, METABOLIC SYNDROME, OBSTE...
RELATIONSHIP BETWEEN MATERNAL OBESITY AND PRENATAL, METABOLIC SYNDROME, OBSTE...dr. Bobby Ahmad
 
Comparing BMI and hand grip strength of Tsinghua University Beijing and Unive...
Comparing BMI and hand grip strength of Tsinghua University Beijing and Unive...Comparing BMI and hand grip strength of Tsinghua University Beijing and Unive...
Comparing BMI and hand grip strength of Tsinghua University Beijing and Unive...IOSR Journals
 
A Literature Review Of Role Of Obesity In Adult Health With Reference To Africa
A Literature Review Of Role Of Obesity In Adult Health With Reference To AfricaA Literature Review Of Role Of Obesity In Adult Health With Reference To Africa
A Literature Review Of Role Of Obesity In Adult Health With Reference To AfricaCarrie Tran
 
Trends in Body Mass Index and Prevalence of Extreme HighObes.docx
Trends in Body Mass Index and Prevalence of Extreme HighObes.docxTrends in Body Mass Index and Prevalence of Extreme HighObes.docx
Trends in Body Mass Index and Prevalence of Extreme HighObes.docxwillcoxjanay
 
nejm obesidad en adolescente. 2102062.pdf
nejm obesidad en adolescente. 2102062.pdfnejm obesidad en adolescente. 2102062.pdf
nejm obesidad en adolescente. 2102062.pdfmedineumo
 
3.+22023+Uzma+Zafar+-+Medical+&+Dental+(Kode+OJS+41823)+14+-+24.pdf
3.+22023+Uzma+Zafar+-+Medical+&+Dental+(Kode+OJS+41823)+14+-+24.pdf3.+22023+Uzma+Zafar+-+Medical+&+Dental+(Kode+OJS+41823)+14+-+24.pdf
3.+22023+Uzma+Zafar+-+Medical+&+Dental+(Kode+OJS+41823)+14+-+24.pdfsirajkhattak9000
 

Similar to Dual burden of underweight and overweight among women in bangladesh patterns, prevalence, and sociodemographic correlates (20)

body fat percentage, BMI and skin fold thickness_21838-79565-1-PB
body fat percentage, BMI and skin fold thickness_21838-79565-1-PBbody fat percentage, BMI and skin fold thickness_21838-79565-1-PB
body fat percentage, BMI and skin fold thickness_21838-79565-1-PB
 
SCOPE AND DELIMITATION OF THE STUDY.docx
SCOPE AND DELIMITATION OF THE STUDY.docxSCOPE AND DELIMITATION OF THE STUDY.docx
SCOPE AND DELIMITATION OF THE STUDY.docx
 
Anaemia and low birth weight
Anaemia and low birth weightAnaemia and low birth weight
Anaemia and low birth weight
 
Prevalence of anemia and socio-demographic factors associated with anemia amo...
Prevalence of anemia and socio-demographic factors associated with anemia amo...Prevalence of anemia and socio-demographic factors associated with anemia amo...
Prevalence of anemia and socio-demographic factors associated with anemia amo...
 
WHO_.pdf
WHO_.pdfWHO_.pdf
WHO_.pdf
 
Review article by me
Review article by meReview article by me
Review article by me
 
G0413030038
G0413030038G0413030038
G0413030038
 
2005 06-13 overweight-childrenadolescents
2005 06-13 overweight-childrenadolescents2005 06-13 overweight-childrenadolescents
2005 06-13 overweight-childrenadolescents
 
Anthropometric worldbank
Anthropometric worldbankAnthropometric worldbank
Anthropometric worldbank
 
Factors Associated with Anemia among Pregnant Women of Underprivileged Ethnic...
Factors Associated with Anemia among Pregnant Women of Underprivileged Ethnic...Factors Associated with Anemia among Pregnant Women of Underprivileged Ethnic...
Factors Associated with Anemia among Pregnant Women of Underprivileged Ethnic...
 
Prevalence of anemia in adolescent girls and its co relation with demographic...
Prevalence of anemia in adolescent girls and its co relation with demographic...Prevalence of anemia in adolescent girls and its co relation with demographic...
Prevalence of anemia in adolescent girls and its co relation with demographic...
 
Sam journal article review
Sam journal article reviewSam journal article review
Sam journal article review
 
Prevalence and determinant factors of overweight and obesity among preschool ...
Prevalence and determinant factors of overweight and obesity among preschool ...Prevalence and determinant factors of overweight and obesity among preschool ...
Prevalence and determinant factors of overweight and obesity among preschool ...
 
RELATIONSHIP BETWEEN MATERNAL OBESITY AND PRENATAL, METABOLIC SYNDROME, OBSTE...
RELATIONSHIP BETWEEN MATERNAL OBESITY AND PRENATAL, METABOLIC SYNDROME, OBSTE...RELATIONSHIP BETWEEN MATERNAL OBESITY AND PRENATAL, METABOLIC SYNDROME, OBSTE...
RELATIONSHIP BETWEEN MATERNAL OBESITY AND PRENATAL, METABOLIC SYNDROME, OBSTE...
 
Comparing BMI and hand grip strength of Tsinghua University Beijing and Unive...
Comparing BMI and hand grip strength of Tsinghua University Beijing and Unive...Comparing BMI and hand grip strength of Tsinghua University Beijing and Unive...
Comparing BMI and hand grip strength of Tsinghua University Beijing and Unive...
 
A Literature Review Of Role Of Obesity In Adult Health With Reference To Africa
A Literature Review Of Role Of Obesity In Adult Health With Reference To AfricaA Literature Review Of Role Of Obesity In Adult Health With Reference To Africa
A Literature Review Of Role Of Obesity In Adult Health With Reference To Africa
 
Trends in Body Mass Index and Prevalence of Extreme HighObes.docx
Trends in Body Mass Index and Prevalence of Extreme HighObes.docxTrends in Body Mass Index and Prevalence of Extreme HighObes.docx
Trends in Body Mass Index and Prevalence of Extreme HighObes.docx
 
nejm obesidad en adolescente. 2102062.pdf
nejm obesidad en adolescente. 2102062.pdfnejm obesidad en adolescente. 2102062.pdf
nejm obesidad en adolescente. 2102062.pdf
 
Effect of Anemia on Pregnancy outcome: A Case-control study
Effect of Anemia on Pregnancy outcome: A Case-control studyEffect of Anemia on Pregnancy outcome: A Case-control study
Effect of Anemia on Pregnancy outcome: A Case-control study
 
3.+22023+Uzma+Zafar+-+Medical+&+Dental+(Kode+OJS+41823)+14+-+24.pdf
3.+22023+Uzma+Zafar+-+Medical+&+Dental+(Kode+OJS+41823)+14+-+24.pdf3.+22023+Uzma+Zafar+-+Medical+&+Dental+(Kode+OJS+41823)+14+-+24.pdf
3.+22023+Uzma+Zafar+-+Medical+&+Dental+(Kode+OJS+41823)+14+-+24.pdf
 

Recently uploaded

Premium Call Girls In Jaipur {8445551418} ❤️VVIP SEEMA Call Girl in Jaipur Ra...
Premium Call Girls In Jaipur {8445551418} ❤️VVIP SEEMA Call Girl in Jaipur Ra...Premium Call Girls In Jaipur {8445551418} ❤️VVIP SEEMA Call Girl in Jaipur Ra...
Premium Call Girls In Jaipur {8445551418} ❤️VVIP SEEMA Call Girl in Jaipur Ra...parulsinha
 
Call Girls Raipur Just Call 9630942363 Top Class Call Girl Service Available
Call Girls Raipur Just Call 9630942363 Top Class Call Girl Service AvailableCall Girls Raipur Just Call 9630942363 Top Class Call Girl Service Available
Call Girls Raipur Just Call 9630942363 Top Class Call Girl Service AvailableGENUINE ESCORT AGENCY
 
All Time Service Available Call Girls Marine Drive 📳 9820252231 For 18+ VIP C...
All Time Service Available Call Girls Marine Drive 📳 9820252231 For 18+ VIP C...All Time Service Available Call Girls Marine Drive 📳 9820252231 For 18+ VIP C...
All Time Service Available Call Girls Marine Drive 📳 9820252231 For 18+ VIP C...Arohi Goyal
 
Call Girls Kurnool Just Call 8250077686 Top Class Call Girl Service Available
Call Girls Kurnool Just Call 8250077686 Top Class Call Girl Service AvailableCall Girls Kurnool Just Call 8250077686 Top Class Call Girl Service Available
Call Girls Kurnool Just Call 8250077686 Top Class Call Girl Service AvailableDipal Arora
 
Call Girls Service Jaipur {8445551418} ❤️VVIP BHAWNA Call Girl in Jaipur Raja...
Call Girls Service Jaipur {8445551418} ❤️VVIP BHAWNA Call Girl in Jaipur Raja...Call Girls Service Jaipur {8445551418} ❤️VVIP BHAWNA Call Girl in Jaipur Raja...
Call Girls Service Jaipur {8445551418} ❤️VVIP BHAWNA Call Girl in Jaipur Raja...parulsinha
 
Independent Call Girls In Jaipur { 8445551418 } ✔ ANIKA MEHTA ✔ Get High Prof...
Independent Call Girls In Jaipur { 8445551418 } ✔ ANIKA MEHTA ✔ Get High Prof...Independent Call Girls In Jaipur { 8445551418 } ✔ ANIKA MEHTA ✔ Get High Prof...
Independent Call Girls In Jaipur { 8445551418 } ✔ ANIKA MEHTA ✔ Get High Prof...parulsinha
 
Top Rated Hyderabad Call Girls Erragadda ⟟ 9332606886 ⟟ Call Me For Genuine ...
Top Rated  Hyderabad Call Girls Erragadda ⟟ 9332606886 ⟟ Call Me For Genuine ...Top Rated  Hyderabad Call Girls Erragadda ⟟ 9332606886 ⟟ Call Me For Genuine ...
Top Rated Hyderabad Call Girls Erragadda ⟟ 9332606886 ⟟ Call Me For Genuine ...chandars293
 
Call Girls Visakhapatnam Just Call 8250077686 Top Class Call Girl Service Ava...
Call Girls Visakhapatnam Just Call 8250077686 Top Class Call Girl Service Ava...Call Girls Visakhapatnam Just Call 8250077686 Top Class Call Girl Service Ava...
Call Girls Visakhapatnam Just Call 8250077686 Top Class Call Girl Service Ava...Dipal Arora
 
Top Quality Call Girl Service Kalyanpur 6378878445 Available Call Girls Any Time
Top Quality Call Girl Service Kalyanpur 6378878445 Available Call Girls Any TimeTop Quality Call Girl Service Kalyanpur 6378878445 Available Call Girls Any Time
Top Quality Call Girl Service Kalyanpur 6378878445 Available Call Girls Any TimeCall Girls Delhi
 
Top Rated Bangalore Call Girls Majestic ⟟ 9332606886 ⟟ Call Me For Genuine S...
Top Rated Bangalore Call Girls Majestic ⟟  9332606886 ⟟ Call Me For Genuine S...Top Rated Bangalore Call Girls Majestic ⟟  9332606886 ⟟ Call Me For Genuine S...
Top Rated Bangalore Call Girls Majestic ⟟ 9332606886 ⟟ Call Me For Genuine S...narwatsonia7
 
Call Girls Guntur Just Call 8250077686 Top Class Call Girl Service Available
Call Girls Guntur  Just Call 8250077686 Top Class Call Girl Service AvailableCall Girls Guntur  Just Call 8250077686 Top Class Call Girl Service Available
Call Girls Guntur Just Call 8250077686 Top Class Call Girl Service AvailableDipal Arora
 
8980367676 Call Girls In Ahmedabad Escort Service Available 24×7 In Ahmedabad
8980367676 Call Girls In Ahmedabad Escort Service Available 24×7 In Ahmedabad8980367676 Call Girls In Ahmedabad Escort Service Available 24×7 In Ahmedabad
8980367676 Call Girls In Ahmedabad Escort Service Available 24×7 In AhmedabadGENUINE ESCORT AGENCY
 
Top Rated Hyderabad Call Girls Chintal ⟟ 9332606886 ⟟ Call Me For Genuine Se...
Top Rated  Hyderabad Call Girls Chintal ⟟ 9332606886 ⟟ Call Me For Genuine Se...Top Rated  Hyderabad Call Girls Chintal ⟟ 9332606886 ⟟ Call Me For Genuine Se...
Top Rated Hyderabad Call Girls Chintal ⟟ 9332606886 ⟟ Call Me For Genuine Se...chandars293
 
Call Girls Service Jaipur {9521753030} ❤️VVIP RIDDHI Call Girl in Jaipur Raja...
Call Girls Service Jaipur {9521753030} ❤️VVIP RIDDHI Call Girl in Jaipur Raja...Call Girls Service Jaipur {9521753030} ❤️VVIP RIDDHI Call Girl in Jaipur Raja...
Call Girls Service Jaipur {9521753030} ❤️VVIP RIDDHI Call Girl in Jaipur Raja...Sheetaleventcompany
 
Call Girls Rishikesh Just Call 8250077686 Top Class Call Girl Service Available
Call Girls Rishikesh Just Call 8250077686 Top Class Call Girl Service AvailableCall Girls Rishikesh Just Call 8250077686 Top Class Call Girl Service Available
Call Girls Rishikesh Just Call 8250077686 Top Class Call Girl Service AvailableDipal Arora
 
💕SONAM KUMAR💕Premium Call Girls Jaipur ↘️9257276172 ↙️One Night Stand With Lo...
💕SONAM KUMAR💕Premium Call Girls Jaipur ↘️9257276172 ↙️One Night Stand With Lo...💕SONAM KUMAR💕Premium Call Girls Jaipur ↘️9257276172 ↙️One Night Stand With Lo...
💕SONAM KUMAR💕Premium Call Girls Jaipur ↘️9257276172 ↙️One Night Stand With Lo...khalifaescort01
 
Call Girl in Indore 8827247818 {LowPrice} ❤️ (ahana) Indore Call Girls * UPA...
Call Girl in Indore 8827247818 {LowPrice} ❤️ (ahana) Indore Call Girls  * UPA...Call Girl in Indore 8827247818 {LowPrice} ❤️ (ahana) Indore Call Girls  * UPA...
Call Girl in Indore 8827247818 {LowPrice} ❤️ (ahana) Indore Call Girls * UPA...mahaiklolahd
 
Call Girls Vadodara Just Call 8617370543 Top Class Call Girl Service Available
Call Girls Vadodara Just Call 8617370543 Top Class Call Girl Service AvailableCall Girls Vadodara Just Call 8617370543 Top Class Call Girl Service Available
Call Girls Vadodara Just Call 8617370543 Top Class Call Girl Service AvailableDipal Arora
 
Best Rate (Patna ) Call Girls Patna ⟟ 8617370543 ⟟ High Class Call Girl In 5 ...
Best Rate (Patna ) Call Girls Patna ⟟ 8617370543 ⟟ High Class Call Girl In 5 ...Best Rate (Patna ) Call Girls Patna ⟟ 8617370543 ⟟ High Class Call Girl In 5 ...
Best Rate (Patna ) Call Girls Patna ⟟ 8617370543 ⟟ High Class Call Girl In 5 ...Dipal Arora
 

Recently uploaded (20)

Premium Call Girls In Jaipur {8445551418} ❤️VVIP SEEMA Call Girl in Jaipur Ra...
Premium Call Girls In Jaipur {8445551418} ❤️VVIP SEEMA Call Girl in Jaipur Ra...Premium Call Girls In Jaipur {8445551418} ❤️VVIP SEEMA Call Girl in Jaipur Ra...
Premium Call Girls In Jaipur {8445551418} ❤️VVIP SEEMA Call Girl in Jaipur Ra...
 
Call Girls Raipur Just Call 9630942363 Top Class Call Girl Service Available
Call Girls Raipur Just Call 9630942363 Top Class Call Girl Service AvailableCall Girls Raipur Just Call 9630942363 Top Class Call Girl Service Available
Call Girls Raipur Just Call 9630942363 Top Class Call Girl Service Available
 
All Time Service Available Call Girls Marine Drive 📳 9820252231 For 18+ VIP C...
All Time Service Available Call Girls Marine Drive 📳 9820252231 For 18+ VIP C...All Time Service Available Call Girls Marine Drive 📳 9820252231 For 18+ VIP C...
All Time Service Available Call Girls Marine Drive 📳 9820252231 For 18+ VIP C...
 
Call Girls Kurnool Just Call 8250077686 Top Class Call Girl Service Available
Call Girls Kurnool Just Call 8250077686 Top Class Call Girl Service AvailableCall Girls Kurnool Just Call 8250077686 Top Class Call Girl Service Available
Call Girls Kurnool Just Call 8250077686 Top Class Call Girl Service Available
 
Call Girls Service Jaipur {8445551418} ❤️VVIP BHAWNA Call Girl in Jaipur Raja...
Call Girls Service Jaipur {8445551418} ❤️VVIP BHAWNA Call Girl in Jaipur Raja...Call Girls Service Jaipur {8445551418} ❤️VVIP BHAWNA Call Girl in Jaipur Raja...
Call Girls Service Jaipur {8445551418} ❤️VVIP BHAWNA Call Girl in Jaipur Raja...
 
Independent Call Girls In Jaipur { 8445551418 } ✔ ANIKA MEHTA ✔ Get High Prof...
Independent Call Girls In Jaipur { 8445551418 } ✔ ANIKA MEHTA ✔ Get High Prof...Independent Call Girls In Jaipur { 8445551418 } ✔ ANIKA MEHTA ✔ Get High Prof...
Independent Call Girls In Jaipur { 8445551418 } ✔ ANIKA MEHTA ✔ Get High Prof...
 
Top Rated Hyderabad Call Girls Erragadda ⟟ 9332606886 ⟟ Call Me For Genuine ...
Top Rated  Hyderabad Call Girls Erragadda ⟟ 9332606886 ⟟ Call Me For Genuine ...Top Rated  Hyderabad Call Girls Erragadda ⟟ 9332606886 ⟟ Call Me For Genuine ...
Top Rated Hyderabad Call Girls Erragadda ⟟ 9332606886 ⟟ Call Me For Genuine ...
 
Call Girls Visakhapatnam Just Call 8250077686 Top Class Call Girl Service Ava...
Call Girls Visakhapatnam Just Call 8250077686 Top Class Call Girl Service Ava...Call Girls Visakhapatnam Just Call 8250077686 Top Class Call Girl Service Ava...
Call Girls Visakhapatnam Just Call 8250077686 Top Class Call Girl Service Ava...
 
Top Quality Call Girl Service Kalyanpur 6378878445 Available Call Girls Any Time
Top Quality Call Girl Service Kalyanpur 6378878445 Available Call Girls Any TimeTop Quality Call Girl Service Kalyanpur 6378878445 Available Call Girls Any Time
Top Quality Call Girl Service Kalyanpur 6378878445 Available Call Girls Any Time
 
Call Girls in Gagan Vihar (delhi) call me [🔝 9953056974 🔝] escort service 24X7
Call Girls in Gagan Vihar (delhi) call me [🔝  9953056974 🔝] escort service 24X7Call Girls in Gagan Vihar (delhi) call me [🔝  9953056974 🔝] escort service 24X7
Call Girls in Gagan Vihar (delhi) call me [🔝 9953056974 🔝] escort service 24X7
 
Top Rated Bangalore Call Girls Majestic ⟟ 9332606886 ⟟ Call Me For Genuine S...
Top Rated Bangalore Call Girls Majestic ⟟  9332606886 ⟟ Call Me For Genuine S...Top Rated Bangalore Call Girls Majestic ⟟  9332606886 ⟟ Call Me For Genuine S...
Top Rated Bangalore Call Girls Majestic ⟟ 9332606886 ⟟ Call Me For Genuine S...
 
Call Girls Guntur Just Call 8250077686 Top Class Call Girl Service Available
Call Girls Guntur  Just Call 8250077686 Top Class Call Girl Service AvailableCall Girls Guntur  Just Call 8250077686 Top Class Call Girl Service Available
Call Girls Guntur Just Call 8250077686 Top Class Call Girl Service Available
 
8980367676 Call Girls In Ahmedabad Escort Service Available 24×7 In Ahmedabad
8980367676 Call Girls In Ahmedabad Escort Service Available 24×7 In Ahmedabad8980367676 Call Girls In Ahmedabad Escort Service Available 24×7 In Ahmedabad
8980367676 Call Girls In Ahmedabad Escort Service Available 24×7 In Ahmedabad
 
Top Rated Hyderabad Call Girls Chintal ⟟ 9332606886 ⟟ Call Me For Genuine Se...
Top Rated  Hyderabad Call Girls Chintal ⟟ 9332606886 ⟟ Call Me For Genuine Se...Top Rated  Hyderabad Call Girls Chintal ⟟ 9332606886 ⟟ Call Me For Genuine Se...
Top Rated Hyderabad Call Girls Chintal ⟟ 9332606886 ⟟ Call Me For Genuine Se...
 
Call Girls Service Jaipur {9521753030} ❤️VVIP RIDDHI Call Girl in Jaipur Raja...
Call Girls Service Jaipur {9521753030} ❤️VVIP RIDDHI Call Girl in Jaipur Raja...Call Girls Service Jaipur {9521753030} ❤️VVIP RIDDHI Call Girl in Jaipur Raja...
Call Girls Service Jaipur {9521753030} ❤️VVIP RIDDHI Call Girl in Jaipur Raja...
 
Call Girls Rishikesh Just Call 8250077686 Top Class Call Girl Service Available
Call Girls Rishikesh Just Call 8250077686 Top Class Call Girl Service AvailableCall Girls Rishikesh Just Call 8250077686 Top Class Call Girl Service Available
Call Girls Rishikesh Just Call 8250077686 Top Class Call Girl Service Available
 
💕SONAM KUMAR💕Premium Call Girls Jaipur ↘️9257276172 ↙️One Night Stand With Lo...
💕SONAM KUMAR💕Premium Call Girls Jaipur ↘️9257276172 ↙️One Night Stand With Lo...💕SONAM KUMAR💕Premium Call Girls Jaipur ↘️9257276172 ↙️One Night Stand With Lo...
💕SONAM KUMAR💕Premium Call Girls Jaipur ↘️9257276172 ↙️One Night Stand With Lo...
 
Call Girl in Indore 8827247818 {LowPrice} ❤️ (ahana) Indore Call Girls * UPA...
Call Girl in Indore 8827247818 {LowPrice} ❤️ (ahana) Indore Call Girls  * UPA...Call Girl in Indore 8827247818 {LowPrice} ❤️ (ahana) Indore Call Girls  * UPA...
Call Girl in Indore 8827247818 {LowPrice} ❤️ (ahana) Indore Call Girls * UPA...
 
Call Girls Vadodara Just Call 8617370543 Top Class Call Girl Service Available
Call Girls Vadodara Just Call 8617370543 Top Class Call Girl Service AvailableCall Girls Vadodara Just Call 8617370543 Top Class Call Girl Service Available
Call Girls Vadodara Just Call 8617370543 Top Class Call Girl Service Available
 
Best Rate (Patna ) Call Girls Patna ⟟ 8617370543 ⟟ High Class Call Girl In 5 ...
Best Rate (Patna ) Call Girls Patna ⟟ 8617370543 ⟟ High Class Call Girl In 5 ...Best Rate (Patna ) Call Girls Patna ⟟ 8617370543 ⟟ High Class Call Girl In 5 ...
Best Rate (Patna ) Call Girls Patna ⟟ 8617370543 ⟟ High Class Call Girl In 5 ...
 

Dual burden of underweight and overweight among women in bangladesh patterns, prevalence, and sociodemographic correlates

  • 1. ©INTERNATIONAL CENTRE FOR DIARRHOEAL DISEASE RESEARCH, BANGLADESH J HEALTH POPUL NUTR 2015 Mar;33(1):92-105 ISSN 1606-0997 | $ 5.00+0.20 Correspondence and reprint requests: Dr. S.M. Mostafa Kamal Visiting Research Fellow Unit for the Enhancement of Academic Performance University of Malaya 50603 Kuala Lumpur, Malaysia and Professor Department of Mathematics Islamic University Kushtia 7003 Bangladesh Email: kamaliubd@yahoo.com Fax: +6-03-2246-3348 INTRODUCTION Due to economic situation of developed countries, health concern mainly on overweight receives graver attention. The ‘dual burden’ of health con- cern caused through both underweight and over- weight is significantly important for public health policy in developing nations to address (1-3). Stud- ies confirm that these days the problem of over- weight in developing nations is gradually taking the driving seat superseding the concerns of under- weight due to changes of food habit and lifestyle and working culture (1). There is evidence that this Dual Burden of Underweight and Overweight among Women in Bangladesh: Patterns, Prevalence, and Sociodemographic Correlates S.M. Mostafa Kamal1 , Che Hashim Hassan2 , Gazi Mahabubul Alam2 1 Department of Mathematics, Islamic University, Kushtia 7003, Bangladesh and Visiting Research Fellow, Unit for the Enhancement of Academic Performance, University of Malaya, 50603 Kuala Lumpur, Malaysia; 2 Unit for the Enhancement of Academic Performance, University of Malaya, 50603 Kuala Lumpur, Malaysia ABSTRACT The discourse of dual burden caused through underweight and overweight is well-documented globally but this issue and its connection with women’s health in Bangladesh is yet to be explored widely. To enrich the current debate, this study, in the context of Bangladesh, examines the patterns, prevalence, and socioeconomic factors influencing the ever-married women of being underweight and overweight over normal weight. Data used in this study have been extracted from the most recent 2011 Bangladesh Demographic and Health Sur- vey. To achieve results connected with the research objectives, both bivariate and multivariate statistical analy- ses have been employed. In bivariate analysis, we used seven categories of BMI cutoff points for Asian countries as prescribed by World Health Organization (WHO). Multinomial logistic regression model was constructed to investigate the net effect of socioeconomic factors on underweight, pre-overweight, and overweight over nor- mal weight. The results confirm the co-existence of underweight and overweight among women as we found the prevalence of underweight, normal weight, pre-overweight, overweight, and obesity to be 24.1%, 46.7%, 12.8%, 13.5%, and 2.9% respectively. Compared to the richest, the women from the poorest households were significantly (p<0.001) most likely to be underweight (OR=2.75, 95% CI 2.27-3.35) and least likely to be over- weight (OR=0.15, 95% CI 0.12-0.19) over normal weight. The urban women, compared to their rural counter- parts, were significantly (p<0.001) less likely to be underweight (OR=0.80, 95% CI 0.71-0.91) and more likely to be overweight (OR=1.33, 95% CI 1.18-1.51) than normal weight. The other socioeconomic grades that were most marked to be underweight and overweight are age, women’s education, marital status, age at first child- birth, parity, number of children aged ≤5 years at the household, and food security. The findings confirm the dual burden of both under- and overweight. Systematic and regular monitoring and surveillance of the social trajectory of nutritional status of women and men in Bangladesh is crucial to develop apposite strategy that addresses the persistent and chronic problem of underweight and the emerging problem of overweight. The dual existence of both types of malnutrition among women in Bangladesh must be taken into consideration so that public health interventions may be adopted through appropriate policy. Key words: Dual burden; Malnutrition; Overweight; Underweight; Bangladesh
  • 2. Kamal SMM et al.Dual burden of underweight and overweight in Bangladeshi women Volume 33 | Number 1 | March 2015 93 increase has been faster in the developing countries (2). The positive relationship between obesity and socioeconomic position in developing countries stood in sharp contrast with the inverse association observed in developed countries where the preva- lence of obesity is higher among women from low socioeconomic groups (3). A landmark review of studies on socioeconomic status and obesity supports the view that obesity in the developing world would be essentially a non- communicable disease of the socioeconomic elite (2). The problem relating to body mass index (BMI) for both men and women should receive equal at- tention. However, concerns relating to women in developing countries deserve extra attention be- cause of cultural and economic backdrops, which hinder the blanching between male and female counterparts. An augmented number of literature asserts that an increased BMI of women is inde- pendently associated with increasing risk of adverse obstetric and neonatal outcome (4-6). The risks of overweight also include diabetes mellitus, increased risk of cardiovascular disease, cancer, hypertension, and other medical problems (7-16). Besides, a low BMI is often associated with low nutritional status and adverse health outcomes (12), such as preterm birth (17,18), low birthweight (17), mental health impairment (19), increased risk of early mortality (20), and higher risk of infant mortality (14). Early and late stillbirths are also associated with under- weight mothers compared to their normal-weight counterparts. Anaemia is also associated with ma- ternal underweight (9). Low pre-pregnancy BMI and short stature of women are known risk factors of poor maternal and birth outcomes. In develop- ing countries, like Bangladesh, maternal under- weight is a leading risk factor of preventable death and diseases. Both lean and obese women carry a risk of adverse pregnancy outcome and overall poor maternal and child health status. Thus, there is growing recogni- tion of a ‘double burden’ of malnutrition among populations in both affluent and less-affluent countries (21), i.e. the co-existence of undernu- trition (e.g. stunting or underweight) with over- weight, which has been observed at the national and household levels (22); this suggests the necessi- ty of population-based assessments of the patterns, prevalence, and determinants of underweight and overweight among women of reproductive age. Us- ing BMI as an important indicator of nutritional status, it is our aim to examine the nature of the re- lation between individual sociodemographic cate- gory and nutritional status among married women of Bangladesh and also investigate to what extent the factors influence the women to be underweight and overweight. MATERIALS AND METHODS Data for this study have been used from the most recent 2011 Bangladesh Demographic and Health Survey (BDHS) (23). A nationally-representative household-based sample was created through a stratified and two-stage cluster-sampling strategy. A uniform sampling design was adopted across all regions with urban and rural samples drawn sepa- rately and in proportion to the population of the regions, unless oversampling was required for any region or group. For both urban and rural areas, geographic sampling units were obtained, and ran- dom sampling of households was done in chosen units. The survey provides consistent and reliable estimates of fertility, age at first marriage, family planning, utilization of maternal and child health- care services, nutrition of children and adults, ma- ternal and child health, knowledge and awareness about sexually transmitted diseases (STDs)/sexually transmitted infections (STIs), HIV/AIDS, and other health-related indicators at the national as well as the regional levels. The 2011 BDHS gathered information on 17,749 ever-married women aged 15-49 years. The women with various missing information and those who were pregnant during the survey were excluded from analysis. After excluding women with miss- ing information (n=407) on the outcome measure and those who were pregnant (n=1,069) during the survey, the final sample for analysis stood at 16,273. Table 1 provides descriptive characteristics of the weighted sample that have been tabulated according to nutritional status for variables consid- ered in the study. Outcome measure Women’s weight status, indicated by their BMI category, was used as the outcome variable in the analyses. BMI was calculated as weight in kg di- vided by height in metre squared. This measure- ment of BMI is generally considered an appropriate method for epidemiological studies where objective measurement is less feasible. The well-trained field staff during at-home interviews measured body- size. Weight was measured using an electronic scale with a precision of 0.1 kg, and height was meas- ured with an adjustable measuring-board designed for use in survey settings, which can provide accu-
  • 3. Kamal SMM et al.Dual burden of underweight and overweight in Bangladeshi women JHPN94 Table 1. Definition of variables and percentage distribution of ever-married women*(N=16,273) aged 15-49 years, BDHS 2011 Exposure variable Description Measurement scale No. % Demographics Current age (completed years) Current age of the women at the time of survey Ordinal 1=15-24 4,674 28.7 2=25-34 5,564 34.2 3=35-49 6,035 37.1 Current marital status Respondent’s marital status at survey time Ordinal 1=Married 15,199 93.4 2=Widowed/ Divorced/Separated 1,074 6.6 Age at first childbirth (years) Respondent’s age at first livebirth of child Ordinal 1=<18 8,050 53.7 2=18+ 6,928 46.3 Parity Number of children ever born Ordinal 1=<3 8,702 53.5 2=3+ 7,571 46.5 No. of children aged ≤5 years Total number of children aged 5 years or below at the household Ordinal 1=None 7,950 48.9 2=One 6,018 37.0 3=Two+ 2,305 14.2 Socioeconomics Women’s education Women’s level of education Ordinal 0=No education 4,653 28.6 1=Primary 4,889 30.0 2=Secondary 5,581 34.3 3=Higher 1,151 7.1 Employment status Whether respondent was em- ployed at the time of survey Binary 0=Not employed 14,096 86.6 1=Employed 2,177 13.4 Wealth index Availability of luxurious ma- terials in the household Ordinal 1=Poorest 2,976 18.3 2=Poorer 3,169 19.5 3=Middle 3,265 20.1 4=Richer 3,390 20.8 5=Richest 3,473 21.3 Food security Whether the household had deficiency of food Ordinal 1=Secure 10,899 67.0 2=Mild insecurity 3,621 22.3 3=Moderate insecurity 1,269 7.8 4=Severe insecurity 480 3.0 Contd.
  • 4. Kamal SMM et al.Dual burden of underweight and overweight in Bangladeshi women Volume 33 | Number 1 | March 2015 95 rate measurements to the nearest 0.1 cm. The BMI was presented in the raw dataset of the survey. The WHO consultants suggest seven categories of BMI cutoff points for Asian countries (24): <16.00 kg/m2 (severe underweight), 16·00-16·99 kg/m2 (moder- ate underweight), 17·00-18·49 kg/m2 (mild under- weight), 18·50-22·99 kg/m2 (normal weight), 23.00- 24.99 kg/m2 (pre-overweight), 25.00-29·99 kg/m2 (overweight), and ≥30.00 kg/m2 (obese). Given the identification of a BMI of 23.00 as a public-health cutoff for risk of obesity in Asian populations (24) and the emerging evidence suggesting that lower cutoffs are appropriate for populations from the Indian Subcontinent (2,25,26), we narrowed the normal BMI range of 18.50-24.99 to 18.50-22.99. Following the abovementioned literature on Asian countries, we used three grades of underweight and overweight. Exposure variables The study considers demographic, socioeconomic and environmental factors to assess the nutritional status of the study women. The effect of one vari- able on the prevalence of malnutrition is likely to be confounded with the effects of other variables. Therefore, demographic, socioeconomic and en- vironmental characteristics were controlled sta- tistically. The variables included as covariates are: women’s current age at interview, current marital status, age at first childbirth, parity, number of children aged ≤5 years in the household, women’s education, place of residence, the region, wealth quintile, and food security. Notably, measurement of poverty and food secu- rity is complex and debatable, particularly due to the unavailability of direct and reliable information on household income or expenditure in cross- sectional sample surveys, like BDHS. Despite this, the 2011 BDHS has used wealth index in a conven- tional way as a proxy measure of socioeconomic status and food security for the first time. The rela- tive index of household wealth was calculated on the basis of a standard set of interviewer-observed assets, including the ownership of consumer items and dwelling characteristics. Besides, food security was measured by the response provided by the re- spondents to the question, “Did you ask food from relatives or neighbours in the past 12 months di- rectly?” The operational definition and categories of the variables are given in Table 1. Statistical analyses The weighted prevalence of severe underweight, moderate underweight, mild underweight, normal weight, pre-overweight, overweight, and obesity was obtained for each category using the national weights assigned by the cluster design at the prima- ry sampling unit level. The chi-square tests were ap- plied to study the difference in proportions of dif- ferent BMI between the categories of the exposure variables. The checking of multicollinearity by the estimated variance inflation factor (VIF) shown in Table 2 from multivariable linear regression model reveals its non-existence (27). To assess the net effect of exposure variables on the outcome measures, multinomial logistic regression analysis was contemplated to be suitable as the out- come measure is polychotomous by nature. The Table 1.—Contd. Exposure variable Description Measurement scale No. % Environmental Place of residence Current place of residence Ordinal 1=Urban 4,248 26.1 2=Rural 12,025 73.9 Region Place of region Ordinal 1=Barisal 886 5.4 2=Chittagong 2,928 18.0 3=Dhaka 5,236 32.2 4=Khulna 2,018 12.4 5=Rajshahi 2,442 15.0 6=Rangpur 1,908 11.7 7=Sylhet 854 5.2 Total 16,273 100.0 *Total number of women by different categories of exposure variables may not always be 16,273 due to missing cases
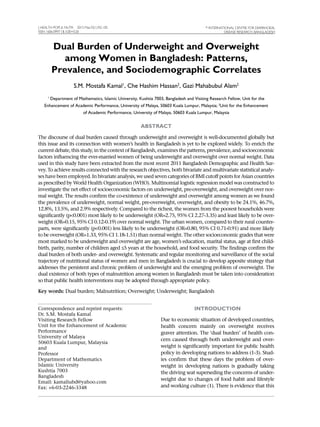
  • 5. Kamal SMM et al.Dual burden of underweight and overweight in Bangladeshi women JHPN96 Pr (yi = j | xi )= —————— exp (χi βj ) j k=1 exp (χi βj )∑ multinomial logistic model is the extension of the binary logistic regression model to outcome meas- ure with j=1, 2, 3, ..., k nominal outcomes. In its general form, the probability of an actor i belonging to category j is given by the following formula (28): where χi is a vector containing the values of m co- variates for person i, and βk is a vector of m +1 pa- rameters (β0k, β1k, β2k ..., βmk ) for each k=1, 2, 3, ..., j. To identify the parameters, it is common to choose one reference category and set the corresponding vector of parameters equal to a vector of zeroes. As we did not find substantial differences in the patterning of the sociodemographic and environ- mental exposures between the different grades of underweight, we merged the different grades of un- derweight to one category of BMI <18.50 labelling by ‘underweight’. Similarly, we merged overweight and obesity by labelling as ‘overweight’. The re- sults of the multinomial logistic regression analy- ses have been shown by odds ratios (ORs) with 95% confidence interval (CI) for easy understand- ing. The level of significance was set at 10%. Data were analyzed using SPSS (version 21) (SPSS Inc., Chicago, IL, USA). Ethical issue The study was based on a nationally-representative anonymous dataset for public use, with no identifi- able information on the survey participants. More- over, the survey followed all protocols prescribed by the WHO and was implemented by National Institute for Population Research and Training (NIPORT) under the Ministry of Health and Family Welfare, Government of Bangladesh. Therefore, no ethics statement is required for this study. RESULTS Characteristics of the sample Most of the respondents were rural residents and were currently in union, with mean±SD age of 31.2±9.2 years. The mean age at first marriage, mean age at first childbirth, mean number of children ever born per ever-married woman was 15.6±2.9 years, 17.8±3.3 years, and 2.7±1.9 (not shown in Table 1). Only a few proportions of wom- en had higher education and were employed dur- ing survey. The large proportion of the respondents was from Dhaka region. Almost 11% reported to have deficiency of food whereas five categories of wealth quintiles demonstrated nearly equal distri- bution of women. BMI and sociodemographic factors The distribution of women across categories of BMI shows that 46.7% were normal, 24.2% were under- weight, 12.8% were pre-overweight, and 16.4% were overweight and obese (Figure 1). The associ- ated p values in chi-square analysis suggest signifi- cant difference (p<0.01) in seven categories of BMI by different groups of exposure variables, except for the women’s employment status (Table 3). The es- Obese Overweight Pre-overweight Normal Mildly thin Moderately thin Severely thin 2.9 13.5 Grades of overweight 12.8 14.4 46.7 6.0 3.8 0 10 20 Percentage 30 40 50 GradesofBMI Grades of underweight Figure 1. Distribution of ever-married women of reproductive age by different strata of BMI, BDHS 2011
  • 6. Kamal SMM et al.Dual burden of underweight and overweight in Bangladeshi women Volume 33 | Number 1 | March 2015 97 timated coefficients of the multivariable regression model show significant positive relationship be- tween BMI and current age (p<0.001), women’s level of education (p<0.001), and wealth index (p<0.001) whereas negative association was observed for cur- rent marital status (p<0.001), age at first childbirth (p<0.001), parity (p<0.001), number of children aged ≤5 years in household (p<0.001), residence (urban to rural) (p<0.001), and food security (secure to insecure) (p<0.001). Region was also a significant factor (p<0.05) for nutritional status of women. Trends in BMI by cutoff points Figure 2 shows that the prevalence of normal weight was steady in the period 2004 to 2007 and then decreased by 2.0% from 48.7% to 46.7% dur- ing 2007 to 2011. We noted significant decrease of the pervasiveness of underweight for the same period. The prevalence of underweight decreased by 9.9%—from 34.2% to 24.1% during 2004 to 2011. The figure exhibits an apparent increasing trend in all grades of overweight. For instance, the prevalence of pre-overweight increased by 4.2%— from 8.2% to 12.4%—whereas the rate of over- weight and obesity increased by two folds during the period 2004-2011. Markedly, the addition of all grades of overweight reveals that the prevalence of overweight exceeded the underweight body-shape of women in 2011. Determinants of underweight, pre-overweight, and overweight Table 4 shows the adjusted ORs for underweight, pre-overweight, and overweight relative to the nor- mal weight for the covariates considered for analy- sis. Compared to the elder, the younger were more likely to be underweight. Age was positively associ- ated with pre-overweight, overweight, and obesity, relative to normal weight. The likelihood to be un- derweight was significantly lower for the currently- married women than those who were not in union during the survey. The current marital status was no longer a significant factor for pre-overweight and overweight, controlling for other covariates. The women who had given first childbirth before the age of 18 years were less likely to be under- weight, although it showed to have no significant effect on other categories of BMI. The women with fewer children aged ≤5 years at the household were less likely to be underweight and more likely to be overweight than those who had more. Women’s level of education was significantly and negatively associated with being underweight and was positively associated with pre-overweight and overweight relative to normal weight. The wealth quintiles show familiar fashion in the likelihood of being underweight and overweight. The risk of being underweight increased systematically with the decreases in wealth index. In contrast, the risk of being pre-overweight and overweight decreased significantly with the increase of standard of liv- ing index. The higher the food security, the lower the risk of being underweight. However, food se- curity had no longer significant effect of being pre-overweight and overweight. The rural women, compared to their urban counter- parts, were more likely to be underweight whereas urban women were more tended to be overweight than their rural counterparts. The women living in theBarisal,Chittagong,Dhaka,Khulna,Rajshahiand Rangpur regions were less likely to be underweight compared to the reference region of Sylhet. Besides, the women from Chittagong, Khulna and Rajshahi regions were more tended to be pre-overweight and Table 2. Multivariable regression coefficients and the variance inflation factor (VIF) for predictors with BMI as outcome measure adjusted for duration of marriage Predictor Coefficient SE t-value p value VIF Age 0.087 0.005 16.635 0.000 2.721 Current marital status -0.818 0.122 -6.691 0.000 1.097 Age at first childbirth -0.026 0.010 -2.646 0.008 1.343 Parity -0.174 0.024 -7.355 0.000 2.179 No. of children aged ≤5 years -0.212 0.046 -4.651 0.000 1.345 Women’s level of education 0.383 0.039 9.774 0.000 1.656 Employment status -0.052 0.086 -0.602 0.547 1.074 Wealth quintile 0.760 0.027 28.275 0.000 1.808 Food security -0.140 0.040 -3.485 0.000 1.218 Place of residence -0.823 0.074 -11.082 0.000 1.326 SE=Standard error
  • 7. Kamal SMM et al.Dual burden of underweight and overweight in Bangladeshi women JHPN98 Table3.Distributionofever-marriedwomenacrosscategoriesofBMIbydifferentpredictors,BDHS2011 Backgroundcharacteristics BMI(kg/m2 )category χ2 <16.0016.00-16.9917.00-18.4918.50-22.9923.00-24.9925.00-29.99≥30.00 Currentage(completedyears)590.54a 15-243.5(165)7.9(371)19.0(887)52.6(2,457)9.1(424)6.8(319)1.1(51) 25-343.0(165)5.4(298)12.4(692)45.6(2,536)14.5(809)16.1(895)3.0(169) 35-494.7(284)5.0(300)12.5(756)43.2(2,609)14.2(858)16.3(982)4.1(247) Currentmaritalstatus65.75a Married3.6(549)5.8(877)14.0(2,126)47.2(7,166)13.0(1,976)13.6(2,063)2.9(442) Widowed/Divorced/Separated6.1(65)8.6(92)19.5(209)40.5(435)10.7(115)12.4(133)2.3(25) Ageatfirstchildbirth(years)112.26a <183.9(316)6.1(488)15.2(1,225)48.4(3,893)12.4(999)11.5(926)2.5(203) 18+3.8(261)5.5(384)12.7(882)44.4(3,073)13.7(950)16.4(1,134)3.5(243) Parity58.78a <32.8(240)6.2(541)14.3(1,248)46.9(4,084)13.2(1,151)13.8(1,204)2.7(234) 3+4.9(373)5.7(428)14.4(1,087)46.5(3,518)12.4(939)13.1(992)3.1(233) No.ofchildrenaged≤5years181.55a None3.8(304)5.3(421)12.8(1,015)45.0(3,575)14.2(1,132)15.5(1,230)3.4(274) One3.8(228)6.4(387)14.5(872)48.3(2,910)12.2(734)12.3(741)2.4(145) Two+3.5(82)7.0(161)19.4(448)48.5(1,117)9.7(225)9.8(225)2.1(47) Women’seducation689.78a Noeducation5.7(267)6.7(310)17.2(801)48.1(2,239)11.2(521)9.3(430)1.8(83) Primary4.0(195)7.2(350)15.5(756)48.2(2,356)11.7(572)11.4(559)2.1(101) Secondary2.6(143)5.1(285)12.7(711)46.0(2,567)13.9(773)16.0(890)3.8(211) Higher0.8(9)2.0(23)5.8(67)38.2(440)19.5(224)27.5(316)6.2(71) Employmentstatus6.53 Notemployed3.7(524)6.0(844)14.5(2,039)46.9(6,607)12.7(1,796)13.3(1,876)2.9(410) Employed4.1(89)5.7(125)13.6(297)45.7(995)13.5(295)14.7(320)2.6(57) Contd.
  • 8. Kamal SMM et al.Dual burden of underweight and overweight in Bangladeshi women Volume 33 | Number 1 | March 2015 99 Table3.—Contd. Backgroundcharacteristics BMI(kg/m2 )category χ2 <16.0016.00-16.9917.00-18.4918.50-22.9923.00-24.9925.00-29.99≥30.00 Wealthindex2,586.34a Poorest7.6(225)10.2(304)22.1(658)49.0(1,458)6.2(186)4.6(136)0.3(9) Poorer4.7(149)7.4(235)17.9(568)53.7(1,700)9.7(308)6.0(191)0.6(18) Middle3.6(119)6.4(208)15.4(503)50.4(1,546)13.1(427)9.9(322)1.2(41) Richer2.6(88)4.6(154)12.3(417)45.2(1,531)15.2(514)17.3(586)2.9(98) Richest0.9(33)1.9(68)5.5(189)36.5(1,266)18.9(655)27.7(961)8.6(300) Foodsecurity498.30a Food-secure3.1(334)4.9(533)12.7(1,382)45.6(4,973)14.2(1,549)15.8(1,727)3.7(401) Mildinsecurity4.8(173)7.4(266)16.5(596)49.3(1,784)10.9(395)9.6(349)1.5(56) Moderateinsecurity5.9(74)10.5(133)19.0(241)49.5(628)7.9(100)6.8(86)0.6(4) Severeinsecurity6.7(32)7.7(37)24.2(116)44.2(212)9.6(46)7.2(35)0.5(2) Placeofresidence940.57a Urban1.9(81)2.9(123)8.7(368)41.4(1,759)16.5(701)22.3(945)6.4(271) Rural4.4(533)7.0(846)16.4(1,968)48.6(5,843)11.6(1,390)10.4(1,251)1.6(196) Region239.28a Barisal4.5(40)6.6(58)15.7(139)48.9(433)11.9(105)10.7(95)1.8(16) Chittagong3.3(96)4.7(138)14.2(416)45.5(1,332)14.6(427)14.5(426)3.2(93) Dhaka4.1(217)6.0(314)13.4(704)45.9(2,403)12.5(653)14.4(755)3.6(190) Khulna2.2(45)4.5(92)12.1(244)46.7(943)14.7(296)16.6(334)3.2(64) Rajshahi3.6(87)6.7(164)14.4(351)46.5(1,135)13.4(328)13.1(319)2.4(59) Rangpur3.6(69)6.9(131)16.4(313)51.9(990)10.6(202)9.2(175)1.4(27) Sylhet7.0(60)8.3(71)19.7(168)42.7(365)9.3(79)10.8(93)2.1(18) Total3.8(614)6.0(969)14.3(2,336)46.7(7,601)12.8(2,091)13.5(2,196)2.9(467) Chi-squaretestsforthecross-tabulationbetweeneachvariableandthesevencategoriesofBMI;a p<0.001
  • 9. Kamal SMM et al.Dual burden of underweight and overweight in Bangladeshi women JHPN100 overweight than those of the reference region. In ad- dition, compared to the women from Sylhet region, those living in Chittagong and Khulna were signifi- cantly at increased risk of overweight. DISCUSSION The present study, to our knowledge, examines for the first time the sociodemographic and environ- mental distribution of nutritional status of ever- married women with mean age of 31.2±9.2 years, using the Asia-specific cutoff points of BMI. The findings document the co-existence of dual burden of underweight and overweight among women in Bangladesh, using data of the most recent national- ly-representative population sample survey cover- ing all regions of Bangladesh. Findings show that, in 2011, the prevalence of underweight, normal weight, and overweight was 24.1%, 46.7%, and 29.2% respectively, suggesting that the incidence of overweight exceeded underweight for the first time. The incidence of underweight has decreased substantially and continually during the period from 2004 to 2011. There is an apparent socioeconomic, demographic and environmental distribution of causal patterns of nutritional status, with younger women, women from low socioeconomic position, and rural resi- dents experiencing a greater risk of underweight, and the elder women, those from high socioeco- nomic status, and urban residents experiencing the greatest risk of being pre-overweight, overweight, and obese. Our findings are consistent with earlier studies conducted on women and men from the neighbouring country India (2,29-32) and other developing countries (33,34). The increased likelihood of being underweight and decreased risk of being overweight among the younger women, compared to their elder counter- parts, and decreased risk of underweight among women who were currently in union may be partly attributed to physical activity, cultural norms, and food practising. Biological phenomena are also concerned with undernutrition of young women compared to their elders. The ever-married women who were not currently in union during the survey were possibly older than were those who were cur- rently in union. The martially-disrupted women in Bangladesh may have less physical activity than those who live with husbands because of limited outdoor activities due to specific climatic and social circumstances. Our findings are supported by ear- lier studies (32,33). Studies pointed that, although individual behaviours, such as physical activity and sound nutritional practices, have been demon- strated to lead to weight loss, scaling up of these messages to the population level has proven elusive (35). Increasingly, those responsible for disease pre- vention have come to emphasize that individual- level behaviours are not sufficient, by themselves, to mitigate the worldwide obesity epidemic (36). 50 45 40 35 30 25 20 15 10 5 0 34.2 29.5 48.748.7 46.7 8.2 10.1 10.1 13.5 1.4 1.7 2.9 12.8 7.5 24.1 U nderw eight N orm al Pre-overw eight O verw eight O bese Percentage Grades of BMI Figure 2. Trends in BMI of ever-married women of reproductive age for the period 2004-2011 by Asia-Pacific standard 2004 2007 2011
  • 10. Kamal SMM et al.Dual burden of underweight and overweight in Bangladeshi women Volume 33 | Number 1 | March 2015 101 Table 4. Adjusted odds ratios (95% CI) for the study variables and covariates from multinomial logistic mod- el predicting underweight, pre-overweight, overweight, and obesity for the ever-married women Background characteristics BMI category Underweight vs Normal weight Pre-overweight vs Normal weight Overweight/Obese vs Normal weight Current age (completed years) 15-24 1.30 (1.12-1.51)a 0.47 (0.39-0.58)a 0.29 (0.24-0.36)a 25-34 0.95 (0.85-1.06) 0.91 (0.80-1.04) 0.81 (0.71-0.91)b 35-49 Reference Reference Reference Current marital status Currently married 0.64 (0.54-0.75)a 1.09 (0.86-1.37) 1.01 (0.82-1.25) Widowed/Divorced/Separated Reference Reference Reference Age at first childbirth (years) <18 0.93 (0.85-1.02)d 1.06 (0.95-1.18) 0.96 (0.87-1.07) 18+ Reference Reference Reference Parity <3 0.95 (0.85-1.06) 1.24 (1.09-1.41)a 1.10 (0.97-1.24)d 3+ Reference Reference Reference No. of children aged ≤5 years None 0.81 (0.71-0.92)a 1.34 (1.12-1.69)a 1.34 (1.13-1.59)a One 0.87 (0.77-0.98)b 1.21 (1.02-1.44)c 1.19 (1.00-1.40)c Two+ Reference Reference Reference Women’s education No education 1.78 (1.32-2.40)a 0.79 (0.62-1.01)c 0.59 (0.48-0.74)a Primary 1.73 (1.29-2.31)a 0.79 (0.63-1.00)c 0.69 (0.56-0.85)a Secondary 1.52 (1.14-2.02)b 0.86 (0.69-1.06) 0.86 (0.71-1.03)d Higher Reference Reference Reference Wealth index Poorest 2.75 (2.27-3.35)a 0.29 (0.23-0.36)a 0.15 (0.12-0.19)a Poorer 2.00 (1.65-2.42)a 0.41 (0.33-0.49)a 0.17 (0.14-0.20)a Middle 1.88 (1.56-2.26)a 0.54 (0.45-0.64)a 0.28 (0.24-0.33)a Richer 1.68 (1.41-2.02)a 0.69 (0.59-0.81)a 0.53 (0.46-0.61)a Richest Reference Reference Reference Food security Food-secure 0.75 (0.60-0.93)b 0.96 (0.68-1.36) 1.14 (0.78-1.67) Mild insecurity 0.79 (0.63-0.99)c 0.89 (0.63-1.27) 1.03 (0.70-1.51) Moderate insecurity 0.84 (0.66-1.07) 0.74 (0.50-1.10) 0.86 (0.56-1.33) Severe insecurity Reference Reference Reference Place of residence Urban 0.80 (0.71-0.91)a 1.09 (0.96-1.25) 1.33 (1.18-1.51)a Rural Reference Reference Reference Region Barisal 0.70 (0.55-0.89)a 1.23 (0.88-1.73) 1.12 (0.80-1.55) Chittagong 0.62 (0.51-0.76)a 1.44 (1.09-1.90)b 1.35 (1.04-1.75)b Dhaka 0.71 (0.59-0.85)a 1.05 (0.80-1.38) 1.05 (0.82-1.36) Khulna 0.52 (0.42-0.65)a 1.35 (1.01-1.81)c 1.52 (1.16-1.99)a Rajshahi 0.67 (0.55-0.81)a 1.33 (0.99-1.77)c 1.37 (1.05-1.80)a Rangpur 0.60 (0.49-0.74)a 1.08 (0.80-1.46) 0.97 (0.72-1.29) Sylhet Reference Reference Reference a p<0.001; b p<0.01; c p<0.05; d p<0.10
  • 11. Kamal SMM et al.Dual burden of underweight and overweight in Bangladeshi women JHPN102 When the parity and total number of children aged ≤5 years in household are concerned, the lat- ter one appeared as a more powerful predictor of women’s nutritional status than the previous one. For instance, women with low parity (<3) were sig- nificantly more tended to be pre-overweight and overweight, relative to normal whereas the women with fewer children were less likely to be under- weight and more tended to be obese, including pre-overweight and overweight. In patriarchal soci- ety, like Bangladesh, where childrearing is the main responsibility of women, the adverse lifestyle risk factors associated with rearing of many children at a time significantly affect the women’s health through a complex way, which includes socioeco- nomic, demographic, mental, psychological and also biological factors. However, consistent with earlier studies (37), our findings show significant negative association between parity and number of children aged five or below in the household and BMI. Findings reveal a strong significant association between BMI and women’s level of education and wealth quintile. The higher the level of edu- cation and the wealth quintile, the lower was the risk of being underweight. In contrast, the grades of overweight increased significantly with increase in women’s level of education and wealth quin- tile. The increased risk of grades of overweight for women in more flattering social position is partial- ly attributed to the capability of boasting up more- than-adequate food supplies and lesser physical activities than women belonging to poor socioeco- nomic status. The higher incidence of overweight and obesity in higher socioeconomic groups may be partly explained by the possible indifference to body-shapes. These differences may contribute to explaining the strong observed association between high socioeconomic positions and overweight (2). Moreover, these days people with increased income are willing to pay for a larger number of high-calorie beverages to respond to the elite marketing, which substantially contribute to gain weight. Thus, in spite of socioeconomic variability in population, the increased consumption of high-calorie bever- ages may explain some of the positive relationship between wealth quintile and BMI (38). Consist- ent with many studies (2,29-34), ours suggest that women belonging to higher socioeconomic posi- tion are at the elevated risk of being overweight, and those with poor socioeconomic status are at increased risk of underweight, further suggesting the ‘dual burden’ of nutritional status of women in Bangladesh. A similar result was found in an earlier study in analyzing socioeconomic and geograph- ic patterning of under- and overnutrition among women in Bangladesh (39). The unavailability of food is strongly associated with underweight body-shape of women and not significantly with overweight. Whereas obesity is associated with privileged circumstances in low- income countries (40), it is more often associated with lower socioeconomic status in developed countries (41). This observation suggests that, in a more food-abundant environment, socioeconom- ic factors, such as wealth, education, and income level, may change the relationship between food availability and overweight and/or obesity. In the low- and middle-income countries, these relation- ships are less consistent (40). Obesity may be asso- ciated with wealth in some situations but with pov- erty in others (42). Underweight and overweight may, sometimes, co-exist in the same neighbour- hoods (22), or even in the same households (43). However, our findings are quite in a good agree- ment with that of low-income countries (40). The association between socioeconomic status and BMI in low-income settings, like Bangladesh suggests that rural people is likely to be subjected to the changing patterns of food availability, food composition, and consumption behaviour. Find- ings reveal that rural women were less likely to be overweight than those in urban areas. This finding is similar to that of an Indian study (2). Moreover, we marked significant regional variation of BMI among women. The women living in Sylhet re- gion were at increased risk of underweight relative to normal weight. The previous BDHSs conducted in 2004 and 2007 also reported higher prevalence of underweight among women living in Sylhet region. Further, the women from Chittagong, Khulna, and Rajshahi were at increased risk of overweight and/or obesity than were those from Sylhet region. These findings underscore that women living in the more urbanized regions may be at higher risk of overweight and those living in the typically agriculture-based region may be at risk of being underweight. Although the region of Dhaka is more exposed to urbaniation, the rapid migration of rural people to Dhaka, the capital city of Bangladesh, may have attenuated its effect on being overweight or obese among women. This finding is also consistent with an earlier study on Bangladeshi women (39). Strengths and limitations The study has several strengths and limitations
  • 12. Kamal SMM et al.Dual burden of underweight and overweight in Bangladeshi women Volume 33 | Number 1 | March 2015 103 that urge explanations. The first limitation is that, we used BMI as the only measure of overweight. Although BMI is a reliable indicator of body fat- ness and a low BMI is likely to be a valid proxy for chronic energy deficiency, BMI does not distin- guish between body fat and lean body mass. Waist- circumference (26) and waist-to-hip ratios (44) con- sequently have been suggested as better markers of obesity. Recent studies have shown that South Asians have the poorest correlation between waist- circumference and BMI when comparing them against the Europeans, Chinese, and Aboriginal persons, although the correlation is still substantial (25). However, BMI is a WHO-prescribed indicator of nutritional status measurement that is interna- tionally used. Second, the BMI cutoff points we used in this study may understate health risk. It is notable that, a growing body of literature, includ- ing those on Indians (2,31,32), have used this BMI cutoff points, which is recommended by WHO and now globally recognized. Third, as a cross-sectional study, the present analysis is limited to its ability to elucidate causal relationships between risk factors and overweight. BMI can overestimate body fat in individuals who are very muscular and underesti- mate body fat in individuals who have lost mus- cle mass, such as many elderly (45). Despite these, the strengths of the study include the large sample consisting of both rural and urban populations, representativeness of the national population, and information on potential determinants of under- weight and overweight. Conclusions Bangladesh is facing the dual burden of under- weight and overweight. The findings suggest that the nutritional status of women is related to indi- vidual, socioeconomic and environmental level. The nutritional status of individuals and societies, at a given point in time, is likely to reflect the cu- mulative synergy between physiologic endow- ments and the social environment (2). It is likely that the identification of sociodemographic and environmental factors affecting nutritional status of women is of great importance for developing and targeting interventions to face the dual bur- den of underweight and overweight as these epi- demics may adversely impact the health of both mother and child in the long run and thereby the society as a whole. Regardless, systematic and regular monitoring and surveillance of the social trajectory of nutritional status of women and men in Bangladesh is crucial to develop apposite strate- gy that addresses the persistent and chronic prob- lem of underweight and the emerging problem of overweight. The dual existence of both types of malnutrition among women in Bangladesh must be taken into consideration so that public health interventions may be adopted through appropri- ate policy. Conflict of interest: Authors declare no conflicts of interest. REFERENCES 1. Mendez MA, Monteiro CA, Popkin BM. Overweight exceeds underweight among women in most devel- oping countries. Am J Clin Nutr 2005;81:714-21. 2. Subramanian SV, Smith GD. Patterns, distribution, and determinants of under- and overnutrition: a population-based study of women in India. Am J Clin Nutr 2006;84:633-40. 3. James WPT. The epidemiology of obesity: the size of the problem. J Intern Med 2008;263:e336-e52. doi: 10.1111/j.1365-2796.2008.01922.x. 4. Cedergren MI. Maternal morbid obesity and the risk of adverse pregnancy outcome. Obstet Gynecol 2004;103:219-24. 5. Heslehurst N, Simpson H, Ells LJ, Rankin J, Wilkinson J, Lang R et al. The impact of maternal BMI status on pregnancy outcomes with immediate short-term obstetric resource implications: a meta-analysis. Obes Rev 2008;9:635-83. 6. Oteng-Ntim E, Kopeika J, Seed P, Wandiembe S, Doy- le P. Impact of obesity on pregnancy outcome in dif- ferent ethnic groups: calculating population attribut- able fractions. PLoS One 2013;8:e53749. doi: 10.1371/ journal.pone.0053749. 7. Torloni MR, Betrán AP, Horta BL, Nakamura MU, Atal- lah AN, Moron AF et al. Prepregnancy BMI and the risk of gestational diabetes: a systematic review of the literature with meta-analysis. Obes Rev 2009;10:194- 203. 8. O’Brien TE, Ray JG, Chan WS. Maternal body mass index and the risk of preeclampsia: a systematic over- view. Epidemiology 2003;14:368-74. 9. Sahu MT, Agarwal A, Das V, Pandey A. Impact of ma- ternal body mass index on obstetric outcome. J Obstet Gynaecol Res 2007;33:655-9. 10. Knight M; UKOSS. Antenatal pulmonary embo- lism: risk factors, management and outcomes. BJOG 2008;115:453-61. 11. Poobalan AS, Aucott LS, Gurung T, Smith WC, Bhat- tacharya S. Obesity as an independent risk factor for elective and emergency caesarean delivery in nullipa- rous women—systematic review and meta-analysis of cohort studies. Obes Rev 2009;10:28-35.
  • 13. Kamal SMM et al.Dual burden of underweight and overweight in Bangladeshi women JHPN104 12. Ringbäck Weitoft G, Eliasson M, Rosén M. Under- weight, overweight and obesity as risk factors for mortality and hospitalization. Scand J Public Health 2008;36:169-76. 13. FlegalKM,KitBK,OrpanaH,GraubardBI.Association of all-cause mortality with overweight and obesity us- ing standard body mass index categories: a systematic review and meta-analysis. JAMA 2013;309:71-82. 14. Tennant PWG, Rankin J, Bell R. Maternal body mass index and the risk of fetal and infant death: a co- hort study from the North of England. Hum Reprod 2011;26:1501-11. 15. Cresswell JA, Campbell OM, De Silva MJ, Filippi V. Effect of maternal obesity on neonatal death in sub- Saharan Africa: multivariable analysis of 27 national datasets. Lancet 2012;380:1325-30. 16. Nagai M, Kuriyama S, Kakizaki M, Ohmori-Matsuda K, Sone T, Hozawa A et al. Impact of obesity, over- weight and underweight on life expectancy and life- time medical expenditures: the Ohsaki cohort study. BMJ Open 2012;2:e000940. doi:10.1136/bmjopen- 2012-000940. 17. Kalk P, Guthmann F, Krause K, Relle K, Godes M, Gossing G et al. Impact of maternal body mass index on neonatal outcome. Eur J Med Res 2009;14:216-22. 18. Taylor-Robinson D, Agarwal U, Diggle PJ, Platt MJ, Yoxall B, Alfirevic Z. Quantifying the impact of dep- rivation on preterm births: a retrospective cohort study. PLoS One 2011;6:e23163. doi: 10.1371/journal. pone.0023163. 19. Mond J, Rodgers B, Hay P, Owen C. Mental health impairment in underweight women: do body dissat- isfaction and eating-disordered behavior play a role? BMC Public Health 2011;11:547. doi: 10.1186/1471- 2458-11-547. 20. Robinson MK, Mogensen KM, Casey JD, McKane CK, Moromizato T, Rawn JD et al. The relationship among obesity, nutritional status, and mortality in the critically ill. Crit Care Med 2015;43:87-100. 21. Popkin BM, Gordon-Larsen P. The nutrition transi- tion: worldwide obesity dynamics and their deter- minants. Int J Obes Relat Metab Disord 2004;28(Suppl 3):S2-9. 22. Doak CM, Adair LS, Monteiro C, Popkin BM. Over- weight and underweight coexist within households in Brazil, China and Russia. J Nutr 2000;130:2965-71. 23. National Institute of Population Research and Train- ing. Bangladesh Demographic and Health Survey 2011: preliminary report. Dhaka: National Institute of Population Research and Training, 2012. 46 p. 24. WHO Expert Consultation. Appropriate body- mass index for Asian populations and its implica- tions for policy and intervention strategies. Lancet 2004;363:157-63. 25. Razak F, Anand S, Vuksan V, Davis B, Jacobs R, Teo KK et al. Ethnic differences in the relationships between obesity and glucose-metabolic abnormalities: a cross sectional population-based study. Int J Obes (Lond) 2005;29:656-67. 26. Misra A, Vikram NK, Gupta R, Pandey RM, Wasir JS, Gupta VP. Waist circumference cutoff points and ac- tion levels for Asian Indians for identification of ab- dominal obesity. Int J Obes (Lond) 2006;30:106-11. 27. Chatterjee S, Hadi AS. Regression analysis by exam- ple. 5th ed. New Jersey, NJ: John Wiley, 2006. 424 p. 28. Long JS. Regression models for categorical and limit- ed dependent variables. Thousand Oaks: Sage, 1997. 297 p. (Advanced quantitative techniques in the so- cial sciences, V. 7). 29. Shukla HC, Gupta PC, Mehta HC, Hebert JR. Descrip- tive epidemiology of body mass index of an urban adult population in western India. J Epidemiol Com- munity Health 2002;56:876-80. 30. Ramesh P, Jareena S. Overweight exceeds under- weight among women in Kerala: an analysis of trends and determinants. J Hum Ecol 2009;25:93-103. 31. Subramanian SV, Kawachi I, Smith GD. Income in- equality and the double burden of under- and over- nutrition in India. J Epidemiol Community Health 2007;61:802-9. 32. Subramanian SV, Perkins JM, Khan KT. Do burdens of underweight and overweight coexist among low- er socioeconomic groups in India? Am J Clin Nutr 2009;90:369-76. 33. Janghorbani M, Amini M, Willett WC, Gouya MM, Delavari A, Alkhani S et al. First nationwide survey of prevalence of overweight, underweight, and abdomi- nal obesity in Iranian adults. Obesity 2007;15:2797- 808. 34. Ly KA, Ton TGN, Ngo QV, Vo TT, Fitzpatrick AL. Dou- ble burden: a cross-sectional survey assessing factors associated with underweight and overweight status in Danang, Vietnam. BMC Public Health 2013;13:35. doi: 10.1186/1471-2458-13-35. 35. Berkel LA, Poston WSC, Reeves RS, Foreyt JP. Be- havioral interventions for obesity. J Am Diet Assoc 2005;105:S35-S43. 36. Mowafi M, Khadr Z, Subramanian SV, Bennette G, Hill A, Kawachi I. Are neighborhood education levels associated with BMI among adults in Cairo, Egypt? Soc Sci Med 2011;72:1274-83. 37. Koch E, Bogado M, Araya F, Romero T, Diaz T, Man- riquez L et al. Impact of parity on anthropometric measures of obesity controlling by multiple con-
  • 14. Kamal SMM et al.Dual burden of underweight and overweight in Bangladeshi women Volume 33 | Number 1 | March 2015 105 founders: a cross sectional study in Chilean women. J Epidemiol Community Health 2008;62:461-70. 38. Fernald L. Socio-economic status and body mass index in low-income Mexican adults. Soc Sci Med 2007;64:2030-42. 39. Corsi DJ, Kyu HH, Subramanian SV. Socioeco- nomic and geographic patterning of under- and overnutrition among women in Bangladesh. J Nutr 2011;141:631-8. 40. Gulliford MC, Mahabir D, Rocke B. Food insecurity, food choices, and body mass index in adults: nutri- tion transition in Trinidad and Tobago. Int J Epidemiol 2003;32:508-16. 41. Adams EJ, Grummer-Strawn L, Chavez G. Food inse- curity is associated with increased risk of obesity in California women. J Nutr 2003;133:1070-4. 42. Monteiro CA, Conde WL, Popkin BM. Independ- ent effects of income and education on the risk of obesity in the Brazilian adult population. J Nutr 2001;131:S881-6. 43. Florêncio TM, Ferreira HS, de França AP, Cavalcante JC, Sawaya AL. Obesity and undernutrition in a very- low-income population in the city of Maceió, north- eastern Brazil. Br J Nutr 2001;86:277-84. 44. Yusuf S, Hawken S, Ounpuu S, Bautista L, Franzosi MG, Commerford P et al.; INTERHEART Study Inves- tigators. Obesity and the risk of myocardial infarction in 27,000 participants from 52 countries: a case-con- trol study. Lancet 2005;366:1640-49. 45. Paeratakul S, Lovejoy JC, Ryan DH, Bray GA. The re- lation of gender, race, and socioeconomic status to obesity and obesity comorbidities in a sample of US adults. Int J Obes Relat Metab Disord 2002;26:1205-10.