Connectomics: Parcellations and Network Analysis Methods
•
4 likes•2,430 views

Simple tutorial on methods for functional connectome analysis: learning regions, extracting functional signal, inferring the network structure, and comparing it across subjects.

Recommended
Recommended
More Related Content
What's hot
What's hot (20)
Viewers also liked
Viewers also liked (20)
Similar to Connectomics: Parcellations and Network Analysis Methods
Similar to Connectomics: Parcellations and Network Analysis Methods (20)
More from Gael Varoquaux
More from Gael Varoquaux (14)
Connectomics: Parcellations and Network Analysis Methods
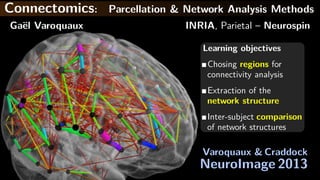
- 1. Connectomics: Parcellation & Network Analysis Methods Ga¨el Varoquaux INRIA, Parietal – Neurospin Learning objectives Chosing regions for connectivity analysis Extraction of the network structure Inter-subject comparison of network structures Varoquaux & Craddock NeuroImage 2013
- 2. Declaration of Relevant Financial Interests or Relationships Speaker Name: Gaël Varoquaux I have no relevant financial interest or relationship to disclose with regard to the subject matter of this presentation. ISMRM 20th ANNUAL MEETING & EXHIBITION “Adapting MR in a Changing World”
- 3. Functional connectivity and connectomics Fluctuations in functional imaging signals capture brain interactions Many pathologies are expressed by modified brain interactions Need quantitative tools to develop biomarkers Connectome based on regions to reduce number of connections studied G Varoquaux 3
- 4. Connectomics: Problem setting and vocabulary Infer and compare connections between a set of regions Graph: set of nodes and connections Weighted or not. Directed or not. Can be represented by an adjacency matrix. G Varoquaux 4
- 5. Connectomics: an outline 1 Functional parcellations 2 Signal extraction 3 Connectivity graphs 4 Comparing connectomes G Varoquaux 5
- 6. 1 Functional parcellations Defining regions for connectomics G Varoquaux 6
- 7. 1 Need for functional parcellations Anatomical atlases do not resolve functional structures Harvard Oxford AAL G Varoquaux 7
- 8. 1 Clustering Group together voxels with similar time courses ... ... ... ... ... Considerations – Spatial constraints – Number of regions – Running time G Varoquaux 8
- 9. 1 Clustering Normalized cuts Downloadable atlas With many parcels becomes a regular paving Ward clustering Good with many parcels Very fast Python implementation http://nisl.github.io G Varoquaux 9
- 10. 1 Linear decomposition models Cognitive networks are present at rest Time courses G Varoquaux 10
- 11. 1 Linear decomposition models Cognitive networks are present at rest Time courses Language G Varoquaux 10
- 12. 1 Linear decomposition models Cognitive networks are present at rest Time courses Audio G Varoquaux 10
- 13. 1 Linear decomposition models Cognitive networks are present at rest Time courses Visual G Varoquaux 10
- 14. 1 Linear decomposition models Cognitive networks are present at rest Time courses Dorsal Att. G Varoquaux 10
- 15. 1 Linear decomposition models Cognitive networks are present at rest Time courses Motor G Varoquaux 10
- 16. 1 Linear decomposition models Cognitive networks are present at rest Time courses Salience G Varoquaux 10
- 17. 1 Linear decomposition models Cognitive networks are present at rest Time courses Ventral Att. G Varoquaux 10
- 18. 1 Linear decomposition models Cognitive networks are present at rest Time courses Parietal G Varoquaux 10
- 19. 1 Linear decomposition models Cognitive networks are present at rest Time courses Observe a mixture Need to unmix networks G Varoquaux 10
- 20. 1 Linear decomposition models Independent Component Analysis Extracts networks Downloadable atlas [Smith 2009] Sparse dictionary learning Networks outlined cleanly Bleeding edge Atlas on request G Varoquaux 11
- 21. 1 Linear decomposition models Independent Component Analysis Extracts networks Downloadable atlas [Smith 2009] Sparse dictionary learning Networks outlined cleanly Bleeding edge Atlas on request G Varoquaux 11
- 22. 2 Signal extraction Enforce specificity to neural signal G Varoquaux 12
- 23. 2 Choice of regions Too many regions gives harder statistical problem: ⇒ ∼ 30 ROIs for group-difference analysis Nearly-overlapping regions will mix signals Avoid too small regions ⇒ ∼ 10mm radius Capture different functional networks Automatic parcellation do not solve everything G Varoquaux 13
- 24. 2 Time-series extraction Extract ROI-average signal: weighted-mean with weights given by grey-matter probability Regress out confounds: - movement parameters - CSF and white matter signals - Compcorr: data-driven noise identification [Behzadi 2007] - Global mean... overhyped discussion (see later) G Varoquaux 14
- 25. 3 Connectivity graphs From correlations to connections Functional connectivity: correlation-based statistics G Varoquaux 15
- 26. 3 Correlation, covariance 1 For x and y centered: covariance: cov(x, y) = 1 n i xiyi correlation: cor(x, y) = cov(x, y) std(x) std(y) Correlation is normalized: cor(x, y) ∈ [−1, 1] Quantify linear dependence between x and y Correlation matrix functional connectivity graphs [Bullmore1996, Achard2006...] G Varoquaux 16
- 27. 3 Partial correlation Remove the effect of z by regressing it out x/z = residuals of regression of x on z In a set of p signals, partial correlation: cor(xi/Z, xj/Z), Z = {xk, k = i, j} partial variance: var(xi/Z), Z = {xk, k = i} Partial correlation matrix [Marrelec2006, Fransson2008, ...] G Varoquaux 17
- 28. 3 Inverse covariance K = Matrix inverse of the covariance matrix On the diagonal: partial variance Off diagonal: scaled partial correlation Ki,j = −cor(xi/Z, xj/Z) std(xi/Z) std(xj/Z) Inverse covariance matrix [Smith 2011, Varoquaux NIPS 2010, ...] G Varoquaux 18
- 29. 3 Summary: observations and indirect effects Observations Correlation 0 1 2 3 4 Covariance: scaled by variance Direct connections Partial correlation 0 1 2 3 4 Inverse covariance: scaled by partial variance G Varoquaux 19
- 30. 3 Summary: observations and indirect effects Observations Correlation Direct connections Partial correlation G Varoquaux 19
- 31. 3 Summary: observations and indirect effects Observations Correlation Direct connections Partial correlation Global signal regression Matters less on partial correlations But unspecific, and can make the covariance matrix ill-conditioned G Varoquaux 19
- 32. 3 Inverse covariance and graphical model Gaussian graphical models Zeros in inverse covariance give conditional independence Σ−1 i,j = 0 ⇔ xi, xj independent conditionally on {xk, k = i, j} Robust to the Gaussian assumption G Varoquaux 20
- 33. 3 Partial correlation matrix estimation p nodes, n observations (e.g. fMRI volumes) If not n p2 , ambiguities: (multicolinearity) 0 2 1 0 2 1 0 2 10 2 1 ? ? Thresholding partial correlations does not recover ground truth independence structure G Varoquaux 21
- 34. 3 Inverse covariance matrix estimation Sparse Inverse Covariance estimators: Independence between nodes makes estimation of partial correlation easier 0 1 2 3 4 Independence structure + 0 1 2 3 4 Connectivity values Joint estimation G Varoquaux 22
- 35. 3 Inverse covariance matrix estimation Sparse Inverse Covariance estimators: Independence between nodes makes estimation of partial correlation easier 0 1 2 3 4 Independence structure + 0 1 2 3 4 Connectivity values Joint estimation Group-sparse inverse covariance: learn different connectomes with same independence structure [Varoquaux, NIPS 2010] G Varoquaux 22
- 36. 4 Comparing connectomes Detecting and localizing differences Edge-level tests Network-level tests G Varoquaux 23
- 37. 4 Comparing connectomes Detecting and localizing differences Edge-level tests G Varoquaux 23
- 38. 4 Pair-wise tests on correlations Correlations ∈ [−1, 1] ⇒ cannot apply Gaussian statistics, e.g. T tests Z-transform: Z = arctanh cor = 1 2 ln 1 + cor 1 − cor Z(cor) is normaly-distributed: For n observations, Z(cor) = N Z(cor), 1 √ n G Varoquaux 24
- 39. 4 Indirect effects: to partial or not to partial? 0 5 10 15 20 25 0 5 10 15 20 25 Control 0 5 10 15 20 25 0 5 10 15 20 25 Control 0 5 10 15 20 25 0 5 10 15 20 25 Control 0 5 10 15 20 25 0 5 10 15 20 25Large lesion Correlation matrices 0 5 10 15 20 25 0 5 10 15 20 25 Control 0 5 10 15 20 25 0 5 10 15 20 25 Control 0 5 10 15 20 25 0 5 10 15 20 25 Control 0 5 10 15 20 25 0 5 10 15 20 25Large lesion Partial correlation matrices Spread-out variability in correlation matrices Noise in partial-correlations Strong dependence between coefficients [Varoquaux MICCAI 2010]G Varoquaux 25
- 40. 4 Indirect effects versus noise: a trade off 0 5 10 15 20 25 0 5 10 15 20 25 Control 0 5 10 15 20 25 0 5 10 15 20 25 Control 0 5 10 15 20 25 0 5 10 15 20 25 Control 0 5 10 15 20 25 0 5 10 15 20 25Large lesion Correlation matrices 0 5 10 15 20 25 0 5 10 15 20 25 Control 0 5 10 15 20 25 0 5 10 15 20 25 Control 0 5 10 15 20 25 0 5 10 15 20 25 Control 0 5 10 15 20 25 0 5 10 15 20 25Large lesion Partial correlation matrices 0 5 10 15 20 25 0 5 10 15 20 25 Control 0 5 10 15 20 25 0 5 10 15 20 25 Control 0 5 10 15 20 25 0 5 10 15 20 25 Control 0 5 10 15 20 25 0 5 10 15 20 25Large lesion Tangent-space residuals [Varoquaux MICCAI 2010] G Varoquaux 26
- 41. 0 5 10 15 20 25 0 5 10 15 20 25 0 5 10 15 20 25 0 5 10 15 20 25 0 5 10 15 20 25 0 5 10 15 20 25 Edge-level tests Localization is hard (non-local effects) Multiple testing kills performance G Varoquaux 27
- 42. 0 5 10 15 20 25 0 5 10 15 20 25 0 5 10 15 20 25 0 5 10 15 20 25 0 5 10 15 20 25 0 5 10 15 20 25 Network-level tests Nodes cluster together to form networks G Varoquaux 27
- 43. 4 Network-level metrics Network-wide activity Quantify amount of signal in Σnetwork Determinant: |Σnetwork| = generalized variance Network integration: = log |ΣA| Cross-talk between network A and B Mutual information = log |ΣAB| − log |ΣA| − log |ΣB| [Marrelec 2008, Varoquaux NIPS 2010]G Varoquaux 28
- 44. 4 Pitfalls when comparing connectomes Missing nodes Very correlated nodes: e.g. nearly-overlapping regions Hub nodes give more noisy partial correlations G Varoquaux 29
- 45. Practical connectomics: take home messages Need to choose functionally-relevent regions Regress confounds out from signals Partial correlations to isolate direct effects Networks are interesting units for comparison http://gael-varoquaux.info [NeuroImage 2013]
- 46. References (not exhaustive) [Achard 2006] A resilient, low-frequency, small-world human brain functional network with highly connected association cortical hubs, J Neurosci [Behzadi 2007] A component based noise correction method (CompCor) for BOLD and perfusion based fMRI, NeuroImage [Bullmore 2009] Complex brain networks: graph theoretical analysis of structural and functional systems, Nat Rev Neurosci [Craddock 2011] A Whole Brain fMRI Atlas Generated via Spatially Constrained Spectral Clustering, Hum Brain Mapp [Frasson 2008] The precuneus/posterior cingulate cortex plays a pivotal role in the default mode network: Evidence from a partial correlation network analysis, NeuroImage [Marrelec 2006] Partial correlation for functional brain interactivity investigation in functional MRI, NeuroImage [Marrelec 2008] Regions, systems, and the brain: hierarchical measures of functional integration in fMRI, Med Im Analys
- 47. References (not exhaustive) [Smith 2010] Network Modelling Methods for fMRI, NeuroImage [Smith 2009] Correspondence of the brain’s functional architecture during activation and rest, PNAS [Varoquaux MICCAI 2010] Detection of brain functional-connectivity difference in post-stroke patients using group-level covariance modeling, Med Imag Proc Comp Aided Intervention [Varoquaux NIPS 2010] Brain covariance selection: better individual functional connectivity models using population prior, Neural Inf Proc Sys [Varoquaux 2011] Multi-subject dictionary learning to segment an atlas of brain spontaneous activity, IPMI [Varoquaux 2012] Markov models for fMRI correlation structure: is brain functional connectivity small world, or decomposable into networks?, J Physio Paris [Varoquaux 2013] Learning and comparing functional connectomes across subjects, NeuroImage