How Generative AI Is Transforming Your Business | Byond Growth Insights | Apr...
Walking table
1. July 31 2013
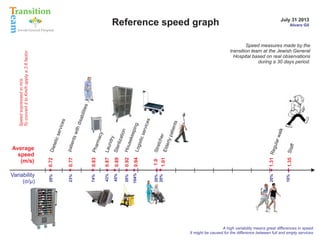
Reference speed graph
Speed measures made by the
transition team at the Jewish General
Hospital based on real observations
during a 30 days period.
1.31 Re
gula
r wa
lk
1.35 Staf
f
20%
16%
nts
tche
r
Elde
rly p
atie
1.01
with
ents
pati
Stre
1.0
20%
20%
104%
20%
45%
0.83 Pha
rma
cy
0.87 Laun
dry
Ste
0.89
riliz
atio
n
Hou
0.92
sek
eep
ing
0.94 Log
istic
serv
ices
74%
43%
0.77
23%
Die
tetic
serv
ices
0.72
20%
Variability
(σ/µ)
disa
bilit
ies
Speed expressed in m/s.
To convert it to Km/h apply a 3.6 factor
Average
speed
(m/s)
Alvaro Gil
A high variability means great differences in speed.
It might be caused for the difference between full and empty services.