1. Ground Water North of Cedar City, Utah in the
Cedar Valley Drainage Basin Halley Barnett
THE GREAT BASIN
The Great Basin Region has the
highest rate of population
growth in the US. It is a large,
semi-arid, cold desert that is
prone to droughts and has
limited water resources
(Chambers et al., 2008). Water
input into this region mainly
comes from the melting of
winter snow from adjacent
mountainous areas (Chambers
et al., 2008). The EPA
estimates that the Great Basin
will warm by 3-6 degrees by
the end of the twenty-first
century (Chambers et al.,
2008). As temperatures continue to increase, the amount of snowmelt will decrease, which will
limit the amount of available water.
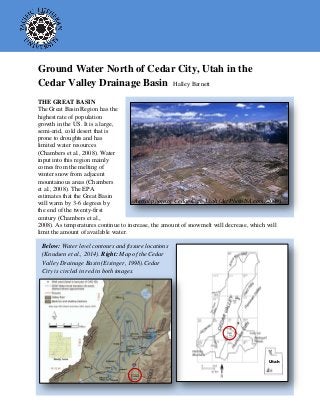
Aerial photo of Cedar City, Utah (AirPhotoNA.com, 2009).
Below: Water level contours and fissure locations
(Knudsen et al., 2014). Right: Map of the Cedar
Valley Drainage Basin (Eisinger, 1998).Cedar
City is circled in red in both images.
Utah
2. CEDAR VALLEY DRAINAGE
BASIN
Within the Great Basin Region, the
Cedar Valley Drainage Basin is a
drainage basin with an area of 580 mi2
(1,502 km2
) in southwestern Utah
between the Basin and Range province
and the Colorado Plateau (Eisinger,
1998). The valley is a graben that was
formed through extension from Miocene
to Quaternary normal faulting that was
subsequently filled with quaternary
alluvium eroded from adjacent horsts and
volcanic deposits (Eisinger, 1998;
Brooks and Mason, 2005).
The basin sees eight to fourteen inches of
precipitation annually along with
moderately cold winters and warm, dry
summers (Eisinger, 1998). Several
smaller grabens exist within the larger
graben, including the Enoch-graben-west
fault (Knudsen et al., 2014).
WATER RECHARGE AND DISCHARGE
Recharge comes from seepage from perennial streams and springs, seepage from irrigation,
infiltration from precipitation, and subsurface inflow from consolidated rock (Eisinger, 1998;
Brooks and Mason, 2005). The majority of discharge comes from well pumping and has
increased at a rate of about 600 acre-ft per year since 1964 (Eisinger 1998, Knudsen et al., 2014).
As water levels decline, land subsidence occurs in this graben as sediments are compacted and
fissures form (Knudsen et al., 2014). Fissures increase the permeability of the land surface,
Top: Sprinkler
System (Google
Earth, 2015).
Left: Road damage
due to the EGWF1
fissure at the
intersection of
5700N and 850E
(Knudsen et al.,
2014).
WATER STORAGE
Alluvial fill forms the dominant aquifer
in the region and consists of sand, gravel,
clay, and silt with many highly
permeable beds (Eisinger, 1998). Quartz
monzonite, volcanic rocks, and Navajo
Sandstone are consolidated rocks known
to provide water to wells (Brooks and
Mason, 2005). Unconfined aquifers in
this basin exist in coarse, unsorted sand
and gravel, and confined aquifers exist in
the middle of the basin where there are
discontinuous lenses of impermeable
clay or silt (Brooks and Mason, 2005).
Groundwater flows northwest (Brooks
and Mason, 2005).
Cross-section north of Cedar City. This area shows
characteristics of extension and basin fill and there are
several faults running through the area (Hurlow, 2002).
3. which increases the
ease at which runoff
from will infiltrate
into the groundwater
system. Agricultural
production is an
important part of the
economy in the Cedar
City area (Knudsen et
al., 2014). The
majority of irrigation
in 1992 and 1993
came from flood
irrigation, but the
majority in 2000 came
from center-pivot
sprinkler irrigation
(Brooks and Mason,
2005). Water is also
often diverted through
canals and ditches or
released into the
atmosphere through
evapotranspiration
(Brooks and Mason,
2005).
Evapotranspiration for
2000 is estimated at
3,000 acre-ft (Brooks
and Mason, 2005).
WATER QUALITY
Well water was used for irrigation and livestock and municipal water came from springs from
consolidated rocks in the mountains before the 1960s (Brooks and Mason, 2005). Effluent from
waste-water treatment facilities has been used for field irrigation since 1976 (Brooks and Mason,
2005). Increasing population forced the city to rely more on groundwater for summer lawn
watering and public water supply (Brooks and Mason, 2005). Dissolved solids range from 158 to
2752 mg/L with the majority being nitrate (Eisinger, 1998). This nitrate comes from deeper wells
that extend to older basin fills rich in more soluble salts (Knudsen et al., 2014). Pollution comes
mainly from septic tanks, fertilizer, and sewage lagoons (Eisinger, 1998).
WATER RESOURCES AND FISSURES
Cedar City and Enoch receive water from wells that collectively produce about 3000 acre-ft per
year (Knudsen et al., 2014). Discharge in this basin has been greater than recharge since 1939,
and the estimated storage decrease is estimated at 10,700 acre-ft for 2000 (Knudsen et al., 2014).
Earth fissures increase the rate of infiltration of water and pollutants into the groundwater system
(Knudsen et al., 2014). As fissures form through roads and livestock areas, potential for
groundwater pollution increases (Knudsen et al., 2014). Increasing water resources may be
The direction of groundwater flow has remained mostly constant
since at least 1974 (Brooks and Mason, 2005). Wells had stopped
flowing (without pumping) from the lowering of the water table by
1975 and confined pressures were not strong enough for flowing
wells (Brooks and Mason, 2005).Water-level altitude contours show
a lowering of the water table around Cedar City, which is a
relatively highly-populated area.
4. accomplished by importing water from other basins and injecting it into the groundwater system
in locations where infiltration rates are high, moving the high-discharge wells that populations
rely on, and/or withdrawing less water (Knudsen et al., 2014).The most extensive fissures have
been the Enoch-graben-west fissures, which are extending southward (Knudsen et al., 2014).
REFERENCES
AirPhoto (2009). Cedar City: Iron County, Utah, UT United States. Image #13295.
http://www.airphotona.com/image.asp?imageid=13051&catnum=0&catname=All%20Categories&keywor
d=&country=&state=&pagenum=229
Brooks, L. E. and Mason, J. L. (2005). Hydrology and Simulation of Ground-Water Flow in Cedar Valley, Iron
County, Utah. US Geological Survey. Salt Lake City, Utah. Scientific Investigations Report 2005-5170.
Chambers, J. C.; Devoe, N.; and Evended, A. (2008). Collaborative Management and Reasearch in the Great Basin –
Examining the Issues and Developing a Framework for Action. Gen. Tech. Rep. RMRS-GTR-204. Fort
Collins, CO: US Department of Agriculture, Forest Service, Rocky Mountain Research Station. 66 p.
Eisinger, C. (1998). A Summary of the Geology and Hydrogeology of the Cedar Valley Drainage Basin, Iron
County, Utah. Utah Geological Survey. Open-File Report 360.
Hurlow, H.A., 2002, The geology of Cedar Valley, Iron County, Utah and its relation to ground-water conditions:
Utah Geological Survey Special Study 103.
Knudsen, T.; Inkenbrandt, P.; Lund, W.; Lowe, M.; and Bowman, S. (2014). “Investigation of Land Subsidence and
Earth Fissures in Cedar Valley, Iron County, Utah.” Utah Geological Survey Special Study 150.
Google Earth (2015). Cedar City, Utah.
Water Quality of the Cedar Valley Drainage Basin (Brooks and Mason, 2005).