hanall biopharma 009420 Algorithm Investment Report
•
0 likes•44 views

hanall biopharma 009420 Algorithm Investment Report
![[Price for scheduled purchasing]
Arbitrarily made
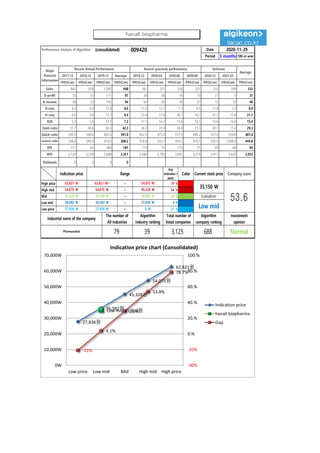
Algorithm stocks Trading Strategies (consolidated) 009420 Date
Period
Gap
(Indication /
stock)
Color
2020-11-29
3 months
Current stock price Evaluation
Stock price rise
probability score
Investment opinion Prospective purchase amount
35,150 W Low mid 56.6 Normal 8,800,000 W
Suggested Purchase
Amount 4,188,538 W
Number of stocks
purchased 119
Indication price Range Buying / Selling Buying / Selling [Stocks]
High price 62,821 W 62,821 W~ ~ 54,075 W 79 % -3,297,290 W -52
High mid 54,075 W 54,075 W ~ 45,328 W 54 % -2,255,083 W -42
Mid 45,328 W 45,328 W ~ 36,582 W 29 % -1,212,875 W -27
Low mid 36,582 W 36,582 W ~ 27,836 W 4 % -170,668 W -5
low price 27,836 W 27,836 W ~ 0 W -21 % 871,539 W 31
Stock price rise
probability score
A Sector 46.9 50.4 51.2 43.3 47.1 49.4
56.6B Sector 40.4 20.4 21.7 43.3 37.5 35.0
Total average
2020.07.03 2020.07.31 2020.08.31 2020.09.28 2020.10.30 2020.11.27
43.7 35.4 36.4 37.1 42.3 42.2
12 % -0 %
2020.07.31 2020.08.31 2020.09.28 2020.10.30 2020.11.27
Total of
increase rate
Total score
A Sector 7 % 2 % -18 % 8 % 5 %
-1 % 46.0B Sector -98 % 6 % 50 % -16 % -7 %
Total average -23 % 3 % 2 %
47
50 51
43
47 49
40
20 22
43
38 35
44
35 36 37
42 42
0
10
20
30
40
50
60
2020.07.03 2020.07.31 2020.08.31 2020.09.28 2020.10.30 2020.11.27
Stock price rise probability score
A sector
B sector
Total average
7% 2%
-18%
8% 5%
-98%
6%
50%
-16% -7%
-23%
3% 2%
12%
-0%
-150%
-100%
-50%
0%
50%
100%
2020.07.31 2020.08.31 2020.09.28 2020.10.30 2020.11.27
Increase rate of stock price rise
A sector
B sector
Total average
hanall biopharma](data:image/gif;base64,R0lGODlhAQABAIAAAAAAAP///yH5BAEAAAAALAAAAAABAAEAAAIBRAA7)
Recommended
Recommended
More Related Content
What's hot
What's hot (20)
Similar to hanall biopharma 009420 Algorithm Investment Report
Similar to hanall biopharma 009420 Algorithm Investment Report (16)
More from 알고리즘 기업분석 컨설팅-알기컨,algikeon
More from 알고리즘 기업분석 컨설팅-알기컨,algikeon (20)
Recently uploaded
Recently uploaded (20)
hanall biopharma 009420 Algorithm Investment Report
- 1. Performance Analysis of Algorithm (consolidated) 009420 Date Period 3 months 100-m won 2017.12 2018.12 2019.12 Average 2019.12 2020.03 2020.06 2020.09 2020.12 2021.03 IFRS(Con) IFRS(Con) IFRS(Con) IFRS(Con) IFRS(Con) IFRS(Con) IFRS(Con) IFRS(Con) IFRS(Con) IFRS(Con) IFRS(Con) Sales 842 918 1,085 948 261 221 226 221 232 199 232 O-profit 35 55 171 87 30 28 16 10 27 5 21 N-income 58 33 192 94 62 39 59 37 72 32 49 O-rate 4.2 6.0 15.8 8.6 11.5 12.7 7.1 4.5 11.6 2.5 8.9 N-rate 6.9 3.6 17.7 9.4 23.8 17.6 26.1 16.7 31.2 15.8 21.1 ROE 5.2 2.8 13.7 7.2 17.7 14.2 15.6 14.1 15.6 14.0 15.4 Debt-ratio 51.7 38.8 36.3 42.3 36.3 31.4 26.0 23.3 20.1 17.4 29.3 Quick-ratio 230.9 509.6 432.5 391.0 432.5 475.9 517.5 498.2 527.4 559.8 481.0 reserve-ratio 336.8 349.0 418.8 368.2 418.8 433.7 456.3 470.5 592.5 1,088.0 444.8 EPS 111 63 368 181 119 75 113 71 99 60 94 BPS 2,129 2,238 2,688 2,351 2,688 2,783 3,001 3,218 3,417 3,629 2,923 Dividends 0 0 0 0 2020-11-29 Major Financial Information Recent Annual Performance Recent quarterly performance Estimate Average Gap (Indication / stock) Color High price ~ 79 % High mid ~ 54 % Mid ~ 29 % Low mid ~ 4 % Low price ~ -21 % Indication price Range Current stock price Company score 54,075 W 54,075 W 45,328 W 45,328 W 45,328 W 36,582 W Evaluation 62,821 W 62,821 W~ 54,075 W 35,150 W 53.636,582 W 36,582 W 27,836 W Low mid Normal 27,836 W 27,836 W 0 W Industrial name of the company The number of All industries Algorithm Industry ranking Total number of listed companies Algorithm company ranking Investment opinion Pharmaceutical 79 39 3,125 688 27,836원 36,582원 45,328원 54,075원 62,821원 Low mid 35,150원 -21% 4.1% 29.% 53.8% 78.7% -40% -20% 0.% 20.% 40.% 60.% 80.% 100.% 0W 10,000W 20,000W 30,000W 40,000W 50,000W 60,000W 70,000W Low price Low mid Mid High mid High price Indication price chart (Consolidated) Indication price hanall biopharma Gap hanall biopharma
- 2. [Price for scheduled purchasing] Arbitrarily made Algorithm stocks Trading Strategies (consolidated) 009420 Date Period Gap (Indication / stock) Color 2020-11-29 3 months Current stock price Evaluation Stock price rise probability score Investment opinion Prospective purchase amount 35,150 W Low mid 56.6 Normal 8,800,000 W Suggested Purchase Amount 4,188,538 W Number of stocks purchased 119 Indication price Range Buying / Selling Buying / Selling [Stocks] High price 62,821 W 62,821 W~ ~ 54,075 W 79 % -3,297,290 W -52 High mid 54,075 W 54,075 W ~ 45,328 W 54 % -2,255,083 W -42 Mid 45,328 W 45,328 W ~ 36,582 W 29 % -1,212,875 W -27 Low mid 36,582 W 36,582 W ~ 27,836 W 4 % -170,668 W -5 low price 27,836 W 27,836 W ~ 0 W -21 % 871,539 W 31 Stock price rise probability score A Sector 46.9 50.4 51.2 43.3 47.1 49.4 56.6B Sector 40.4 20.4 21.7 43.3 37.5 35.0 Total average 2020.07.03 2020.07.31 2020.08.31 2020.09.28 2020.10.30 2020.11.27 43.7 35.4 36.4 37.1 42.3 42.2 12 % -0 % 2020.07.31 2020.08.31 2020.09.28 2020.10.30 2020.11.27 Total of increase rate Total score A Sector 7 % 2 % -18 % 8 % 5 % -1 % 46.0B Sector -98 % 6 % 50 % -16 % -7 % Total average -23 % 3 % 2 % 47 50 51 43 47 49 40 20 22 43 38 35 44 35 36 37 42 42 0 10 20 30 40 50 60 2020.07.03 2020.07.31 2020.08.31 2020.09.28 2020.10.30 2020.11.27 Stock price rise probability score A sector B sector Total average 7% 2% -18% 8% 5% -98% 6% 50% -16% -7% -23% 3% 2% 12% -0% -150% -100% -50% 0% 50% 100% 2020.07.31 2020.08.31 2020.09.28 2020.10.30 2020.11.27 Increase rate of stock price rise A sector B sector Total average hanall biopharma
- 3. 정보와 완전 정보 결 투자판단 있습니 위배 무단으 숙지하 Compliance notice ① The information provided by The Algorithm Company Analysis Consulting is obtained through reliable data and information and The Algorithm Company Analysis Program (TACAP), but its accuracy or completeness are not guaranteed. Furthermore, it may change over time.Therefore, we are not legally responsible for the results of the data provided by The Algorithm Company Analysis Consulting because of information errors or omissions. ② The Algorithm Company Analysis Consulting and all the information provided on it site are reference materials for investment decisions and the final responsibility of investment is up to users utilizing this information. ③ The Algorithm Company Analysis Consulting and its site do not do anything that violates the related laws such as discretionary transaction. ④ Users can not reallocate and recycle the information provided by The Algorithm Company Analysis Consulting firm let alone the information provided by its Site. ⑤ Be sure to know about application period of this algorithm analysis report in order to improve its accuracy. Tel : 070 - 4667 - 5009 Email : tacac@tacac.co.kr Homepage : tacac.co.kr Blog : tacac.blog.me SERVICES M&A, IPO, RECOVER, CORPORATE RESTRUCTURING, MANAGEMENT OF TECHNOLOGY, BUSINESS STRATEGY, FAMILY BUSINESS Request : http://tacac.co.kr/?page_id=1374 ① Consulting is o The Algorithm accuracy or com change over tim results of the d Consulting bec ② information pr investment dec up ③ do anything th transaction. ④ The Algorithm information pr ⑤ analysis report