hanwha 000880 Algorithm Investment Report
•
0 likes•183 views

hanwha 000880 Algorithm Investment Report
![[Price for scheduled purchasing]
Arbitrarily made
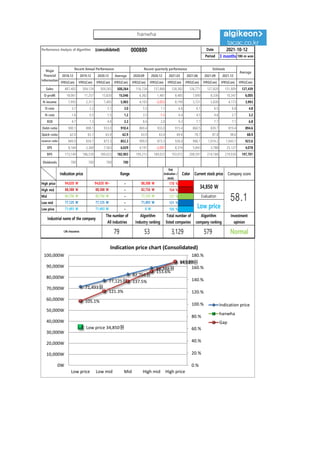
Algorithm stocks Trading Strategies (consolidated) 000880 Date
Period
Gap
(Indication /
stock)
Color
low price 71,493 W 71,493 W ~ 0 W 105 % -5,667,244 W All selling
Low mid 77,125 W 77,125 W ~ 71,493 W 121 % -6,538,241 W All selling
Mid 82,756 W 82,756 W ~ 77,125 W 137 % -7,409,237 W All selling
High mid 88,388 W 88,388 W ~ 82,756 W 154 % -8,280,233 W All selling
Suggested Purchase
Amount 5,389,934 W
Number of stocks
purchased 155
Indication price Range Buying / Selling Buying / Selling [Stocks]
High price 94,020 W 94,020 W~ ~ 88,388 W 170 % -9,151,229 W All selling
2021-10-12
3 months
Current stock price Evaluation
Stock price rise
probability score
Investment opinion Prospective purchase amount
34,850 W Low price 60.0 Normal 10,000,000 W
38.6 43.3 48.2 42.5 44.6 45.7
2021.05.13 2021.06.11 2021.07.09 2021.08.06 2021.09.06 2021.10.08
Stock price rise
probability score
A Sector 45.2 50.8 45.6 44.0 51.8 47.7
60.0
B Sector 32.1 35.8 50.8 44.0 37.5 43.8
Total average
2021.07.09 2021.08.06 2021.09.06 2021.10.08
Total of
increase rate
Total score
A Sector 11 % -11 % -4 % 15 % -8 %
3 % 50.0
B Sector 10 % 30 % -16 % -17 % 14 %
Total average 11 % 10 % -13 % 5 % 2 %
2021.06.11
45
51
46 44
52
48
32
36
51
44
38
44
39
43
48
43 45 46
0
10
20
30
40
50
60
2021.05.13 2021.06.11 2021.07.09 2021.08.06 2021.09.06 2021.10.08
Stock price rise probability score
A sector
B sector
Total average
11%
-11%
-4%
15%
-8%
10%
30%
-16% -17%
14%
11% 10%
-13%
5%
2%
-20%
-10%
0%
10%
20%
30%
40%
2021.06.11 2021.07.09 2021.08.06 2021.09.06 2021.10.08
Increase rate of stock price rise
A sector
B sector
Total average
hanwha](data:image/gif;base64,R0lGODlhAQABAIAAAAAAAP///yH5BAEAAAAALAAAAAABAAEAAAIBRAA7)
Recommended
Recommended
More Related Content
What's hot
What's hot (20)
Similar to hanwha 000880 Algorithm Investment Report
Similar to hanwha 000880 Algorithm Investment Report (20)
More from 알고리즘 기업분석 컨설팅-알기컨,algikeon
More from 알고리즘 기업분석 컨설팅-알기컨,algikeon (20)
Recently uploaded
Recently uploaded (20)
hanwha 000880 Algorithm Investment Report
- 1. Performance Analysis of Algorithm (consolidated) 000880 Date Period 3 months 100-m won 2018.12 2019.12 2020.12 Average 2020.09 2020.12 2021.03 2021.06 2021.09 2021.12 IFRS(Con) IFRS(Con) IFRS(Con) IFRS(Con) IFRS(Con) IFRS(Con) IFRS(Con) IFRS(Con) IFRS(Con) IFRS(Con) IFRS(Con) Sales 487,402 504,124 509,265 500,264 116,724 137,880 128,382 126,771 127,820 151,809 127,439 O-profit 18,061 11,257 15,820 15,046 6,362 1,481 8,485 7,690 8,336 10,347 6,005 N-income 7,993 2,311 7,405 5,903 4,103 -2,053 8,199 5,721 5,830 4,173 3,993 O-rate 3.7 2.2 3.1 3.0 5.5 1.1 6.6 6.1 6.5 6.8 4.8 N-rate 1.6 0.5 1.5 1.2 3.5 -1.5 6.4 4.5 4.6 2.7 3.2 ROE 4.7 1.3 4.0 3.3 8.4 2.0 9.2 7.7 7.7 7.1 6.8 Debt-ratio 900.1 898.1 933.0 910.4 869.4 933.0 915.4 860.5 839.7 819.4 894.6 Quick-ratio 62.0 63.1 63.4 62.9 63.9 63.4 69.6 78.7 87.8 98.6 68.9 reserve-ratio 849.0 834.7 873.3 852.3 909.0 873.3 926.0 986.1 1,014.2 1,043.1 923.6 EPS 8,164 2,360 7,563 6,029 4,191 -2,097 8,374 5,843 3,788 25,127 4,078 BPS 173,149 186,539 189,023 182,903 199,215 189,023 193,972 208,597 214,188 219,930 197,701 Dividends 700 700 700 700 Major Financial Information Recent Annual Performance Recent quarterly performance Estimate Average 2021-10-12 Gap (Indication / stock) Color High price ~ 170 % High mid ~ 154 % Mid ~ 137 % Low mid ~ 121 % Low price ~ 105 % Normal 71,493 W 71,493 W 0 W Industrial name of the company The number of All industries Algorithm Industry ranking Total number of listed companies Algorithm company ranking Investment opinion Life insurance 79 53 3,129 579 88,388 W 88,388 W 82,756 W 82,756 W 82,756 W 77,125 W Evaluation 94,020 W 94,020 W~ 88,388 W 34,850 W 58.1 77,125 W 77,125 W 71,493 W Low price Indication price Range Current stock price Company score 71,493원 77,125원 82,756원 88,388원 94,020원 Low price 34,850원 105.1% 121.3% 137.5% 153.6% 169.8% 0.% 20.% 40.% 60.% 80.% 100.% 120.% 140.% 160.% 180.% 0W 10,000W 20,000W 30,000W 40,000W 50,000W 60,000W 70,000W 80,000W 90,000W 100,000W Low price Low mid Mid High mid High price Indication price chart (Consolidated) Indication price hanwha Gap hanwha
- 2. [Price for scheduled purchasing] Arbitrarily made Algorithm stocks Trading Strategies (consolidated) 000880 Date Period Gap (Indication / stock) Color low price 71,493 W 71,493 W ~ 0 W 105 % -5,667,244 W All selling Low mid 77,125 W 77,125 W ~ 71,493 W 121 % -6,538,241 W All selling Mid 82,756 W 82,756 W ~ 77,125 W 137 % -7,409,237 W All selling High mid 88,388 W 88,388 W ~ 82,756 W 154 % -8,280,233 W All selling Suggested Purchase Amount 5,389,934 W Number of stocks purchased 155 Indication price Range Buying / Selling Buying / Selling [Stocks] High price 94,020 W 94,020 W~ ~ 88,388 W 170 % -9,151,229 W All selling 2021-10-12 3 months Current stock price Evaluation Stock price rise probability score Investment opinion Prospective purchase amount 34,850 W Low price 60.0 Normal 10,000,000 W 38.6 43.3 48.2 42.5 44.6 45.7 2021.05.13 2021.06.11 2021.07.09 2021.08.06 2021.09.06 2021.10.08 Stock price rise probability score A Sector 45.2 50.8 45.6 44.0 51.8 47.7 60.0 B Sector 32.1 35.8 50.8 44.0 37.5 43.8 Total average 2021.07.09 2021.08.06 2021.09.06 2021.10.08 Total of increase rate Total score A Sector 11 % -11 % -4 % 15 % -8 % 3 % 50.0 B Sector 10 % 30 % -16 % -17 % 14 % Total average 11 % 10 % -13 % 5 % 2 % 2021.06.11 45 51 46 44 52 48 32 36 51 44 38 44 39 43 48 43 45 46 0 10 20 30 40 50 60 2021.05.13 2021.06.11 2021.07.09 2021.08.06 2021.09.06 2021.10.08 Stock price rise probability score A sector B sector Total average 11% -11% -4% 15% -8% 10% 30% -16% -17% 14% 11% 10% -13% 5% 2% -20% -10% 0% 10% 20% 30% 40% 2021.06.11 2021.07.09 2021.08.06 2021.09.06 2021.10.08 Increase rate of stock price rise A sector B sector Total average hanwha
- 3. 정보와 완전 정보 결 투자판단 있습니 위배 무단으 숙지하 Compliance notice ① The information provided by The Algorithm Company Analysis Consulting is obtained through reliable data and information and The Algorithm Company Analysis Program (TACAP), but its accuracy or completeness are not guaranteed. Furthermore, it may change over time.Therefore, we are not legally responsible for the results of the data provided by The Algorithm Company Analysis Consulting because of information errors or omissions. ② The Algorithm Company Analysis Consulting and all the information provided on it site are reference materials for investment decisions and the final responsibility of investment is up to users utilizing this information. ③ The Algorithm Company Analysis Consulting and its site do not do anything that violates the related laws such as discretionary transaction. ④ Users can not reallocate and recycle the information provided by The Algorithm Company Analysis Consulting firm let alone the information provided by its Site. ⑤ Be sure to know about application period of this algorithm analysis report in order to improve its accuracy. Tel : 070 - 4667 - 5009 Email : tacac@tacac.co.kr Homepage : tacac.co.kr Blog : tacac.blog.me SERVICES M&A, IPO, RECOVER, CORPORATE RESTRUCTURING, MANAGEMENT OF TECHNOLOGY, BUSINESS STRATEGY, FAMILY BUSINESS Request : http://tacac.co.kr/?page_id=1374 ① Consulting is o The Algorithm accuracy or com change over tim results of the d Consulting bec ② information pr investment dec up ③ do anything th transaction. ④ The Algorithm information pr ⑤ analysis report