Study the Effect of Different SHPB Test Parameters Using Numerical Simulation Technique

The document summarizes a numerical simulation study of the split Hopkinson pressure bar (SHPB) test, which is commonly used to characterize materials under high strain rates. A finite element model of the SHPB system is developed and validated against previous results. Parametric studies are conducted to analyze the effects of striker bar length and velocity, foam material models, mesh properties, and other parameters on the wave propagation behavior. The studies aim to optimize test parameters and reduce repetitive physical testing. In general, longer striker bars increase wave duration, higher velocities increase wave amplitude, and finer meshes reduce oscillations compared to coarser meshes. Material models show little effect on wave profiles for the foam studied.

Recommended
More Related Content
What's hot
What's hot (20)
Viewers also liked
Viewers also liked (20)
Similar to Study the Effect of Different SHPB Test Parameters Using Numerical Simulation Technique
Similar to Study the Effect of Different SHPB Test Parameters Using Numerical Simulation Technique (20)
More from IJMER
More from IJMER (20)
Recently uploaded
Recently uploaded (20)
Study the Effect of Different SHPB Test Parameters Using Numerical Simulation Technique
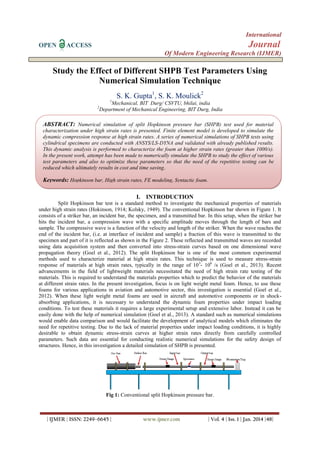
- 1. International OPEN Journal ACCESS Of Modern Engineering Research (IJMER) Study the Effect of Different SHPB Test Parameters Using Numerical Simulation Technique S. K. Gupta1, S. K. Moulick2 1 Mechanical, BIT Durg/ CSVTU, bhilai, india Department of Mechanical Engineering, BIT Durg, India 2 ABSTRACT: Numerical simulation of split Hopkinson pressure bar (SHPB) test used for material characterization under high strain rates is presented. Finite element model is developed to simulate the dynamic compression response at high strain rates. A series of numerical simulations of SHPB tests using cylindrical specimens are conducted with ANSYS/LS-DYNA and validated with already published results. This dynamic analysis is performed to characterize the foam at higher strain rates (greater than 1000/s). In the present work, attempt has been made to numerically simulate the SHPB to study the effect of various test parameters and also to optimize these parameters so that the need of the repetitive testing can be reduced which ultimately results in cost and time saving. Keywords: Hopkinson bar, High strain rates, FE modeling, Syntactic foam. I. INTRODUCTION Split Hopkinson bar test is a standard method to investigate the mechanical properties of materials under high strain rates (Hokinson, 1914; Kolsky, 1949). The conventional Hopkinson bar shown in Figure 1. It consists of a striker bar, an incident bar, the specimen, and a transmitted bar. In this setup, when the striker bar hits the incident bar, a compression wave with a specific amplitude moves through the length of bars and sample. The compressive wave is a function of the velocity and length of the striker. When the wave reaches the end of the incident bar, (i.e. at interface of incident and sample) a fraction of this wave is transmitted to the specimen and part of it is reflected as shown in the Figure 2. These reflected and transmitted waves are recorded using data acquisition system and then converted into stress-strain curves based on one dimensional wave propagation theory (Goel et al., 2012). The split Hopkinson bar is one of the most common experimental methods used to characterize material at high strain rates. This technique is used to measure stress-strain response of materials at high strain rates, typically in the range of 10 3- 106 /s (Goel et al., 2013). Recent advancements in the field of lightweight materials necessitated the need of high strain rate testing of the materials. This is required to understand the materials properties which to predict the behavior of the materials at different strain rates. In the present investigation, focus is on light weight metal foam. Hence, to use these foams for various applications in aviation and automotive sector, this investigation is essential (Goel et al., 2012). When these light weight metal foams are used in aircraft and automotive components or in shockabsorbing applications, it is necessary to understand the dynamic foam properties under impact loading conditions. To test these materials it requires a large experimental setup and extensive labor. Instead it can be easily done with the help of numerical simulation (Goel et al., 2013). A standard such as numerical simulations would enable data comparison and would facilitate the development of analytical models which eliminates the need for repetitive testing. Due to the lack of material properties under impact loading conditions, it is highly desirable to obtain dynamic stress-strain curves at higher strain rates directly from carefully controlled parameters. Such data are essential for conducting realistic numerical simulations for the safety design of structures. Hence, in this investigation a detailed simulation of SHPB is presented. Fig 1: Conventional split Hopkinson pressure bar. | IJMER | ISSN: 2249–6645 | www.ijmer.com | Vol. 4 | Iss. 1 | Jan. 2014 |48|
- 2. Study the Effect of Different SHPB Test Parameters Using Numerical Simulation Technique Fig 2: Wave propagation in SHPB. II. NUMERICAL SIMULATION The finite element code LS-DYNA is employed to model and analyze the SHPB test setup. A three dimensional model is developed to simulate the SHPB system. Several numerical simulations are carried to study the effect of the various parameters on SHPB measurements. Both incident and transmitter bar are modeled with a radius of 11 mm and a length of 1 m. whereas the specimen is 14 mm in diameter and 7 mm in length. Instead of modeling a striker bar, the stress wave pulse corresponding to striker length and velocity is directly applied at the end of the incident bar. The bars are modeled as elastic materials with density ρ = 1190 kg/m3, Young’s Modulus E = 3.4 GPa and Poisson’s ratio υ = 0.35. The foam specimen properties are ρ = 270 kg/m 3, Young’s Modulus E = 1.1 GPa and plastic Poisson’s ratio υ = 0. Figure 3 shows the typical quasi-static stress strain curve of the metal foam used in the present investigation. The finite element model includes the incident bar, specimen and the transmitted bar. Figure 4 (a) shows the finite element model for SHPB used in LS-DYNA. Smoothened Curve 16 Experimental Curve Nominal Stress, (MPa) 14 12 10 8 6 4 2 0 0.0 0.1 0.2 0.3 0.4 0.5 0.6 0.7 0.8 Nominal Strain, 2.1 Assumptions The incident, transmission, and the striker bar remain elastic during the testing. Wave propagation within the pressure bar is one-dimensional. Specimen undergoes homogeneous deformation. 2.2 Formulation d s (t ) 2C 0 R (t ) dt L s (t ) 2C0 t R (t )dt L 0 s (t ) E | IJMER | ISSN: 2249–6645 | A0 T (t ) A www.ijmer.com | Vol. 4 | Iss. 1 | Jan. 2014 |49|
- 3. Study the Effect of Different SHPB Test Parameters Using Numerical Simulation Technique where, C0= Wave propagation Velocity. L= Length of the pressure Bar. A0 = Cross sectional Area. T (t ) =Transmitted strain. R (t ) = Reflected strain. An assembly containing all parts (bars and specimen) is modeled using three dimensional solid constant stress element (LS DYNA). The bars have 90 elements in their cross section and 80 along the length, whereas the specimen has 300 elements and 7 mm along the length. Structured meshing is applied in both the bars with a little refinement in mesh of the specimen. The butterfly mesh configuration in LS-DYNA has been considered for modeling. Mesh configuration of the metal foam specimen is shown in Figure 4 (b), whereas Figure 4 (a) presents a detail of the model assembly in the region of contact between the specimen and both the bars. The effect of the meshing is also been discussed in the later part of the paper. The surface in contact is defined as frictionless. The contact between the bars and the specimen are defined as automatic surface to surface (LS-DYNA). Initial boundary conditions are applied to the input bars and specimen such that only movement in one direction is allowed. The end of output bars is constrained. Foam Specimen Incident Bar Output Bar (a) (b) Fig 4 (a): Detail of the model assembly in the region of contact between the specimen and bars, 4 (b): Mesh configuration of the metal foam specimen. III. MODEL VALIDATION This section presents the validation of the numerical scheme with already published results. This is presented to show that the numerical simulation technique used in the present investigation is valid and accurate. For validation purpose, results reported by Irausquín et al. (2010) are used. In the present investigation, the SHPB bar and specimen geometry are exactly same as those reported by Irausquín et al. (2010). The Figure 5 shows the results obtained from the present simulation of SHPB using LS-DYNA and those reported by Irausquín et al. (2010). It can be observed that the results are in good agreement with the results reported by Irausquín et al. (2010), hence validating the present FE approach. 0.003 Irausquín et al., 2010) Present Simulation in LS DYNA Effective Plastic Strain 0.002 0.001 0.000 -0.001 -0.002 -0.003 0.0000 0.0002 0.0004 0.0006 0.0008 0.0010 Time (s) Fig 5: Validation of the present numerical scheme with the results reported by Irausquín et al., 2010 | IJMER | ISSN: 2249–6645 | www.ijmer.com | Vol. 4 | Iss. 1 | Jan. 2014 |50|
- 4. Study the Effect of Different SHPB Test Parameters Using Numerical Simulation Technique IV. RESULT AND DISCUSSIONS Present investigation is carried with an aim of studying the effect of different SHPB test parameters on the wave propagation in metal foam and also to predict the optimal value of these parameters which governs the numerical simulation of SHPB. Figure 6 shows the typical incident reflected and transmitted wave time history obtained from numerical simulation. There are several aspects about the split Hopkinson pressure bar that can be varied in order to test different materials. Out of these many parameters, there are two parameters (i.e. the striker bar length and velocity) those have a significant impact on the split Hopkinson pressure bar results. Incident and Reflected Wave Transmitted Wave 0.0008 Effective Plastic Strain Incident Wave 0.0004 Transmitted Wave 0.0000 -0.0004 Reflected Wave -0.0008 0.0002 0.0004 0.0006 0.0008 0.0010 0.0012 0.0014 Time (s) Fig 6: Incident reflected and transmitted wave obtained from simulation. 4.1. Effect of Length of Striker Bar Figure 7 shows the effect of length of striker bar on the reflected and transmitted wave for three different striker lengths. It can be observed that as the striker length increases, the wave duration also increases. The trend of striker bar length to wave duration is linear. This shows that the wave duration is proportional to striker bar length. However, with the increase in length of striker, the peak pulse is unaffected for the scenario considered in the present investigation. Effective Plastic Strain 0.0010 Projectile 300 mm Projectile 200 mm Projectile 300 mm Projectile 500 mm 0.0005 Projectile 500 mm 0.0000 Projectile 200 mm -0.0005 -0.0010 0.0000 0.0005 0.0010 0.0015 Time (s) Fig 7: Effect on the wave pulse with different striker length. 4.2 Effect of Striker bar Velocity Figure 8 shows the effect of striker velocity on the incident and reflected wave. It can be observed from the results that the amplitude of the wave is directly proportional to the striker bar velocity as the velocity increase the amplitude of the wave increases for the parameters considered in the present investigation. It can also be seen that there is little variation in amplitude in case of 12 m/s and 18 m/s as compared to the amplitude of 9 m/s and 25 m/s obtained from simulation. Hence, striker velocities govern the peak pulse | IJMER | ISSN: 2249–6645 | www.ijmer.com | Vol. 4 | Iss. 1 | Jan. 2014 |51|
- 5. Study the Effect of Different SHPB Test Parameters Using Numerical Simulation Technique 0.003 Velocity 25 m/s Velocity 18 m/s Velocity 12 m/s Velocity 9 m/s Velocity 25 m/s Velocity 18 m/s Effective Plastic Strain 0.002 Velocity 12 m/s 0.001 Velocity 9 m/s 0.000 -0.001 -0.002 -0.003 0.0000 0.0004 0.0008 0.0012 Time (s) Fig 8: Incident and reflected wave of input bar with different striker bar velocity. 4.3 Effect on the Wave with Different Foam Material Models Selecting a material model is a complex task as it requires in-depth knowledge of the behavior of the materials. However, this is not always possible in case of newly developed materials. A wide variety of material models are available for different types of foams in LS DYNA proposed by different researchers (LS DYNA). Some of these are designed to capture the important characteristics for particular types of foams and may not be applicable to other type of foam. Hence, it becomes important to understand these material models before applying them to newly developed foam materials. Furthermore, it is important to reproduce these behaviors in simulation; an effort must be made to calibrate such material models for the best results. Hence effective choice must be made while selective the material model depending upon the types of the materials to be used. Two material model MAT- 63 Crushable Foam Material Model and MAT 154 - Deshpande and Fleck Foam Model is considered in the present investigation which incorporates the effect of the strain rate (LS-DYNA). Figure 9 shows the effect of the different material model on the incident and reflected wave of the input bar. It can be seen from this figure that there is little variation in the wave pulse while considering the different material model. Hence, for modeling the present foam material either of the material models available in LS DYNA can be used. MAT-Crushable Foam MAT-Deshpande and Fleck Effective Plastic Strain 0.0008 0.0004 0.0000 -0.0004 -0.0008 0.0000 0.0004 0.0008 0.0012 Time (s) Fig 9: Effect of different material models on the incident and reflected wave of input bar. 4.4 Effect of the Modeling Parameters on the Waves Figure 10 (a) shows the effect of mesh size on the incident and reflected wave of the input bar. Finer mesh (Incident and transmitter bar with 90 elements in radial direction and 80 elements along length whereas for specimen, 300 elements along radial direction and 7 elements along length) gives fewer oscillations compared to the coarse mesh (Incident and transmitter bar with 8 elements in radial direction and 80 elements along length whereas for specimen, 15 elements along radial direction and 7 elements along length) but with more computation time. It can also be seen from the figure that with the coarser mesh the wave shows more oscillations compared to the finer mesh. Figure 10 (b) depicts the effect of different element formulation taken | IJMER | ISSN: 2249–6645 | www.ijmer.com | Vol. 4 | Iss. 1 | Jan. 2014 |52|
- 6. Study the Effect of Different SHPB Test Parameters Using Numerical Simulation Technique into consideration during modeling. The element formulation 1 is constant stress solid element and element formulation 2 is fully integrated solid element, while comparing the result obtained from above two formulation it is observed that there is no significant difference in the results, so we can take either of the elements formulation during modeling in case of metal foam. Coarser Mesh Finer Mesh 0.0004 0.0000 -0.0004 0.0004 0.0000 -0.0004 -0.0008 -0.0008 0.0000 Element Formulation 1 Element Formulation 2 0.0008 Effective Plastic Strain Effective Plastic Strain 0.0008 0.0004 0.0008 0.0012 0.0000 0.0004 0.0008 0.0012 Time (s) Time (s) (b) (a) Fig 10 (a): Incident and reflected wave from numerical simulation of fine and coarser mesh, 10 (b): Incident and reflected wave of input bar with different element formulation. Figure 11 shows the simulated model of the split Hopkinson pressure bar. This figure shows the deformation of the specimen when the stress wave travels through the bars and reaches the interface between the incident bar and specimen. Striker generates a compressive stress waves in the incident bar which travels in a uniaxial direction to hit the test specimen. At this instance, generated compressive stress wave by the incident bar is partially transmitted into the transmitted bar through the test specimen. However, some of the compressive stress waves in the incident bar would reflect back into it as a tensile stress wave. Strains are recorded from both incident and transmitted bars with the help of the numerical strain gauges mounted on the bars using reference point. Figure 12 (a) 12 (b) show the stress wave pulse travelling from one end of the incident bar to the other end of the transmitter bar at different time intervals. The Figure 12 (a) shows that stress wave starts traveling from the incident bar at the time interval of about 0.0007 s and as the time reaches 0.00033 s the stress wave has travelled about half the distance of the incident bar. As further the time increases and become equal to about 0.0003 s the wave reaches the interface of the incident bar and specimen and the deformation of the specimen take place. At the time interval of about 0.0011 seconds the wave reaches at the end of the transmitter bar and some of the wave are transmitted back which is shown in Figure 12 (b). Fig 11: Simulated model of SHPB showing deformation of the specimen. | IJMER | ISSN: 2249–6645 | www.ijmer.com | Vol. 4 | Iss. 1 | Jan. 2014 |53|
- 7. Study the Effect of Different SHPB Test Parameters Using Numerical Simulation Technique Fig 12: Wave propagation and effective stress at different time intervals. V. CONCLUSION Numerical simulation is an effective tool for carrying out the study of the wave on the behavior of metal foam. Parametric studies show the effects of the various parameters on the behavior of foam, which can effectively be used to carry out the studies and model the SHPB with ease. Using LS DYNA, a three dimensional split Hopkinson pressure bar is modeled and following conclusions are drawn from the simulation: 1. As the striker bar length increases the wave duration increases. The trend of striker bar length to wave duration is linear. 2. Amplitude of the wave is directly proportional to the striker bar velocity as the velocity increase the amplitude of the pulse increases. 3. Materials model play an important role while studying the behavior of any metal foam, accurate materials model is must to accurately predict the behavior of metal foam during simulation. 4. The meshing play an important role during the modeling so optimized meshing should be chosen to get the best result with minimum computational time. The meshing is related to computational time as the meshing become finer the computational time also increases. 5. An important criterion for SHPB test could be impact velocity, as maximum allowable impact velocity depends upon the specific materials. 6. Effect of friction between bars and specimen may play an important role for material’s behavior under dynamic loading in the case of large plastic strain, even if lubricant is used, effect of which is not considered in the simulation. REFERENCES [1] [2] [3] [4] [5] [6] Hopkinson, B. (1914). “A method of measuring the pressure produced in the detonation of high explosive or by the impact of bullets”, Philosophical Transactions of the Royal Society of London, pp. 497-508. Kolsky, H. (1949). “An Investigation of the mechanical properties of materials at very high rates of strain”, Proceedings of Royal Physical Society, B 62, pp. 676-700. Goel, M.D., Peroni, M., Solomos, G., Mondal, D.P., Matsagar, V.A., Gupta, A.K., Larcher,M. and Marburg,S. (2012). "Dynamic compression behavior of cenosphere aluminum alloy syntactic foam."Materials and Design, 42, 418–423. Goel, M.D., Matsagar, V.A., Gupta, A.K. and Marburg, S. (2012). “Strain rate sensitivity of closed cell aluminum fly ash foam.” Transactions of Nonferrous Metals Society of China, Vol. 23, pp. 1080-1089. Irausquín, F. Teixeira-Dias, V. Miranda, J.L. Pérez-Castellanos (2010) “Numerical modeling of the dynamic compression of a closed cell aluminum foam.” Iberian Conference on Fracture and Structural Integrity, Porto, Portugal. LS-DYNA keyword User’s Manual, Version 971. | IJMER | ISSN: 2249–6645 | www.ijmer.com | Vol. 4 | Iss. 1 | Jan. 2014 |54|