Phenotypic diversity of two Ethiopian village chicken ecotypes
•
0 j'aime•940 vues

Poster by Takele Taye Desta, Tadelle Dessie, Stacey Lynch, Paul Wigley, Pete Kaiser, Rob Christley and Olivier Hanotte at the 45th Population Genetics Group meeting, University of Nottingham, 4-7 January 2012
Recommandé

Recommandé
Contenu connexe
Tendances
Tendances (16)
En vedette
En vedette (16)
Plus de ILRI
Plus de ILRI (20)
Dernier
Dernier (20)
Phenotypic diversity of two Ethiopian village chicken ecotypes
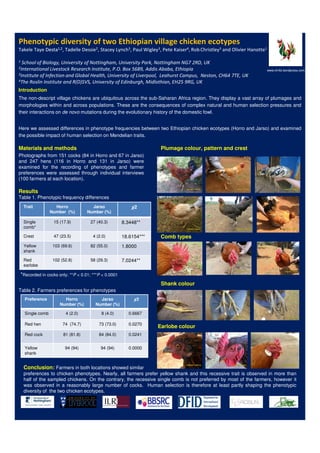
- 1. Phenotypic diversity of two Ethiopian village chicken ecotypes . Takele Taye Desta1,2, Tadelle Dessie2, Stacey Lynch3, Paul Wigley3, Pete Kaiser4, Rob Christley3 and Olivier Hanotte1 1 School of Biology, University of Nottingham, University Park, Nottingham NG7 2RD, UK 2International Livestock Research Institute, P.O. Box 5689, Addis Ababa, Ethiopia www.ch4d.wordpress.com 3Institute of Infection and Global Health, University of Liverpool, Leahurst Campus, Neston, CH64 7TE, UK 4The Roslin Institute and R(D)SVS, University of Edinburgh, Midlothian, EH25 9RG, UK Introduction The non-descript village chickens are ubiquitous across the sub-Saharan Africa region. They display a vast array of plumages and morphologies within and across populations. These are the consequences of complex natural and human selection pressures and their interactions on de novo mutations during the evolutionary history of the domestic fowl. Here we assessed differences in phenotype frequencies between two Ethiopian chicken ecotypes (Horro and Jarso) and examined the possible impact of human selection on Mendelian traits. Materials and methods Plumage colour, pattern and crest Photographs from 151 cocks (84 in Horro and 67 in Jarso) and 247 hens (116 in Horro and 131 in Jarso) were examined for the recording of phenotypes and farmer preferences were assessed through individual interviews (100 farmers at each location). Results Table 1. Phenotypic frequency differences ecotypes Trait Horro Jarso χ2 Number (%) Number (%) Single 15 (17.9) 27 (40.3) 8.3448** comb* Crest 47 (23.5) 4 (2.0) 18.6154*** Comb types Yellow 103 (69.6) 82 (55.0) 1.8000 shank Red 102 (52.8) 58 (29.3) 7.0244** earlobe *Recorded in cocks only; **P < 0.01; ***P < 0.0001 Shank colour Table 2. Farmers preferences for phenotypes Preference Horro Jarso χ2 Number (%) Number (%) Single comb 4 (2.0) 8 (4.0) 0.6667 Red hen 74 (74.7) 73 (73.0) 0.0270 Earlobe colour Red cock 81 (81.8) 84 (84.0) 0.0241 Yellow 94 (94) 94 (94) 0.0000 shank Conclusion: Farmers in both locations showed similar preferences to chicken phenotypes. Nearly, all farmers prefer yellow shank and this recessive trait is observed in more than half of the sampled chickens. On the contrary, the recessive single comb is not preferred by most of the farmers, however it was observed in a reasonably large number of cocks. Human selection is therefore at least partly shaping the phenotypic diversity of the two chicken ecotypes.