
Recommandé
Recommandé
Contenu connexe
Tendances
Tendances (20)
Similaire à ihenacho_Writing_Sample
Similaire à ihenacho_Writing_Sample (20)
ihenacho_Writing_Sample
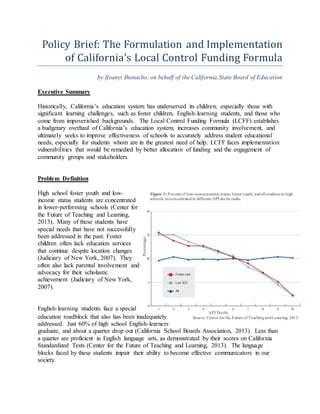
- 1. Policy Brief: The Formulation and Implementation of California’s Local Control Funding Formula by Ifeanyi Ihenacho, on behalf of the California State Board of Education Figure 1: Percent of low-socioeconomic status, foster youth, and all students in high schools, as concentrated in different API decile ranks. API Decile Source: Center for the Future of Teaching and Learning, 2013. Executive Summary Historically, California’s education system has underserved its children, especially those with significant learning challenges, such as foster children, English- learning students, and those who come from impoverished backgrounds. The Local Control Funding Formula (LCFF) establishes a budgetary overhaul of California’s education system, increases community involvement, and ultimately seeks to improve effectiveness of schools to accurately address student educational needs, especially for students whom are in the greatest need of help. LCFF faces implementation vulnerabilities that would be remedied by better allocation of funding and the engagement of community groups and stakeholders. Problem Definition High school foster youth and low-income status students are concentrated in lower-performing schools (Center for the Future of Teaching and Learning, 2013). Many of these students have special needs that have not successfully been addressed in the past. Foster children often lack education services that continue despite location changes (Judiciary of New York, 2007). They often also lack parental involvement and advocacy for their scholastic achievement (Judiciary of New York, 2007). Percentage English- learning students face a special education roadblock that also has been inadequately addressed. Just 60% of high school English- learners graduate, and about a quarter drop out (California School Boards Association, 2013). Less than a quarter are proficient in English language arts, as demonstrated by their scores on California Standardized Tests (Center for the Future of Teaching and Learning, 2013). The language blocks faced by these students impair their ability to become effective communicators in our society.
- 2. Schools within which these students are concentrated face higher costs, yet funding does not adequately flow to them. California’s funding of schools varies by as much as $3,871 per student across local education agencies (LEAs) (Public Policy Institute of California, 2014). Differences in the sizes of LEAs, the types of LEAs, the amount of local property tax revenues, and the categorizations of grant programs, all contribute to the development of a complex and variable funding education formula. Consequently, schools districts which have higher per-pupil costs due to their disproportional share of disadvantaged youth end up receiving inadequate recompense for their needs (Weston, 2010; Imazeki, 2006). This constrains the ability of schools to have quality facilities, quality education materials, adequate class sizes, and other resources that influence student success. This funding disparity violates the basic principle of equitable and quality education for all students in California. Source: California Department of Finance, 2013. Political Context California has had a history of resource constraints in its schools for decades. California’s per-pupil spending currently ranks as 49th in the nation (EdSource, 2014), and its pupil-staff ratio likewise poorly ranks as 50th (U.S. Department of Education, 2012). Attention to this issue magnified in 2010 as various coalitions filed law suits against the state and Governor Schwarzenegger for their failure to provide equal opportunity through the adequate education of students (Weston, 2010). Schwarzenegger had not demanded education reform beforehand primarily due the fiscal instability of California, which, in 2004, he had promised to restore (Hogen-Esch, 2006). In May 2012, Governor Brown introduced the “Weighted Student Funding Formula,” a preliminary budget proposal to the House which sought to adjust education funding and improve the quality of K-12 education. In August, 2012, twenty-five organization leaders from across the state joined to write a letter to legislators, arguing that a weighted formula is necessary in order to remedy educational inequity (Children Now, 2012). Nonetheless, this measure failed. Primarily, legislators were hesitant to change education funding due to the State’s poor fiscal status. The financial crisis of 2008-2012 had led to large reductions to the funding of the California education system. Schools experienced deficit factors upwards of 20%, leading to various lay-offs, increases in class sizes, and the reduction of various K-12 school services (Cabrillo Unified School District, 2011). Education funding was at a low—dropping from $56.6 billion in fiscal year 2007-2008, to $47.3 billion in fiscal year 2011-2012 (California Department of Finance, 2013)(Figure 2). The media attention to the Weighted Pupil Funding Formula nevertheless further bolstered public concern for education equality and mobilized dozens of organizations to support Proposition 30. Proposition 30 passed in the November 2012 ballot, increasing the amount of funds Figure 2:
- 3. available for education by imposing a temporary increase in sales and income taxes. It increases sales taxes by a quarter of a percent and imposes an additional one percent income tax for taxpayers who earn over $250,000 (California Secretary of State, 2012). This proposition is expected to increase education funding for K-14 schools by a total of $19.1 billion by fiscal year 2016-2017, from its low of $47.3 billion in fiscal year 2011-2012 (California Department of Finance, 2013)(Figure 2). The improving economy and Brown’s platform of fiscal austerity also provided a supportive political environment for promoting policies that would alter education funding. By 2013, the California economy had seen strong indicators of recovery. Unemployment had dropped (California Department of Finance, 2014); per capita personal income had rebounded; and housing construction had returned (U.S. Department of Commerce, 2014). Furthermore, Governor Brown had eliminated or made spending cuts and corrections for various programs, such as redevelopment, the criminal justice system, state welfare programs, state employment, and other factors (California Department of Finance, 2013). Brown also dodged opposition by moving LCFF through the budgetary process, so that the measure avoided the risk of being killed in legislative committee. The bill nonetheless received the input of stakeholders. It was vetted in terms of its base funding amount, the concentration factor for concentration funding, its provisions for transparency, its phase-in period of implementation, and its treatment of categorical programs (Fensterwald, 2012). This inclusive negotiation increased constituents’ and stakeholders’ overall support of LCFF. Ultimately, LCFF was supported by over seven dozen organizations and local leaders who promoted its adoption (Children Now, 2013). The bill was signed in the July 2013. The Local Control Funding Formula Objectives LCFF reforms the funding structure of California’s education system. Revenue limits are the amount of general purpose funding that school districts are entitled to, as defined by their student average daily attendance (ADA) (EdSource, 2013). This is funded by local property taxes as well as state taxes (EdSource, 2013). If local property taxes are sufficiently high, the state has no obligation to add further funds and the school has the ability to retain the excess as general purpose funding. Now, however, this excess revenue will count against the amount of state aid provided to these districts (Weston, 2013). Due to LCFF’s “Hold Harmless” provision, no school districts will actually receive less state aid than it had received in 2012 (Legislative Analysts, Office, 2013). These excess tax districts will receive only that amount, however; they will not receive any additional state aid above their 2012 funding levels, until their local tax revenues fall below their ADA entitlement levels.
- 4. Despite this change, all school districts will have higher revenue limits. Schools districts are categorized and funded by four education categories: K-3, 4-6, 7-8, and 9-12 (Legislative Analyst’s Office, 2013). LCFF provides an increased base rate of education funding for each category. Furthermore, LCFF provides supplemental funding of 20% for each student who is English- learning students, low-income students, or foster youth. If a school district has a greater than 55% student body ratio of any of these categories, that district will receive additional concentration funding of 55% for each student above that threshold (Legislative Analyst’s Office, 2013). Figure 3: Implementation Feasibility Assessment Source: Legislative Analyst’s Office, 2013. Depending on the district, LCFF will face varying levels of conflict in its implementation, undermining the feasibility of its effective implementation. An effective public policy will have a sound theory regarding how to achieve its objectives, with unambiguous directives and structures, committed implementation leaders, constituency support, and little policy or demographic conflicts that may undermine the technical aspects of implementation (Sabatier & Mazmanian, 1978). At the state level, the general desire to increase overall school funding by utilizing LCFF has low conflict due to the political history of education reform efforts, the pre-adoption negotiations for the policy, and the ultimate resounding support for its adoption. At the district level, however, LCFF faces critical implementation hurdles due to the high ambiguity of its individual state directives, and the various demographic factors which undermine its technical implementation.
- 5. The state’s implementation goals are clear, but the strategy for effective implementation is left highly ambiguous. In terms of goals, the state has identified eight priorities that school districts must ensure (Children Now, 2014): 1. Providing students with quality teachers and materials 2. Implementation of California’s standards of education. 3. Parental involvement and community engagement 4. Improving student achievement, as seen by test scores 5. Student engagement 6. Elucidation and correction of the school climate 7. Providing students with classed that would grant them college readiness 8. Measuring student outcomes in areas of study outside of math and English In attempt to ensure that funds are being used toward the achievement of these goals, LCFF requires that each school district develop and annually updates a three-year accountability plan. This Local Control Accountability Plan (LCAP) contains rubrics that evaluate the strengths and needs of students as measured across multiple performance indicators (California Department of Education, 2014). This also aims to ensure that the educational experience is constantly evolving to address yearly changes in student demographics and needs. These eight state priorities provide an understanding of what school districts need to achieve, but these priorities provide districts with no clear strategy through which they may achieve these priorities. By simply directing the funding to local school districts and mandating LCAP fulfilment, the state essentially defers a large proportion of the LCFF implementation responsibility to local school districts. This dynamic is a key characteristic of this policy’s design. This strategy relies on the assumption that a subsidiary control of education funding would ultimately remedy the achievement gap more effectively than could an overarching state government. Local school districts are believed to have a better access to the local constituents, and a better understanding of the local demographics; therefore, they may have a better understanding of student needs and how to redress them. Additionally, allowing this experimental implementation of state goals enables the whole state to learn from each district’s experiences (Matland, 1995). In exchange for the flexibility that this ambiguity provides, however, many districts may be confronted with great conflict regarding how exactly they may strategize to achieve state goals and how they may measure their degree of achievement. The ambiguity and conflict may also result in questions regarding true accountability. Feasibility of Implementing Directives In particular, community engagement is one state priority whose technical implementation will present significant challenges to many school districts. LEAs must consult parents and the local community regarding their LCAPs (California Department of Education, 2014). The effectiveness of this provision relies largely on the ability of the community to have readily accessible methods of communication with the school district. The demographics that are particular to each school or community may create unique complications in this endeavor. For example, the City of Bell faces particular difficulty in engaging its community in the Free and Reduced Price Lunch (FRPL) program. Students’
- 6. participation in the FRPL program is important because it is used as an indicator of their family’s socioeconomic status. The magnitude of this participation partly determines the magnitude of LCFF supplemental or concentration grant funding that the Los Angeles Unified School District (LAUSD) will receive to spend on Bell and other schools. The vast majority of Bell students do qualify for free-and-reduced price lunch, but they face language barriers that impede their participation. Almost 90% of Bell residents live in a household in which English is not the language spoken at home (City of Bell, 2014). LAUSD would need to develop a strategy for effectively communicating the FRPL program to these non-English families, motivate them to participate in the program, and properly arrange for the exchange of required documents. Without doing this, LAUSD may receive less of the state funding that it is otherwise entitled to, and the schools within the City of Bell may likewise receive less funding. As this problem replicates amongst the schools of various cities, this reduces the full remedial potential of LCFF. Utilizing advocacy groups may help ameliorate this difficulty. Smaller schools districts with a strong community network are predisposed to have a better opportunity to determine methods of encouraging community involvement. The Parent Teacher Association (PTA) has begun providing many school districts with parental resources such as nightly meetings with parents and discussions that explain effective strategies for school changes (EdSource, 2014). This collective organization may assist large school districts understand the needs of constituents. This benefit of this strategy still somewhat diminishes, however, in the context of large school districts such as LAUSD. LAUSD still has a large administrative burden if it is to adequately articulate the needs of over a thousand schools and synthesize them in a comprehensive LCAP. The technical feasibility for school districts to create a specialized process for increasing the community engagement in each community is further constrained by the fact that they must do so within a very short timeline. In the fall, districts must solicit community input regarding LCAPs and the eight state priorities (Edsource, 2014). By July of the next year, these school districts must update their LCAPs according to that community input (Legislative Analyst’s Office, 2013). This creates a particular challenge to large and diverse school districts. Time constraints and the burden of these large school districts may ultimately encourage them use simple decision rules to resolve these issues that might not actually effectively engender community involvement and ultimately treat the achievement gap of the underserved groups (Lipsky, 1971). This high conflict, high ambiguity scenario indicates that in these large school districts, LCFF is likely to undergo symbolic implementation. In this form of implementation, coalitions and macro-level level actors are the individuals whom have sufficient voice to promote their objectives (Sabatier & Mazmanian, 1978). Measuring the Achievement of Directives Even if school districts develop a strategy to feasibly implement community development, there is high ambiguity regarding how school districts should measure any improvements in community engagement. Due to the ambiguity of measuring this and the high workload of large school districts, administrators may resort to simple quantifiable measures such as the aggregate district-wide number of community engagement events that are hosted, the number of related
- 7. surveys completed, or the percentage of the population that participates. This could ultimately lead to biased results. Such quantitative decision rules may fail to properly account for socioeconomic or demographic factors that inhibit the engagement of particular constituent groups. There is also no clear scale for gauging the degree of improvements within school districts. With no clear uniform scale of measurement, some school districts may measure achievement more or less accurately than other school districts. The recorded measure of improvement may have bias. This flexibility, however, may be preferred at times. Improvements in community engagement may justifiably need to be regarded differently depending on the demographics of the location. Lower-socioeconomic status parents have lower levels of community engagement compared to high-income parents (Stacer and Perruci, 2013). These parents face greater barriers to scholastic community involvement due to their time constraints, their relative inability to secure paid leave, their work inflexibility, and their general perception regarding their role in their child’s education (Heymann and Earle, 2000; Stacer and Perruci, 2013). Accordingly, wealthy areas may be more capable of engaging their communities; working-poor areas may have more difficulty. This disadvantages the ability low-income school districts to effectively engagement low-income schools communities. Consequently, a uniform measure of the degree improvement might not be appropriate; school districts may need to account for the unique characteristics of each school. Ultimately, the ambiguity surrounding this issue makes it more difficult to properly gauge how well state funds are being used. Challenges to Accountability Due to the ambiguity of measuring achievement, there arise questions regarding the degree of accountability that LCAPs actually provide constituent communities. One major concern is that school districts will be dispersed equally amongst all school within the district, only continuing intra-district disparities rather than remedying them (Public Policy Institute of California, 2013). The open question is how lawmakers can ensure that districts will distribute funding adequately to schools that are in greatest need. There are two components of accountability, each of which confronts challenges in implementation. First, the policy relies on procedural mechanisms for accountability, utilizing community and stakeholder engagement as the primary method to ensure responsiveness to local priorities. As discussed above, the technical difficulties of effective implementation of this engagement call this approach into question, particularly for large urban districts, such as LA, that have particular challenges in poor schools. Secondly, if a district fails to satisfy that state’s directive to improve student achievement, the State Superintendent of Public Instruction may intervene. However, the range of remedial actions that he or she the may enact is not clearly defined. This superintendent may unilaterally change a district’s accountability plan budget in a manner that he or she feels would be more conducive to the achievement of the eight state priorities (EdSource, 2014). The superintendent may also appoint a board trustee and rescind the actions of the local board of education (EdSource, 2014). Yet, the state superintendent is not explicitly required to consider community or stakeholder input. Consequently, he or she may potentially provide recommendations that are biased to
- 8. outside influences or the use of heuristics that may obscure the effectiveness of his or her intervention. CONCLUSION The high ambiguity and varying level of conflict surrounding LCFF indicates that it will undergo either experimental or symbolic implementation, depending on the size and diversity of the school district. For smaller school districts, the experimental implementation process may occur; outcomes will be dependent on the actors and resources at the local level (Matland, 1995). The implementation will be contingent upon contextual aspects of the school district such as the size and demographics of the school districts, and the political experience of its superintendents. These factors will affect how well districts may resolve the ambiguity in determining an effective process for achieving state goals, the appropriate measures of success, and the actual degree of accountability that the policy ensures. In larger school districts, however, the high conflict and high ambiguity will lead schools to symbolic implementation. This is particularly true for large and diverse school districts, such as LAUSD, where the needs of a large variety of stakeholders need to be taken into consideration. Community engagement strategies will be particularly difficult for these districts. These districts will have difficulty determining how to engage each community, process the input of the families and stakeholders of each community, and then accordingly adjust the funding and the methods for promoting academic achievement at each individual school. The voice of strong coalitions or wealthy schools may have more weight and their needs may be achieved through preferable funding allocation and resource allocation. We may need targeted funding based on capacity factor of our school districts, with large school districts receiving more funding to account for the administrative difficulties of implementing LCFF. As aforementioned, utilizing organizational networks such as the PTA may maximize collective communication. However, their effectiveness is limited in the contexts of school districts that are sufficiently large due to the raw administrative burden required for these school districts to interact with all of these community groups. There currently is no infrastructure in place to facilitate the degree of communication and interaction that LCFF demands, and LCFF’s remedial potential is constrained so long as this remains unresolved.
- 9. References California Department of Education. (2014). “LCFF Frequently Asked Questions.” Retrieved from http://www.cde.ca.gov/fg/aa/lc/lcfffaq.asp#FC California Department of Education. (2014). “Local Control Funding Formula Overview.” Retrieved from http://www.cde.ca.gov/fg/aa/lc/lcffoverview.asp California Department of Finance. (2014). Unemployment Rate, California and U.S.. Retrieved from www.dof.ca.gov/HTML/FS_DATA/LatestEconData/documents/BBUNR.XLS California Department of Finance. (2013) 2013-2014 Governor’s Budget Summary. Retrieved from http://www.dof.ca.gov/documents/FullBudgetSummary_web2013.pdf California School Boards Association. (2013). California High School Graduation and Dropout Rates. Retrieved from http://www.csba.org/GovernanceAndPolicyResources/~/media/CSBA/Files/Governance Resources/GovernanceBriefs/201305FactSheetHSGradRates.ashx California Secretary of State. (2012). Proposition 30 – State of California. Retrieved from http://vig.cdn.sos.ca.gov/2012/general/pdf/30-title-summ-analysis.pdf Center for the Future of Teaching and Learning. (2013). “The Invisible Achievement Gap.” Retrieved from http://www.cftl.org/documents/2013/IAG/Invisible_Achievement_Gap_Full_Report.pdf Children Now. (2013). LCFF Public Support List. Retrieved from http://www.childrennow.org/index.php/movement/lcff_public_support_list Children Now. (2013). Policy Decisions to Further Guide LCFF’s Implementation. Retrieved from http://lcff.childrennow.org/implementation/pending-policy-decisions Children Now. (2012). Re: Weighted Student Formula Is Critical for Students, Schools and Communities. Retrieved from http://edsource.org/wp-content/uploads/WSF-SupportLet- ChildrenNowETC082812.pdf City of Bell. (2014). Demographics. Retrieved from http://www.cityofbell.org/?navid=49 Edsource. (2014). Deadlines and Milestones for Implementing Local Control and Accountability Plan. Retrieved from http://edsource.org//wp-content/iframe/topic-features/lcff-topic/ assets/timeline-big.png Edsource. (2014). California drops to 49th in school spending in annual Ed Week report. Retrieved from http://edsource.org/2013/california-drops-to-49th-in-school-spending-in-annual- ed-week-report/25379#.Uz-WTfldVqU
- 10. EdSource. (2013). “Highlighting Strategies for Student Success.” Retrieved from https://www.edsource.org/iss_fin_sys_revlimits.html EdSource. (2013). “PTA program creates parent advocates.” Retrieved from https://edsource.org/today/2014/pta-program-creates-parent-advocates/ 57755#.UxOXaoUXeZR Fensterwald, J. (2012). This time, groups get to say their piece on weighted student funding. Retrieved from http://edsource.org/2012/this-time-groups-get-to-say-their-piece-on-weighted- student- funding/22924#.U0G34_ldVqV Heymann, S. J., & Earle, A. (2000). Low-income parents: How do working conditions affect their opportunity to help school-age children at risk? American educational research journal, 37(4), 833-848. Retrieved from: http://aer.sagepub.com/content/37/4/833.short Hogen-Esch, T. (2006). Taking california's temperature: prospects for reform under schwarzenegger. Retrieved from http://www.csun.edu/cscs/research/Taking-Californias- Temperature.pdf Imazeki, J. (2006). Assessing the Costs of K-12 Education in California Public School. Governor's Committee on Education Excellence. Retrieved from http://www.schoolfunding.info/states/states/ca/18-Imazeki%283-07%29.pdf Judiciary of New York. (2007). Addressing the educational needs of children in foster care. Retrieved from https://www.nycourts.gov/ip/justiceforchildren/PDF/EducationalNeeds.pdf Lipsky, M. (1971). Street-level bureaucracy and the analysis of urban reform. Urban Affairs Review, 6(4), 391-409. Retrieved from http://uar.sagepub.com/content/6/4/391.refs Legislative Analyst’s Office. (2013). An Overview of the Local Control Funding Formula. Retrieved from http://lao.ca.gov/reports/2013/edu/lcff/lcff- 072913.aspx#Major_Decisions_Lay_Ahead Matland, R. E. (1995). Synthesizing the implementation literature: The ambiguity-conflict model of policy implementation. Journal of public administration research and theory, 5(2), 145-174. Public Policy Institute of California. (2013). California School District Revenue and Student Poverty: Moving Toward a Weighted Pupil Funding Formula. Retrieved from http://www.ppic.org/content/pubs/report/R_213HRR.pdf Public Policy Institute of California. (2014). Funding California Schools: The Revenue Limit System. Retrieved from http://www.ppic.org/main/publication.asp?i=921
- 11. Sabatier, P., & Mazmanian, D. (1978). The conditions of effective implementation: a guide to accomplishing policy objectives. Policy analysis, 5(4), 481-504. Stacer, M. J., & Perrucci, R. (2013). Parental involvement with children at school, home, and community. Journal of family and economic issues, 34(3), 340-354. Retrieved from http://link.springer.com/article/10.1007%2Fs10834-012-9335-y#page-1 U.S. Department of Commerce, Bureau of Census. (2014). Housing Permits & Starts, California and United States. Retrieved from www.dof.ca.gov/HTML/FS_DATA/LatestEconData/documents/BBAnnualResConstCA-US. xls U.S. Department of Commerce, Bureau of Economic Analysis. (2013). Real Per Capita Personal Income, California and U.S.. Retrieved from www.dof.ca.gov/HTML/FS_DATA/LatestEconData/documents/BBREALPCPI.xls U.S. Department of Education. (2012). “Staff, enrollment, and pupil/staff ratios in public elementary and secondary school systems, by state or jurisdiction: Selected years, fall 2000 through fall 2010.” Retrieved from http://nces.ed.gov/programs/digest/d12/tables/dt12_096.asp Weston, M. (2013). “Basic Aid School Districts.” Retrieved from http://www.ppic.org/content/pubs/report/R_913MWR.pdf Weston, Margaret. (2010). “Funding California Schools The Revenue Limit System.” Retrieved from http://www.ppic.org/content/pubs/report/R_310MWR.pdf Weston, M. (2010). School Finance Reform. Retrieved from http://www.ppic.org/content/pubs/atissue/AI_1110MWAI.pdf