🔝+919953056974 🔝young Delhi Escort service Pusa Road
ACL stages remarkable turnaround
1. 1
Infrastructure
Ahluwalia Contracts (India) Ltd.
We met the management of Ahluwalia Contracts Ltd to get a feel of ground reality on factors effecting construction sector
and company's key future strategies to emerge afloat. ACL is an integrated EPC company engaged in construction of
building structures across residential and commercial segment like hospitals, malls, luxury hotels, corporate buildings,
among others. Company has done well to stage a remarkable turnaround with significant improvement in profitability and
new order bookings. Given below are the key takeaways from the meet:-
Staging a turnaround
ACL has staged a remarkable recovery over the past financial year
(OPM + 650 bps, Earnings +8.4x) through selective bidding and
sound business strategy. Firstly, all new orders are backed by price
escalation clause and share of fixed price contracts stands reduced
to mere 10% of OB (INR 4 bn) vs +50% earlier. Secondly, ACIL is
largely focusing on government projects (65% share currently vs
14% in FY13) owing to payment issues from private players. Thirdly,
balancesheetisbeingstrengthenedthroughsaleofnon-coreassets
and capital infusion by promoters (INR 500 mn) resulting in debt
repayment worth INR 835 mn in FY15 (Net D/E 0.23x).
Superiorexecutionanddecliningcompetitionbodeswellforcompany
ACL with over 80 ongoing projects across 50 cities has superior
execution capabilities, having executed slew of projects across
residential and commercial complexes over the past five decades.
This in addition to declining competition owing to stressed balance
sheet of most of other real estate contractors bodes well for the
company. Competition is now limited to mere 3-4 players namely
Shapoorji Pallonji, L&T, Simplex and NCC as most of the other
companies do not have balance sheet strength to bid for composite
EPC contracts.
3.9x order book/bill provides healthy revenue visibility
ACL has an order backlog of INR 41.5 bn (execution period 30-36
months), which translates into book to bill ratio of 3.9x, thereby
providing healthy revenue visibility over next 2 years. The company
has witnessed order inflows of INR 13.8 bn in FY15 (INR 8.2 bn in
FY14) and INR 10.3 bn in Q1FY16 (inc. L1 of INR 3.5 bn) on the back
of sharp pick up in government tendering (DDA, NBCC). Bid pipeline
Shareholding (%) Mar-15
Promoters 66.87
FIIs 15.62
DIIs 5.08
Others 12.43
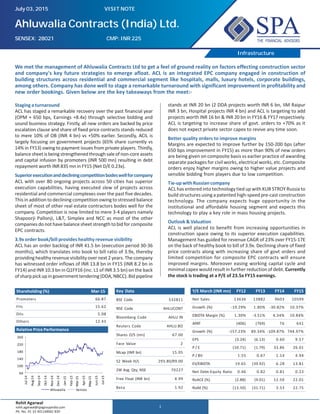
Relative Price Performance
July 03, 2015 VISIT NOTE
stands at INR 20 bn (2 DDA projects worth INR 6 bn, IIM Raipur
INR 3 bn, Hospital projects INR 4 bn) and ACL is targeting to add
projects worth INR 16 bn & INR 20 bn in FY16 & FY17 respectively.
ACL is targeting to increase share of govt. orders to +70% as it
does not expect private sector capex to revive any time soon.
Better quality orders to improve margins
Margins are expected to improve further by 150-200 bps (after
650 bps improvement in FY15) as more than 90% of new orders
are being given on composite basis vs earlier practice of awarding
separate packages for civil works, electrical works, etc. Composite
orders enjoy higher margins owing to higher value projects and
sensible bidding from players due to low competition.
Tie-up with Russian company
ACL has entered into technology tied up with KUB STROY Russia to
build structures using a patented high-speed pre-cast construction
technology. The company expects huge opportunity in the
institutional and affordable housing segment and expects this
technology to play a key role in mass housing projects.
Outlook & Valuation
ACL is well placed to benefit from increasing opportunities in
construction space owing to its superior execution capabilities.
Management has guided for revenue CAGR of 23% over FY15-17E
on the back of healthy book to bill of 3.9x. Declining share of fixed
price contracts along with increasing share of govt orders and
limited competition for composite EPC contracts will ensure
improved margins. Moreover easing working capital cycle and
minimal capex would result in further reduction of debt. Currently
the stock is trading at a P/E of 23.5x FY15 earnings.
Key Data
BSE Code 532811
NSE Code AHLUCONT
Bloomberg Code AHLU IN
Reuters Code AHLU.BO
Shares O/S (mn) 67.00
Face Value 2
Mcap (INR bn) 15.05
52 Week H/L 293.80/99.00
2W Avg. Qty, NSE 70227
Free Float (INR bn) 4.99
Beta 1.92
Y/E March (INR mn) FY12 FY13 FY14 FY15
Net Sales 13636 13882 9603 10599
Growth (%) -19.29% 1.80% -30.82% 10.37%
EBIDTA Margin (%) 1.30% -3.51% 4.34% 10.84%
APAT (406) (769) 76 641
Growth (%) -157.23% 89.34% -109.87% 744.97%
EPS (3.24) (6.13) 0.60 9.57
P / E (10.71) (1.79) 33.86 26.01
P / BV 1.55 0.67 1.14 4.94
EV/EBIDTA 19.65 (39.92) 6.28 13.81
Net Debt-Equity Ratio 0.46 0.82 0.81 0.23
RoACE (%) (2.88) (9.01) 12.59 22.01
RoAE (%) (13.50) (31.71) 3.53 22.75
SENSEX: 28021 CMP: INR 225
Rohit Agarwal
rohit.agarwal@spagroupindia.com
Ph. No. 91 33 40114800/ 839
60
100
140
180
220
260
Jul-14
Aug-14
Sep-14
Oct-14
Nov-14
Dec-14
Jan-15
Feb-15
Mar-15
Apr-15
May-15
Jun-15
Jul-15
Ahluwalia Sensex
2. 2
Infrastructure
Financials
Income StatementY
Y/E March (INR mn) FY12 FY13 FY14 FY15
Net Sales 13636 13882 9603 10599
Growth (%) -19.29% 1.80% -30.82% 10.37%
Cost of goods sold 7219 7980 4545 5412
Power & Fuel Cost 321 335 271 0
Employees Cost 2676 2576 1926 1501
Total Expenditure 13459 14369 9187 9451
EBIDTA (without OI) 178 (487) 417 1149
Growth (%) -88.55% -374.27% -185.51% 175.75%
EBITDA Margin % 1.30% -3.51% 4.34% 10.84%
Depreciation 429 352 122 212
EBIT (251) (839) 295 937
EBIT Margin % -1.84% -6.04% 3.07% 8.84%
Interest Expenses 264 334 363 386
Other Income 110 411 285 117
EBT (406) (762) 217 668
Tax Expenses 1 0 0 26
PAT (406) (762) 217 641
Excep./Extraordinary Items (0) 7 141 0
APAT (406) (769) 76 641
Growth (%) -157.23% 89.34% -109.87% 744.97%
APAT Margin (%) -2.98% -5.54% 0.79% 6.05%
Balance Sheet
Y/E March (INR mn) FY12 FY13 FY14 FY15
SOURCES OF FUNDS
Share Capital 126 126 126 134
Reserves 2681 1919 2136 3243
Total Networth 2807 2044 2262 3377
Secured Loans 2134 2452 2245 1460
Unsecured Loans 0 75 141 90
Total Debt 2134 2527 2386 1551
Total Liabilities 4941 4572 4648 4928
APPLICATION OF FUNDS
Net Block 1512 1385 1307 1773
Capital Work in Progress 308 408 677 175
Investments 135 15 15 63
Total Current Assets 8939 8420 8344 8259
Total Current Liabilities 6114 5818 5858 5496
Net Current Assets 2825 2602 2486 2763
Net Deferred Tax 162 162 162 154
Total Assets 4941 4572 4647 4928
Cash Flow
Y/E March (INR mn) FY12 FY13 FY14 FY15
EBT (406) (762) 217 668
Depreciation 429 352 122 212
Interest 264 334 363 386
Inc./Dec. in working capital (57) 239 (193) (57)
Tax paid (1) 0 0 (137)
Other Income (110) (411) (285) (117)
Cash flow from operations (a) 120 (248) 223 954
Inc./Dec. in investments (55) 120 0 (49)
Change in Fixed Assets (460) (3) (33) (677)
Change in CWIP (156) (100) (270) 502
Others (264) (334) (363) (386)
Cash flow from investing (b) (935) (317) (666) (610)
Inc./Dec. in capital 0 0 0 499
Inc./Dec. in debts 492 393 (142) (835)
Dividend paid 0 0 0 0
Interest paid (264) (334) (363) (386)
Others 372 522 638 598
Cash flow from financing ( c ) 600 581 133 (125)
Opening cash balance 1053 838 855 545
Cash Flow during the year (a+b+c) (215) 17 (310) 220
Closing cash balance 838 855 545 765
Key Ratios
Y/E March FY12 FY13 FY14 FY15
Per Share Data (INR)
Adjusted EPS NA NA 0.60 9.57
CEPS 0.18 NA 1.57 13.05
BVPS 44.73 32.58 36.04 50.40
Return Ratios
RoACE (%) NA NA 12.59 22.01
RoAE (%) NA NA 3.53 22.75
Balance Sheet Ratios
Net Debt-Equity Ratio 0.46 0.82 0.81 0.23
Current Ratio 1.46 1.45 1.42 1.50
Interest Cover Ratio (0.53) (1.28) 1.60 2.73
Efficiency Ratios
Total Asset Turnover 2.78 2.92 2.08 2.21
Inventory Days 53 49 67 65
Debtors Days 123 110 155 141
Creditors Days 81 77 117 108
Valuations
P / E NA NA 33.86 26.01
P / BV 1.55 0.67 1.14 4.94
Market Cap / Sales 0.32 0.10 0.27 1.57
EV/EBIDTA 19.65 NA 6.28 13.81
3. 3
Infrastructure
For More Information Visit Us At : www.spasecurities.com
Sharad Avasthi Head - Equity Research sharad.avasthi@spagroupindia.com Tel.: +91-33-4011 4800 Ext.832
SPA Securities Ltd: Mittal Court, A-Wing, 10th Floor, Nariman Point, Mumbai - 400 021, Tel. No. : +91-022-4289 5600, Fax: +91 (22) 2657 3708/9
Analyst Certification of Independence: The analyst(s) for this report certifies that all the views expressed in this report accurately reflect his or her personal views about the subject company(ies) or issuers and no part of his or
hercompensationwas,isorwillbe,directlyorindirectlyrelatedtospecificrecommendationsorviewsexpressedinthisreport.Theresearchanalystsareboundbystringentinternalregulationsandalsolegalandstatutoryrequirements
of the Securities and Exchange Board of India (hereinafter "SEBI") and the analysts' compensation are completely delinked from all the other companies and/or entities of SPASecurities Limited, and have no bearing whatsoever on
anyrecommendationthattheyhavegivenintheResearchReport.
DisclaimerandDisclosuresasrequiredunderSEBI(Research Analyst)Regulations,2014:SPASecuritiesLimited(hereinafterreferasSPASecurities)anditsaffiliatesareengagedininvestmentbanking,investment advisory,
stock broking, institutional equities, Mutual Fund Distributor and insurance broking. SPASecurities is a SEBI registered securities broking Company having membership of NSE, BSE & MCX for Equity, Future & Option, Currency
Derivatives segment and Wholesale Debt Market. The Company is focused primarily on providing securities broking services to institutional clients and is empanelled as an approved securities broker with all the major Nationalised,
PrivateandCo-operativebanks,Corporatehouses,InsuranceCompanies,FinancialInstitutions,AssetManagementCompaniesandProvidentFundTrusts.Detailsofaffiliatesareavailableonourwebsitei.e.www.spasecurities.com.
Weherebydeclarethatouractivitieswereneithersuspendednorwehavedefaultedwithanystockexchangeauthoritywithwhom weareregisteredinthelastfiveyears.WehavenotbeendebarredfromdoingbusinessbyanyStock
Exchange/SEBI or any other authorities, nor has our certificate of registration been cancelled by SEBI at any point of time.
GeneralDisclosures: ThisResearchReport(hereinaftercalled"report")hasbeenpreparedbySPASecuritiesandismeantforsoleusebytherecipientandnotforcirculation.ThisReportdoesnotconstituteapersonalrecommendation
or take into account the particular investment objectives, financial situations, or needs of individual clients. The recommendations, if any, made herein are expression of views and/or opinions and should not be deemed or construed
tobeneitheradviceforthepurposeofpurchaseorsaleofanysecurity,(asdefinedundersection2(h)ofsecuritiesContracts(Regulation)Act.1956,throughSPASecuritiesnoranysolicitationorofferingofanyinvestment/tradingopportunity
onbehalfoftheissuer(s)oftherespectivesecurity(ies)referredtoherein.RecipientsofthisReportshouldrelyoninformation/dataarisingoutoftheirowninvestigations.Readersareadvisedtoseekindependentprofessionaladvice
and arrive at an informed trading/investment decision before executing any trades or making any investments.
ThisReporthasbeenpreparedonthebasisofpubliclyavailableinformation,internallydevelopeddataandothersourcesbelievedbySPASecuritiestobereliable,althoughitsaccuracyandcompletenesscannotbeguaranteed.Such
information has not been independently verified and no guaranty, representation of warranty, express or implied, is made as to its accuracy, completeness or correctness.Any review, retransmission or any other use is prohibited.
The information, opinions, views expressed in this Research Report are those of the research analyst as at the date of this Research Report which are subject to change and do not represent to be an authority on the subject. While
we would endeavour to update the information herein on a reasonable basis, we are under no obligation to update the information.Also, there may be regulatory, compliance or other reasons that prevent us from doing so. Hence all
such information and opinions are subject to change without notice.
Our salespeople, traders, and other professionals may provide oral or written market commentary or trading strategies to our clients that reflect opinions that are contrary to the opinions expressed herein, and our proprietary trading
and investing businesses may make investment decisions that may be inconsistent with the recommendations expressed herein.
This Research Report should be read and relied upon at the sole discretion and risk of the recipient. If you are dissatisfied with the contents of this complimentary Research Report or with the terms of this Disclaimer, your sole and
exclusive remedy is to stop using this Research Report. Neither SPASecurities nor its affiliates or their respective directors, employees, agents or representatives shall be responsible or liable in any manner, directly or indirectly, for
the losses or the damages sustained due to the investments made or any action taken on basis of this report, including but not restricted to, fluctuation in the prices of shares and bonds, changes in the currency rates, diminution in
the NAVs, reduction in the dividend or income, etc.
Compensation of our ResearchAnalysts is not based on any specific merchant banking, investment banking or brokerage service transactions. SPASecurities may have issued other reports in the past that are inconsistent with and
reachdifferentconclusionfromtheinformationpresentedinthisreport.
SPASecurities, its affiliates and employees may, from time to time, effect or have effected an own account transaction in, or deal as principal or agent in or for the securities mentioned in this document.They may perform or seek to
perform investment banking or other services for, or solicit investment banking or other business from, any company referred to in this report.
TheusershouldconsulttheirownadvisorstodeterminethemeritsandrisksofinvestmentandalsoreadtheRiskDisclosureDocumentsforCapitalMarketsandDerivativeSegmentsasprescribedbySecuritiesandExchangeBoard
of India before investing in the Indian Markets.
A graph of daily closing prices of securities is available at www.nseindia.com and http://economictimes.indiatimes.com/markets/stocks/stock-quotes. (Choose a company from the list on the browser and select the "three years" icon
in the price chart).
SPASecurities plans to register itself as a Research Entity under the SEBI (ResearchAnalysts) Regulations, 2014.
Disclaimers in respect of jurisdiction: This report is not directed to, or intended for distribution to or use by, any person or entity who is a citizen or resident or located in any locality, state, country or other jurisdiction where such
distribution, publication, reproduction, availability or use would be contrary to law or regulation or what would subject SPASecurities or its affiliates to any registration or licensing requirement within such jurisdiction. If this report is
inadvertentlysendorhasreachedanyindividualinsuchcountry,especially,USA,thesamemaybeignoredandbroughttotheattentionofthesender.Thisdocumentmaynotbereproduced,distributedorpublishedforanypurposes
without prior written approval of SPASecurities.
List of Associates as per SEBI (Research Analyst) Regulations, 2014
• SPAInsurance Broking Services limited
Statements on ownership and material conflicts of interest, compensation - SPA and Associates
Disclosure of interest statement Yes/No
SPA Securities/its Affiliates/Analyst/his or her Relative financial interest in the company No
SPA Securities/its Affiliates/Analyst/his or her Relative actual/beneficial ownership of more than 1% in subject company at the end of the month
Immediately preceding the date of the publication of the research report or date of public appearance. No
Investment banking relationship with the company covered No
Any other material conflict of interest at the time of publishing the research report No
Receipt of compensation by SPA Securities or its Affiliated Companies from the subject company covered for in the last twelve months:
• Managing/co-managing public offering of securities
• Investmentbanking/merchantbanking/brokerageservices
• products or services other than those above
• in connection with research report
No
Whether Research Analyst has served as an officer, director or employee of the subject company covered No
Whether the Research Analyst or Research Entity has been engaged in market making activity of the Subject Company; No
For statements on ownership and material conflicts of interest, compensation, etc. for individual Research Analyst(s), please refer to each specific research report.
SPA CAPITAL SERVICES LIMITED
Investment Advisory Services,
AMFI Reg. No. ARN-0007
SPA CAPITAL ADVISORS LIMITED
SEBI registered Category-1
Merchant Bankers
SEBI Regn. No. INM000010825
SPA COMTRADE PRIVATE LIMITED
Member of NCDEX & MCX.
NCDEX TMID-00729,
NCDEXFMCNo.NCDEX/TCM/CORP/0714
SPAINSURANCE BROKING SERVICES LTD
Direct Broker for Life and General
Insurance Broking
IRDA Lic. Code No. DB053/03
SPA Securities Ltd SEBI Reg. Nos.
NSE Cash INB231178238
NSE Future & Option INF231173238
NSE Currency Derivatives INE231178238
BSE Cash INB011178234
BSE Currency Derivatives INE011178234
MCX-SX Cash INB261178231
MCX-SX Future & Option INF261178231
MCX-SX Currency Derivatives INE261178238
Mutual Fund ARN 77388
CDSLDP IN-DP-CDSL-485-2008
NSDLDP IN-DP-NSDL-316-2009