Buy Multibase India, globalisation of the auto component sector to benefit the company
•
1 j'aime•452 vues

Buy Multibase India, globalisation of auto component sector to benefit the company #BrokerAdvice http://goo.gl/g5aH3c

Recommandé
Recommandé
Contenu connexe
Tendances
Tendances (20)
Similaire à Buy Multibase India, globalisation of the auto component sector to benefit the company
Similaire à Buy Multibase India, globalisation of the auto component sector to benefit the company (20)
Plus de IndiaNotes.com
Plus de IndiaNotes.com (20)
Dernier
Dernier (20)
Buy Multibase India, globalisation of the auto component sector to benefit the company
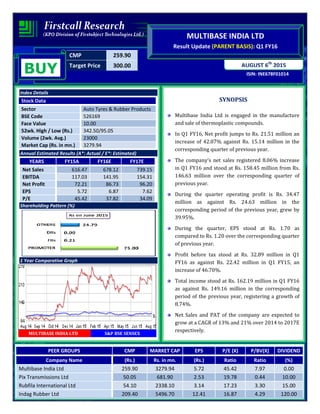
- 1. CMP 259.90 Target Price 300.00 ISIN: INE678F01014 AUGUST 6th 2015 MULTIBASE INDIA LTD Result Update (PARENT BASIS): Q1 FY16 BUY Index Details Stock Data Sector Auto Tyres & Rubber Products BSE Code 526169 Face Value 10.00 52wk. High / Low (Rs.) 342.50/95.05 Volume (2wk. Avg.) 23000 Market Cap (Rs. in mn.) 3279.94 Annual Estimated Results (A*: Actual / E*: Estimated) YEARS FY15A FY16E FY17E Net Sales 616.47 678.12 739.15 EBITDA 117.03 141.95 154.31 Net Profit 72.21 86.73 96.20 EPS 5.72 6.87 7.62 P/E 45.42 37.82 34.09 Shareholding Pattern (%) 1 Year Comparative Graph MULTIBASE INDIA LTD S&P BSE SENSEX SYNOPSIS Multibase India Ltd is engaged in the manufacture and sale of thermoplastic compounds. In Q1 FY16, Net profit jumps to Rs. 21.51 million an increase of 42.07% against Rs. 15.14 million in the corresponding quarter of previous year. The company’s net sales registered 8.06% increase in Q1 FY16 and stood at Rs. 158.45 million from Rs. 146.63 million over the corresponding quarter of previous year. During the quarter operating profit is Rs. 34.47 million as against Rs. 24.63 million in the corresponding period of the previous year, grew by 39.95%. During the quarter, EPS stood at Rs. 1.70 as compared to Rs. 1.20 over the corresponding quarter of previous year. Profit before tax stood at Rs. 32.89 million in Q1 FY16 as against Rs. 22.42 million in Q1 FY15, an increase of 46.70%. Total income stood at Rs. 162.19 million in Q1 FY16 as against Rs. 149.16 million in the corresponding period of the previous year, registering a growth of 8.74%. Net Sales and PAT of the company are expected to grow at a CAGR of 13% and 21% over 2014 to 2017E respectively. PEER GROUPS CMP MARKET CAP EPS P/E (X) P/BV(X) DIVIDEND Company Name (Rs.) Rs. in mn. (Rs.) Ratio Ratio (%) Multibase India Ltd 259.90 3279.94 5.72 45.42 7.97 0.00 Pix Transmissions Ltd 50.05 681.90 2.53 19.78 0.44 10.00 Rubfila International Ltd 54.10 2338.10 3.14 17.23 3.30 15.00 Indag Rubber Ltd 209.40 5496.70 12.41 16.87 4.29 120.00
- 2. QUARTERLY HIGHLIGHTS (PARENT BASIS) Results Updates- Q1 FY16 Multibase India Limited was incorporated in 1991 and is engaged in the manufacture and sale of thermoplastic compounds has reported its financial results for the quarter ended 30th June, 2015. The company’s net profit jumps to Rs. 21.51 million against Rs. 15.14 million in the corresponding quarter ending of previous year, an increase of 42.07%. Revenue for the quarter rose by 8.06% to Rs. 158.45 million from Rs. 146.63 million, when compared with the prior year period. Reported earnings per share of the company stood at Rs. 1.70 a share during the quarter as against Rs. 1.20 over previous year period. Profit before interest, depreciation and tax is Rs. 34.47 million as against Rs. 24.63 million in the corresponding period of the previous year. Break up of Expenditure Months June-15 June-14 % Change Net Sales 158.45 146.63 8.06 PAT 21.51 15.14 42.07 EPS 1.70 1.20 42.07 EBITDA 34.47 24.63 39.95 Break up of Expenditure (Rs in millions) Q1 FY16 Q1 FY15 % CHNG Cost of materials consumed 88.19 87.57 1% Purchase of stock in Trade 12.78 10.38 23% Employee benefits expense 8.61 7.07 22% Depreciation & Amortization Expense 1.38 2.11 -35% Other expenses 20.05 17.61 14%
- 3. COMPANY PROFILE Multibase India Limited was incorporated in 1991 and is engaged in the manufacture and sale of thermoplastic compounds in India. The company also offers polypropylene compound, thermoplastic elastomer, silicon master batch, and thermoplastic master batch products. Its products are used in a range of applications, including automotive, personal care, personal hygiene, stationery, telecommunications, engineering polymers, etc. Multibase India Limited is a subsidiary of Multibase S.A, France. Brands • Dow Corning SiMB • Multiflex® • Multibatch® • Multipro • TPSiV®
- 4. FINANCIAL HIGHLIGHT (PARENT BASIS) (A*- Actual, E* -Estimations & Rs. In Millions) Balance Sheet as at March 31, 2014 -2017E FY14A FY15A FY16E FY17E SOURCES OF FUNDS Shareholder's Funds Share Capital 126.20 126.20 126.20 126.20 Reserves and Surplus 214.17 285.43 372.16 468.37 1. Sub Total - Net worth 340.37 411.63 498.36 594.57 Non Current Liabilities Deferred Tax Liabilities 2.34 1.69 1.77 1.83 Long term Provisions 2.80 3.82 4.39 4.88 2. Sub Total - Non Current Liabilities 5.14 5.51 6.17 6.70 Current Liabilities Trade Payables 55.63 40.00 36.00 37.80 Other Current Liabilities 5.78 7.75 8.91 9.89 Short Term Provisions 1.65 3.07 3.50 3.85 3. Sub Total - Current Liabilities 63.06 50.82 48.41 51.54 Total Liabilities (1+2+3) 408.57 467.96 552.94 652.82 APPLICATION OF FUNDS Non-Current Assets a) Fixed Assets 50.36 52.72 56.41 59.80 b) Long Term loans and advances 9.49 9.89 10.52 11.26 1. Sub Total - Non Current Assets 59.85 62.61 66.93 71.05 Current Assets Inventories 111.42 93.51 103.80 114.18 Trade receivables 106.14 100.70 109.76 121.84 Cash and Bank Balances 106.69 177.63 234.47 302.47 Short-terms loans & advances 24.47 33.51 37.98 43.28 2. Sub Total - Current Assets 348.72 405.35 486.01 581.76 Total Assets (1+2) 408.57 467.96 552.94 652.82
- 5. Annual Profit & Loss Statement for the period of 2014 to 2017E Value(Rs.in.mn) FY14A FY15A FY16E FY17E Description 12m 12m 12m 12m Net Sales 545.64 616.47 678.12 739.15 Other Income 8.19 12.31 13.79 14.61 Total Income 553.83 628.78 691.90 753.76 Expenditure -473.19 -511.75 -549.95 -599.45 Operating Profit 80.64 117.03 141.95 154.31 Interest -0.72 -0.60 -0.67 -0.73 Gross profit 79.92 116.43 141.28 153.58 Depreciation -4.72 -7.07 -7.64 -8.17 Profit Before Tax 75.20 109.36 133.64 145.41 Tax -24.41 -37.15 -46.91 -49.21 Net Profit 50.79 72.21 86.73 96.20 Equity capital 126.20 126.20 126.20 126.20 Reserves 214.17 285.43 372.16 468.37 Face value 10.00 10.00 10.00 10.00 EPS 4.02 5.72 6.87 7.62 Quarterly Profit & Loss Statement for the period of 31st Dec, 2014 to 30th Sep, 2015E Value(Rs.in.mn) 31-Dec-14 31-Mar-15 30-Jun-15 30-Sep-15E Description 3m 3m 3m 3m Net sales 162.59 158.65 158.45 161.62 Other income 3.67 3.22 3.74 3.96 Total Income 166.26 161.87 162.19 165.58 Expenditure -130.56 -129.92 -127.72 -130.75 Operating profit 35.70 31.95 34.47 34.83 Interest -0.13 -0.17 -0.20 -0.18 Gross profit 35.57 31.78 34.27 34.65 Depreciation -2.16 -0.70 -1.38 -1.44 Profit Before Tax 33.41 31.08 32.89 33.22 Tax -11.26 -11.79 -11.38 -11.33 Net Profit 22.15 19.29 21.51 21.89 Equity capital 126.20 126.20 126.20 126.20 Face value 10.00 10.00 10.00 10.00 EPS 1.76 1.53 1.70 1.73
- 6. Ratio Analysis Particulars FY14A FY15A FY16E FY17E EPS (Rs.) 4.02 5.72 6.87 7.62 EBITDA Margin (%) 14.78 18.98 20.93 20.88 PBT Margin (%) 13.78 17.74 19.71 19.67 PAT Margin (%) 9.31 11.71 12.79 13.02 P/E Ratio (x) 64.58 45.42 37.82 34.09 ROE (%) 14.92 17.54 17.40 16.18 ROCE (%) 25.08 30.15 30.02 27.33 EV/EBITDA (x) 39.35 26.51 21.45 19.29 Book Value (Rs.) 26.97 32.62 39.49 47.11 P/BV 9.64 7.97 6.58 5.52 Charts
- 7. OUTLOOK AND CONCLUSION At the current market price of Rs. 259.90, the stock P/E ratio is at 37.82 x FY16E and 34.09 x FY17E respectively. Earnings per share (EPS) of the company for the earnings for FY16E and FY17E are seen at Rs. 6.87 and Rs. 7.62 respectively. Net Sales and PAT of the company are expected to grow at a CAGR of 13% and 21% over 2014 to 2017E respectively. On the basis of EV/EBITDA, the stock trades at 21.45 x for FY16E and 19.29 x for FY17E. Price to Book Value of the stock is expected to be at 6.58 x and 5.52 x for FY16E and FY17E respectively. We recommend ‘BUY’ in this particular scrip with a target price of Rs. 300.00 for Medium to Long term investment. INDUSTRY OVERVIEW The Indian auto components industry has experienced healthy sequential growth over the last one-and-a-half years. The growth can be attributed to factors such as strong buoyancy in the end-user industry, recovery of the global economy, improved consumer sentiment and return of adequate liquidity in the financial system. The revival of the auto industry was initially driven by the fiscal stimulus programme of the government. The industry currently accounts for almost seven per cent of India’s gross domestic product (GDP) and employs about 19 million people, both directly and indirectly. The ever-increasing development in infrastructure, big domestic market, increasing purchasing power and stable government framework have made India a favourable destination for investment, as per the vision of Automotive Mission Plan (AMP) 2006–2016. The Indian auto component industry is expected to register a turnover of US$ 66 billion by FY 15–16 with the likelihood to touch US$ 115 billion by FY 20–21 depending on favourable conditions, as per the estimates by Automotive Component Manufacturers Association of India (ACMA). In addition, industry exports are projected to reach US$ 12 billion by FY 15–16 and add up to US$ 30 billion by FY 20–21. Revenues for the auto industry in 2014-15 are expected to grow by 11-12 per cent supported by healthy recovery by major original equipment manufacturers (OEMs) in the medium and heavy commercial vehicles (M&HCV) and passenger vehicle (PV) segment. The Government of India’s Automotive Mission Plan (AMP) 2006–2016 has come a long way in ensuring the growth of this sector in the global market. It is expected that this sector's contribution to the GDP will double
- 8. reaching a turnover of US$ 145 billion in 2016 due to the government’s special focus on exports of small cars, multi-utility vehicles (MUVs), two and three-wheelers and auto components. Outlook The rapidly globalising world is opening new avenues for the transportation industry, generating the need for more efficient, safe and reliable modes of transportation, which is subsequently adding to the auto component industry’s growing opportunities. According to a report by the Confederation of Indian Industry (CII), the Indian auto component industry is set to become the third largest in the world by 2025. Also, by that time, newer verticals and opportunities for component manufacturers will open up as the automobile market will shift towards electric, electronic and hybrid cars, and newer technologies will have to be adopted via systematic research and development. Indian auto component makers are well positioned to benefit from the globalisation of the sector as exports potential could be increased by up to four times to US$ 40 billion by 2020. Disclaimer: This document is prepared by our research analysts and it does not constitute an offer or solicitation for the purchase or sale of any financial instrument or as an official confirmation of any transaction. The information contained herein is from publicly available data or other sources believed to be reliable but we do not represent that it is accurate or complete and it should not be relied on as such. Firstcall Research or any of its affiliates shall not be in any way responsible for any loss or damage that may arise to any person from any inadvertent error in the information contained in this report. Firstcall Research and/ or its affiliates and/or employees will not be liable for the recipients’ investment decision based on this document.
- 9. Firstcall India Equity Research: Email – info@firstobjectindia.com C.V.S.L.Kameswari Pharma & Diversified U. Janaki Rao Capital Goods B. Anil Kumar Auto, IT & FMCG M. Vinayak Rao Diversified G. Amarender Diversified Firstcall Research Provides Industry Research on all the Sectors and Equity Research on Major Companies forming part of Listed and Unlisted Segments For Further Details Contact: Tel.: 022-2527 2510/2527 6077 / 25276089 Telefax: 022-25276089 040-20000235 /20000233 E-mail: info@firstobjectindia.com www.firstcallresearch.com