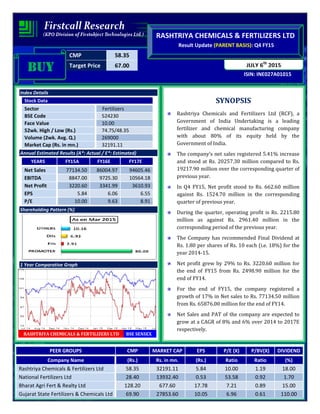
1. CMP 58.35
Target Price 67.00
ISIN: INE027A01015
JULY 6th
2015
RASHTRIYA CHEMICALS & FERTILIZERS LTD
Result Update (PARENT BASIS): Q4 FY15
BUYBUYBUYBUY
Index Details
Stock Data
Sector Fertilizers
BSE Code 524230
Face Value 10.00
52wk. High / Low (Rs.) 74.75/48.35
Volume (2wk. Avg. Q.) 269000
Market Cap (Rs. in mn.) 32191.11
Annual Estimated Results (A*: Actual / E*: Estimated)
YEARS FY15A FY16E FY17E
Net Sales 77134.50 86004.97 94605.46
EBITDA 8847.00 9725.30 10564.18
Net Profit 3220.60 3341.99 3610.93
EPS 5.84 6.06 6.55
P/E 10.00 9.63 8.91
Shareholding Pattern (%)
1 Year Comparative Graph
RASHTRIYA CHEMICALS & FERTILIZERS LTD BSE SENSEX
SYNOPSIS
Rashtriya Chemicals and Fertilizers Ltd (RCF), a
Government of India Undertaking is a leading
fertilizer and chemical manufacturing company
with about 80% of its equity held by the
Government of India.
The company’s net sales registered 5.41% increase
and stood at Rs. 20257.30 million compared to Rs.
19217.90 million over the corresponding quarter of
previous year.
In Q4 FY15, Net profit stood to Rs. 662.60 million
against Rs. 1524.70 million in the corresponding
quarter of previous year.
During the quarter, operating profit is Rs. 2215.80
million as against Rs. 2961.40 million in the
corresponding period of the previous year.
The Company has recommended Final Dividend at
Rs. 1.80 per shares of Rs. 10 each (i.e. 18%) for the
year 2014-15.
Net profit grew by 29% to Rs. 3220.60 million for
the end of FY15 from Rs. 2498.90 million for the
end of FY14.
For the end of FY15, the company registered a
growth of 17% in Net sales to Rs. 77134.50 million
from Rs. 65876.00 million for the end of FY14.
Net Sales and PAT of the company are expected to
grow at a CAGR of 8% and 6% over 2014 to 2017E
respectively.
PEER GROUPS CMP MARKET CAP EPS P/E (X) P/BV(X) DIVIDEND
Company Name (Rs.) Rs. in mn. (Rs.) Ratio Ratio (%)
Rashtriya Chemicals & Fertilizers Ltd 58.35 32191.11 5.84 10.00 1.19 18.00
National Fertilizers Ltd 28.40 13932.40 0.53 53.58 0.92 1.70
Bharat Agri Fert & Realty Ltd 128.20 677.60 17.78 7.21 0.89 15.00
Gujarat State Fertilizers & Chemicals Ltd 69.90 27853.60 10.05 6.96 0.61 110.00
2. QUARTERLY HIGHLIGHTS (PARENT BASIS)
Results updates- Q4 FY15,
The company has achieved a turnover of Rs. 20257.30 million for the 4th quarter of the financial year 2015 as
against Rs. 19217.90 million in the corresponding quarter of the previous year. EBITDA stood at Rs. 2215.80
million in Q4 FY15 against Rs. 2961.40 million in the corresponding period of last year. In Q4 FY15, net profit of
Rs. 662.60 million against Rs. 1524.70 million in the corresponding quarter of the previous year. The company
has reported an EPS of Rs. 1.20 for the 4th quarter as against an EPS of Rs. 2.76 in the corresponding quarter of
the previous year.
Break up of Expenditure
Rs. In million Mar-15 Mar-14 % Change
Net Sales 20257.30 19217.90 5.41
PAT 662.60 1524.70 (56.54)
EPS 1.20 2.76 (56.54)
EBITDA 2215.80 2961.40 (25.18)
Break up of Expenditure
(Rs in millions)
Q4 FY15 Q4 FY14 % Chng
Cost of Materials consumed 7630.10 6901.60 11%
Purchase of traded goods 860.70 299.30 188%
Employee benefit exp 1417.10 1152.40 23%
Power and Fuel 3894.10 3250.50 20%
Freight and Handling charge 1998.20 1766.40 13%
Dep and amortization exp 924.60 438.40 111%
Other expenses 1683.30 1275.40 32%
3. Segment Revenue
COMPANY PROFILE
Rashtriya Chemicals and Fertilizers Limited (RCF) a Government of India Undertaking is a leading fertilizer and
chemical manufacturing company with about 80% of its equity held by the Government of India. It has two
operating units, one at Trombay in Mumbai and the other at Thal, Raigad district, about 100 KM from Mumbai.
Government of India has accorded "Mini-Ratna" status to RCF. RCF is one of the earliest units set up in the
country with a vision of growth in fertilizer production for food security. It manufactures Urea, Complex
Fertilizers, Bio-fertilizers, Micro-nutrients, 100 per cent water soluble fertilizers, soil conditioners and a wide
range of Industrial Chemicals. It produces 23 lac MT Urea, 6.5 lac MT Complex fertilizers and 1.6 lac MT of
Industrial Chemicals every year. The company is a household name in rural India with brands "Ujjwala" (urea)
and "Suphala" (complex fertilizers) which carry high brand equity. RCF has countrywide marketing network in
all major states. Apart from the own manufactured products, the Company is also engaged in marketing of SSP
and imported fertilizer inputs like, DAP, MOP & NPK fertilizers. Besides fertilizer products, RCF also produces
almost twenty industrial chemicals that are important for the manufacture of dyes, solvents, leather,
pharmaceuticals and a host of other industrial products.
Chemicals essential for every industry from food and drugs to Synthetic fibres, from textiles and cement to
pesticides and paints; from explosives to specialty solvents and dye stock are produced by RCF. RCF also
pioneered the manufacture of basic chemicals such a Methanol, Ammonia, Ammonium Nitrate, Sodium Nitrate,
Sodium Nitrite, Ammonium Bicarbonate, Methylamines, Dimethyl Formamide and Dimethyl acetamide, Formic
Acid, Argon in India. Today RCF is the only manufacturer of Dimethyl Formamide in India. As part of
modernization, RCF has recently modernized its Ammonia – I, Nitric Acid, Methanol and ANP plants. This has
facilitated plants to sustain operations and meet technological challenges of improved efficiency, lower energy
consumption and maintain environmental norms. It has also resulted in company achieving the highest
standards of safety and product quality.
4. FINANCIAL HIGHLIGHT (PARENT BASIS) (A*- Actual, E* -Estimations & Rs. In Millions)
Balance Sheet as at March 31, 2014 -2017E
FY14A FY15A FY16E FY17E
I. EQUITY AND LIABILITIES:
A. Shareholders’ Funds
a) Share Capital 5516.90 5516.90 5516.90 5516.90
b) Reserves and Surplus 19567.00 21592.40 24934.39 28545.32
Sub-Total-Net worth 25083.90 27109.30 30451.29 34062.22
B. Non-Current Liabilities:
a) Long-term borrowings 3321.10 3745.60 4045.25 4287.96
b) Deferred Tax Liabilities [Net] 2570.00 1967.30 1711.55 1540.40
c) Other Long Term Liabilities 552.00 590.30 619.82 644.61
d) Long Term Provisions 1032.00 1506.80 1778.02 1973.61
Sub-Total-Long term liabilities 7475.10 7810.00 8154.64 8446.57
C. Current Liabilities:
a) Short-term borrowings 13349.80 15098.90 16457.80 17774.43
b) Trade Payables 4929.70 5967.20 6862.28 7617.13
c) Other Current Liabilities 3313.90 4054.80 4581.92 4994.30
d) Short Term Provisions 1996.10 2357.80 2640.74 2851.99
Sub-Total-Current Liabilities 23589.50 27478.70 30542.74 33237.85
TOTAL-EQUITY AND LIABILITIES (A+B+C) 56148.50 62398.00 69148.66 75746.64
II. ASSETS:
D. Non-Current Assets:
a) Fixed Assets 16968.60 15622.00 15934.44 16689.77
b) Non Current Investments 178.60 1.70 2.55 3.44
c) Long Term Loans and Advances 1314.90 2246.70 2718.51 3153.47
d) Other non-current assets 309.60 98.30 115.99 129.91
Sub-Total-Non-Current Assets 18771.70 17968.70 18771.49 19976.59
E. Current Assets:
a) Inventories 8025.40 9916.40 11503.02 12998.42
b) Trade Receivables 27690.90 32973.60 37146.15 40860.76
c) Cash and Bank Balances 709.50 853.30 989.83 1128.40
d) Short Term Loans and Advances 370.80 388.10 407.51 431.96
e) Other Current Assets 580.20 297.90 330.67 350.51
Sub-Total-Current Assets 37376.80 44429.30 50377.17 55770.05
TOTAL-ASSETS (D+E) 56148.50 62398.00 69148.66 75746.64
5. Annual Profit & Loss Statement for the period of 2014 to 2017E
Value(Rs.in.mn) FY14A FY15A FY16E FY17E
Description 12m 12m 12m 12m
Net Sales 65876.00 77134.50 86004.97 94605.46
Other Income 740.40 743.60 780.78 819.82
Total Income 66616.40 77878.10 86785.75 95425.28
Expenditure -60212.80 -69031.10 -77060.45 -84861.10
Operating Profit 6403.60 8847.00 9725.30 10564.18
Interest -1312.90 -1169.50 -1263.06 -1338.84
Gross profit 5090.70 7677.50 8462.24 9225.34
Depreciation -1417.50 -2581.20 -3149.06 -3652.91
Profit Before Tax 3673.20 5096.30 5313.17 5572.42
Tax -1174.30 -1875.70 -1971.19 -1961.49
Net Profit 2498.90 3220.60 3341.99 3610.93
Equity capital 5516.90 5516.90 5516.90 5516.90
Reserves 19567.00 21592.40 24934.39 28545.32
Face value 10.00 10.00 10.00 10.00
EPS 4.53 5.84 6.06 6.55
Quarterly Profit & Loss Statement for the period of 30 Sep, 2014 to 30 Jun, 2015E
Value(Rs.in.mn) 30-Sep-14 31-Dec-14 31-Mar-15 30-Jun-15E
Description 3m 3m 3m 3m
Net sales 22133.40 19697.60 20257.30 18231.57
Other income 166.40 139.40 329.10 115.19
Total Income 22299.80 19837.00 20586.40 18346.76
Expenditure -19548.70 -17781.90 -18370.60 -16317.26
Operating profit 2751.10 2055.10 2215.80 2029.50
Interest -343.40 -265.40 -249.80 -269.78
Gross profit 2407.70 1789.70 1966.00 1759.72
Depreciation -954.50 -459.90 -924.60 -850.63
Profit Before Tax 1453.20 1329.80 1041.40 909.08
Tax -677.90 -386.70 -378.80 -331.82
Net Profit 775.30 943.10 662.60 577.27
Equity capital 5516.90 5516.90 5516.90 5516.90
Face value 10.00 10.00 10.00 10.00
EPS 1.41 1.71 1.20 1.05
7. OUTLOOK AND CONCLUSION
At the current market price of Rs. 58.35, the stock P/E ratio is at 9.63 x FY16E and 8.91 x FY17E respectively.
Earning per share (EPS) of the company for the earnings for FY16E and FY17E is seen at Rs.6.06 and Rs.6.55
respectively.
Net Sales and PAT of the company are expected to grow at a CAGR of 8% and 6% over 2014 to 2017E
respectively.
On the basis of EV/EBITDA, the stock trades at 5.32 x for FY16E and 5.03 x for FY17E.
Price to Book Value of the stock is expected to be at 1.06 x and 0.95 x for FY16E and FY17E respectively.
We expect that the company surplus scenario is likely to continue for the next three years, will keep its
growth story in the coming quarters also. We recommend ‘BUY’ in this particular scrip with a target price of
Rs.67.00 for Medium to Long term investment.
INDUSTRY OVERVIEW
FY15 was a reasonably good year for the fertiliser industry with overall volumes rising by 6% - in line with
estimates of a 5-7% growth – driven by the healthy sales of P&K fertilisers. While urea volumes grew only
marginally by 1%, P&K volumes posted a robust 13% growth. The secular growth was primarily driven by low
base effect of FY14 and was seen despite a drought during Kharif 2014 and unseasonal rains in Rabi 2014-15.
Monsoon is predicted to be deficient during FY15, although it has started off relatively well. Growth outlook for
the industry, therefore, appears more cautious for FY16: volume growth would depend largely on the regional
distribution of rainfall. While urea sales will not be significantly impacted, the P&K segment is more vulnerable
to monsoon and economic forces (rupee fluctuation, prices of key raw materials, etc.). The P&K segment is also
facing increasing cost pressures as prices of key raw materials are on the rise. Currency depreciation would
further compound the problem. P&K volumes should still remain stable if the distribution of rainfall is even. If
monsoon is normal instead of deficient, sales volumes may witness a 2-3% increase, while volumes may decline
if rainfall is unevenly distributed. Urea demand is expected to post a minor 1-2% growth to ~31-31.5 MMT.
The implementation of the NUP-2015 from Q2 FY16 makes the profitability for individual units dependent
primarily on their energy efficiency. While the current subsidy policy is based on classification of urea units into
six groups based on their feedstock and technological vintage, NUP-2015 reorganises the various units into three
groups based on their energy efficiency levels. The subsidy savings that the units have been generating currently
has been reduced as the normative energy efficiency on the basis of which subsidy is calculated has been
reduced. While positive for the GoI as it would reduce subsidy outgo, it is marginally negative for the urea
industry as they will not be able to get the same quantum of energy savings as they were getting in the past. Most
of the companies in the urea space have been able to improve their energy consumption levels in the past few
8. years through energy savings and / or replacement of machinery under debottlenecking projects. These units
may be able to generate healthy energy savings under the NUP-2015 as well despite tightening of the norms.
Outlook
The recent measures taken by the GoI are broadly positive for the industry, particularly the gas pooling policy,
which will level costs for urea units, incentivises higher urea production from efficient units and provide
visibility on gas availability for future projects. Nevertheless, these policies may not lead to an immediate
improvement in financial performance of the fertiliser industry. The performance of the fertiliser industry in the
near term would largely depend on how monsoon pans out during the Kharif season. The industry would
however benefit from moderate international fertiliser environment with subdued energy price environment
likely to drive cost of production lower for urea, although volatile currency and volatile prices of imported raw
material for P&K fertilisers remains a concern. Besides, subsidy delays are expected to continue in 2015-16. Also,
the issue of gas availability for P&K manufacturers remains and it remains to be seen how the GoI resolves the
issue going forward.
Disclaimer:
This document is prepared by our research analysts and it does not constitute an offer or solicitation for the
purchase or sale of any financial instrument or as an official confirmation of any transaction. The information
contained herein is from publicly available data or other sources believed to be reliable but we do not represent that
it is accurate or complete and it should not be relied on as such. Firstcall Research or any of its affiliates shall not be
in any way responsible for any loss or damage that may arise to any person from any inadvertent error in the
information contained in this report. Firstcall Research and/ or its affiliates and/or employees will not be liable for
the recipients’ investment decision based on this document.
9. Firstcall India Equity Research: Email – info@firstobjectindia.com
C.V.S.L.Kameswari Pharma & Diversified
U. Janaki Rao Capital Goods
B. Anil Kumar Auto, IT & FMCG
M. Vinayak Rao Diversified
G. Amarender Diversified
Firstcall Research Provides
Industry Research on all the Sectors and Equity Research on Major Companies
forming part of Listed and Unlisted Segments
For Further Details Contact:
Tel.: 022-2527 2510/2527 6077 / 25276089 Telefax: 022-25276089
040-20000235 /20000233
E-mail: info@firstobjectindia.com
www.firstcallresearch.com