SlideShare une entreprise Scribd logo
1  sur  11
Télécharger pour lire hors ligne
CMP 798.95
Target Price 910.00
ISIN: INE477A01012
JULY 28th
, 2015
CAN FIN HOMES LIMITED
Result Update (PARENT BASIS): Q1 FY16
BUYBUYBUYBUY
Index Details
Stock Data
Sector Housing Finance
BSE Code 511196
Face Value 10.00
52wk. High / Low (Rs.) 862.00/332.86
Volume (2wk. Avg. Q.) 20000
Market Cap (Rs. in mn.) 21268.05
Annual Estimated Results (A*: Actual / E*: Estimated)
YEARS FY15A FY16E FY17E
Net Sales 8170.34 9967.81 11622.47
EBITDA 7514.74 9170.39 10686.86
Net Profit 862.43 1174.03 1410.13
EPS 32.40 44.10 52.97
P/E 24.66 18.12 15.08
Shareholding Pattern (%)
1 Year Comparative Graph
CAN FIN HOMES LIMITED BSE SENSEX
SYNOPSIS
Can Fin Homes Ltd (CFHL) focus on individual loan
segment, which has a high growth potential, extend
its business operations in potential places and on
non-housing loans.
For Q1 FY16, Net profit stood at a record of Rs.
321.01 million against Rs. 189.58 million in the
corresponding quarter ending of previous year. An
increase of 69.33% y-o-y.
Net sales of the company rose by 37.80% y-o-y and
stood at a record of Rs. 2425.30 million for Q1 FY16
against Rs. 1760.01 million for the prior period Last
year.
In Q1 FY16, Earnings before Interest, Dep and Tax
was at Rs. 2241.34 million and against Rs. 1631.79
million in Q1 FY15. An increase of 37.35% y-o-y.
Profit before tax (PBT) at Rs. 506.93 million in Q1
FY16 compared to Rs. 290.98 million in Q1 FY15,
registered a growth of 74.21%.
Earning per Share of Rs. 12.06 for the 1st quarter of
FY16 as against an EPS of Rs. 9.25 in the
corresponding quarter of the previous year.
Can Fin Homes has a network of 107 branches & 25
Satellite Offices across 19 states as on 30th June,
2015.
Net Sales and PAT of the company are expected to
grow at a CAGR of 31% and 27% over 2014 to
2017E respectively.
PEER GROUPS CMP MARKET CAP EPS P/E (X) P/BV(X) DIVIDEND
Company Name (Rs.) Rs. in mn. (Rs.) Ratio Ratio (%)
Can Fin Homes Ltd 798.95 21268.05 32.40 24.66 2.76 70.00
Repco Home Finance Ltd 676.85 42211.00 19.74 34.29 4.88 15.00
Dewan Housing Finance Ltd 475.70 69354.60 44.41 10.71 1.50 60.00
LIC Housing Finance Ltd 492.80 248697.90 28.65 17.20 2.79 250.00
Analysis & Recommendation - ‘BUY’
For the quarter ended 30th June 2015, Can Fin Homes Ltd reported its net sales of Rs. 2425.30 million against Rs.
1760.01 million in previous year period, which represents growth of 37.80% y-o-y. For Q1 FY16, EBITDA was Rs.
2241.34 million, an increase of 37.35% against Rs. 1631.79 million in Q1 FY15. The company earned profit after
tax of Rs. 321.01 million, a growth of 69.33% y-o-y against Rs. 189.58 million in corresponding quarter of
previous year. Profit before Tax (PBT) at Rs. 506.93 million in Q1 FY16 as against Rs. 290.98 million in Q1 FY15,
registered a growth of 74.21% y-o-y. With a view to sustain and enhance its performance level, Company is
offering a range of housing as well as non-housing products, with more emphasis on marketing and customer
oriented business relationship.
The real estate sector witnessed a good growth in the last few years. The demand for commercial property is
being driven by the economic growth of the Country. As such, a sharp increase in demand for residential units
and also commercial real estate are foreseen. The Company would continue to give a more focused attention for
lending to individual loan segment, project loans and non-housing loans with an emphasis to further enhance its
market share in the housing market segment. Over FY2014-17E, we expect the company to post a CAGR of 31%
and 27% in its top-line and bottom-line respectively. Hence, we recommend ‘BUY’ for ‘CAN FIN HOMES LTD’
with a target price of Rs.910.00 for medium to long term investment.
QUARTERLY HIGHLIGHTS (PARENT BASIS)
Results updates- Q1 FY16,
Can Fin Homes Ltd’s main business is to provide
loans for the purchase and construction of
residential houses, 88% of loans are retail Individual
Housing Loans and reported its financial results for
the quarter ended 30th June, 2015.
Months June-15 June-14 % Change
Net Sales 2425.30 1760.01 37.80
PAT 321.01 189.58 69.33
EPS 12.06 9.25 30.30
EBITDA 2241.34 1631.79 37.35
The company has achieved a turnover of Rs. 2425.30 million for the 1st quarter of the financial year 2016 as
against Rs. 1760.01 million in the corresponding quarter of the previous year. In Q1 FY16, EBITDA stood at Rs.
2241.34 million and increase of 37.35% against the prior period previous year. In Q1 FY16, net profit of Rs.
321.01 million against Rs. 189.58 million in Q1 FY15. The company has reported an EPS of Rs. 12.06 for the 1st
quarter as against an EPS of Rs. 9.25 in the corresponding quarter of the previous year.
Break up of Expenditure
During Q1 FY16, total Expenditure rose up by 44% per cent mainly on account of employee benefits expenses by
32% to Rs. 71.02 million against Rs. 53.70 million in Q1 FY15. In Q1 FY16 other Expenses increased by 52% and
stood at Rs. 112.95 million against Rs. 74.51 million in Q1 FY15. Whereas Depreciation and amortization by 52%
to Rs. 7.35 million in 1st quarter of FY16 from Rs. 4.83 million over the Corresponding quarter of previous year.
Total expenditure in Q1 FY16 stood to Rs. 191.31 million as against Rs. 133.05 million in Q1 FY15.
COMPANY PROFILE
Can Fin Homes established in the year 1987, and is promoted by Canara Bank in association with reputed
financial institutions including HDFC and UTI. The relevance of having an exclusive outfit for providing housing
finance at a time when institutional finance was not flowing to the housing sector to the required extent and
banks had constraints in locking up funds in long term housing finance saw the birth of CFHL.
It was promoted in 1987, the "International Year for Shelter for the Homeless" by Canara Bank in association
with reputed financial institutions including HDFC and UTI. Can Fin Homes is the first bank sponsored Housing
Finance Company in India and one among the top players in the country's housing finance sector. The expertise
gained by us in housing finance over the years gives us the confidence to come up to expectations. A unique
personal touch in service makes us different from others.
CFHL was set up with the mission of promoting home ownership and increasing housing stock all over the
country. The housing finance company has a standing of over 27 years. It is one among the four HFCs selected by
NHB in its first phase of securitization programme has an all-India presence with a network of 107 branches &
25 Satellite Offices in over 19 states as on 30th June, 2015.
Business Areas
Non Housing Loan
• Personal Loan
• Site Loan
• Mortgage Loan
• Loan against Property
• Child Education Loan.
Housing Loans
• Loan for Rural Housing (LRH)
• Housing Loan Individual
• Home Loan for NRI.
Deposit Scheme
Can Fin Homes has the unique privilege of meeting the varied financial requirements of its customers, be it as a
reliable home finance provider or as a competent fixed deposit accepting company.
• Fixed Deposit
• Cumulative Deposit
• Fixed Deposit Scheme for Senior Citizen
• Cumulative Deposit Scheme for Senior Citizen
• Can fin Trust Fixed Deposit Scheme
• Can fin Trust Cumulative Deposit Scheme.
Recognitions
• CFHL enjoys 5 Star rating from NHB for the purpose of refinance.
• CFHL's Deposit programme enjoys 'MAA+' rating, which is the highest possible under high safety rating.
Location & Branches
• Chandigarh
• Noida
• Gurgaon
• New Delhi
• Jaipur
• Luck now
• Raipur
• Patna
• Ahmadabad
• Bhopal
• Indore
• Vadodara
• Bhubaneswar
• Mumbai
• Navi Mumbai
• Pune
• Hyderabad
• Visakhapatnam
• Vijayawada
• Goa
• Hubli
• Davangere
• Bangalore
• Mangalore
• Chennai
• Hosur
• Mysore
• Pondicherry
• Coimbatore
• Calicut
• Cochin
• Trichy
• Trichur
• Madurai
• Thiruvananthapuram.
FINANCIAL HIGHLIGHT (PARENT BASIS) (A*- Actual, E* -Estimations & Rs. In Millions)
Balance Sheet as at March 31, 2014A-2017E
CAN FIN HOMES LTD. FY-14A FY-15A FY-16E FY-17E
I EQUITY AND LIABILITES
1) Shareholder's Funds
a) Capital 204.88 266.22 204.88 204.88
b) Reserves and Surplus 4318.17 7448.65 8938.38 10547.29
Sub -Total- Shareholder fund 4523.05 7714.87 9143.26 10752.17
2) Share application money pedding allotment 0.00 4.76 5.33 4.80
3) Non Current Liabilities
a) Long- Term Borrowings 43287.95 54572.61 62976.79 71163.77
b) Differed Tax Liability 0.00 216.14 244.24 268.66
c) Long Term Provisions 407.59 539.41 0.00 0.00
Sub-Total -Non - Current liabilities 43695.54 55328.16 660.24 792.29
4) Current Liabilities
a) Short Term Borrowings 3658.92 14836.56 19050.14 22860.17
b) Other Current Liabilities 6731.07 4755.65 5088.55 5495.63
c)Short Term Provisions 507.88 703.54 900.53 1035.61
Sub-Total - Current Liabilities 10897.87 20295.75 25039.22 29391.41
TOTAL-EQUITY AND LIABILITES (1 + 2 + 3+4) 59116.46 83343.54 98069.08 112373.10
II ASSETS
1) Non- Current Assets
Fixed Assets
i. Tangible Assets 78.16 92.77 108.54 124.82
ii. Capital work in progress 0.00 0.00 0.00 0.00
a) Total Fixed Assets 78.16 92.77 108.54 124.82
b) Non-Current Investment 149.35 149.35 149.35 149.35
c) Deferred Tax Assets 48.65 0.00 0.00 0.00
d) Long Term Loans & Advances 58306.15 82069.75 96514.03 110576.12
Sub -Total- Non- Current Assets 58582.31 82311.87 96771.92 110850.29
2) Current Assets
a) Cash & Cash Equivalents 91.54 80.02 86.42 95.06
b) Short- Term Loans and Advances 438.05 948.38 1207.96 1424.69
c) Other Current Assets 4.56 3.27 2.78 3.06
Sub -Total Current Assets 534.15 1031.67 1297.16 1522.81
TOTAL-ASSETS(1 + 2) 59116.46 83343.54 98069.08 112373.10
Annual Profit & Loss Statement for the period of 2014A to 2017E
Value(Rs.in.mn) FY-14A FY-15A FY-16E FY-17E
Description 12m 12m 12m 12m
Net Sales 5780.04 8170.34 9967.81 11622.47
Other Income 0.00 0.00 0.00 0.00
Total Income 5780.04 8170.34 9967.81 11622.47
Expenditure -463.51 -655.60 -797.43 -935.61
Operating Profit 5316.53 7514.74 9170.39 10686.86
Interest -4227.67 -6102.90 -7231.94 -8352.89
Gross profit 1088.86 1411.84 1938.45 2333.98
Depreciation -20.10 -37.32 -41.80 -45.54
Exceptional Items -2.24 0.00 0.00 0.00
Profit Before Tax 1066.52 1374.52 1896.65 2288.43
Tax -309.40 -512.09 -722.63 -878.30
Net Profit 757.12 862.43 1174.03 1410.13
Equity capital 204.85 266.20 266.20 266.20
Reserves 4318.17 7448.65 8938.38 10547.29
Face value 10.00 10.00 10.00 10.00
EPS 36.96 32.40 44.10 52.97
Quarterly Profit & Loss Statement for the period of 31st Dec, 2014 to 30th Sep, 2015E
Value(Rs.in.mn) 31-Dec-14 31-Mar-15 30-Jun-15 30-Sep-15E
Description 3m 3m 3m 3m
Net sales 2155.23 2270.59 2425.30 2667.83
Other income 0.00 0.00 0.00 0.00
Total Income 2155.23 2270.59 2425.30 2667.83
Expenditure -145.04 -191.26 -183.96 -234.77
Operating profit 2010.19 2079.33 2241.34 2433.06
Interest -1600.33 -1676.04 -1727.06 -1892.86
Gross profit 409.86 403.29 514.28 540.20
Depreciation -9.99 -10.36 -7.35 -11.17
Profit Before Tax 399.87 392.93 506.93 529.03
Tax -140.37 -164.06 -185.92 -198.39
Net Profit 259.50 228.87 321.01 330.64
Equity capital 204.85 266.20 266.20 266.20
Face value 10.00 10.00 10.00 10.00
EPS 12.67 8.60 12.06 12.42
Ratio Analysis
Particulars FY-14A FY-15A FY-16E FY-17E
EPS (Rs.) 36.96 32.40 44.10 52.97
EBITDA Margin (%) 91.98% 91.98% 92.00% 91.95%
PBT Margin (%) 18.45% 16.82% 19.03% 19.69%
PAT Margin (%) 13.10% 10.56% 11.78% 12.13%
P/E Ratio (x) 21.62 24.66 18.12 15.08
ROE (%) 16.74% 11.18% 12.75% 13.04%
ROCE (%) 10.37% 9.79% 10.10% 10.24%
Debt Equity Ratio 10.38 9.00 8.91 8.70
EV/EBITDA (x) 11.89 12.06 11.25 10.78
Book Value (Rs.) 220.80 289.81 345.78 406.22
P/BV 3.62 2.76 2.31 1.97
Charts
OUTLOOK AND CONCLUSION
At the current market price of Rs. 798.95, the stock P/E ratio is at 18.12 x FY16E and 15.08 x FY17E
respectively.
Earning per share (EPS) of the company for the earnings for FY16E and FY17E is seen at Rs.44.10 and
Rs.52.97 respectively.
Net Sales and PAT of the company are expected to grow at a CAGR of 31% and 27% over 2014 to 2017E
respectively.
On the basis of EV/EBITDA, the stock trades at 11.25 x for FY16E and 10.10.78 x for FY17E.
Price to Book Value of the stock is expected to be at 2.31 x and 1.97 x respectively for FY16E and FY17E.
We recommend ‘BUY’ in this particular scrip with a target price of Rs.910.00 for Medium to Long term
investment.
INDUSTRY OVERVIEW
Global Economy:
The global economy continued to expand during 2014 at a moderate and uneven pace, as the prolonged
recovery process fro the global financial crises was still saddled with unfinished post- crises adjustments. Global
recovery was also hampered by some new challenges, including a number of unexpected shocks, such as
heightened geographical conflicts in various areas of the world.
Fiscal policy in the United States of America is expected to remain restrictive, but less severe than in 2014. Real
federal government spending is forecast to decline by less than 1 per cent in 2015–2016. It is also assumed that
the debt ceiling will be increased during the forecasting period.
In the baseline outlook, developing countries as a group are expected to grow at 4.8 and 5.1 per cent in 2015 and
2016, respectively, up from the 4.3 per cent estimated for 2014. Growth in the least developed countries (LDCs)
is expected to continue exceeding the global average, at 5.7 per cent in 2015 and 5.9 per cent in 2016. Among the
developed economies, the economy of United States, after some erratic fluctuations in 2014, is expected to
improve in 2015 and 2016, with GDP projected to expand by 2.8 and 3.1 per cent respectively.
Economic growth in South Asia is set to gradually pick up from an estimated 4.9 per cent in 2014 to 5.4 per cent
in 2015 and 5.7 per cent in 2016. While the recovery will be led by India, which accounts for about 70 per cent of
regional output, other economies such as Bangladesh and the Islamic Republic of Iran are also projected to see
stronger growth in the forecast period. Along with robust external demand, growth is expected to be
underpinned by a moderate strengthening of domestic consumptions and investments as countries bebifit from
improved macroeconomics conditions.
Financial Services
India has a diversified financial sector, which is undergoing rapid expansion. The sector comprises commercial
banks, insurance companies, non-banking financial companies, co-operatives, pension funds, mutual funds and
other smaller financial entities. The financial sector in India is predominantly a banking sector with commercial
banks accounting for more than 60 per cent of the total assets held by the financial system.
India's services sector has always served the country’s economy well, accounting for about 57 per cent of the
gross domestic product (GDP). In this regard, the financial services sector has been an important contributor.
The Government of India has introduced reforms to liberalise, regulate and enhance this industry. At present,
India is undoubtedly one of the world's most vibrant capital markets. Challenges remain, but the future of the
sector looks good. The advent of technology has also aided the growth of the industry. About 75 per cent of the
insurance policies sold by 2020 would, in one way or another, be influenced by digital channels during the pre-
purchase, purchase or renewal stages, as per a report by Boston Consulting Group (BCG) and Google India.
Market Size
The size of banking assets in India reached US$ 1.8 trillion in FY14 and is expected to touch US$ 28.5 trillion by
FY25. The Association of Mutual Funds in India (AMFI) data show that assets of the mutual fund industry have hit
an all-time high of about Rs 12 trillion (US$ 189.83 billion). Equity funds had inflows of Rs 52170.00 mn (US$
825.49 million), taking total inflows on a year-to-date basis to Rs 610890.00 mn (US$ 9.66 billion). Income funds
and liquid funds account for the largest proportion of AUM, with Income funds accounting for Rs 5.22 trillion
(US$ 82.59 billion) and equity funds accounting for Rs 3.06 trillion (US$ 48.41 billion).
Government Initiatives
Several measures have been outlined in the Union Budget 2014-15 that aim at reviving and accelerating
investment which, inter alia, include fiscal consolidation with emphasis on expenditure reforms and continuation
of fiscal reforms with rationalization of tax structure; fillip to industry and infrastructure, fiscal incentives and
concrete measures for transport, power, and other urban and rural infrastructure; measures for promotion of
foreign direct investment (FDI) in selected sectors, including defence manufacturing and insurance; and, steps to
augment low cost long-term foreign borrowings by Indian companies. Fiscal reforms have been bolstered further
by the recent deregulation of diesel prices. The launch of ‘Make in India’ global initiative is intended to invite
both domestic and foreign investors to invest in India. The aim of the programme is to project India as an
investment destination and develop, promote and market India as a leading manufacturing destination and as a
hub for design and information. The programme further aims to radically improve the Ease of Doing Business,
open FDI regime, improve the quality of infrastructure and make India a globally competitive manufacturing
destination.
Disclaimer:
This document is prepared by our research analysts and it does not constitute an offer or solicitation for the
purchase or sale of any financial instrument or as an official confirmation of any transaction. The information
contained herein is from publicly available data or other sources believed to be reliable but we do not represent that
it is accurate or complete and it should not be relied on as such. Firstcall Research or any of its affiliates shall not be
in any way responsible for any loss or damage that may arise to any person from any inadvertent error in the
information contained in this report. Firstcall Research and/ or its affiliates and/or employees will not be liable for
the recipients’ investment decision based on this document.
Firstcall India Equity Research: Email – info@firstobjectindia.com
C.V.S.L.Kameswari Pharma & Diversified
U. Janaki Rao Capital Goods
B. Anil Kumar Auto, IT & FMCG
M. Vinayak Rao Diversified
G. Amarender Diversified
Firstcall Research Provides
Industry Research on all the Sectors and Equity Research on Major Companies
forming part of Listed and Unlisted Segments
For Further Details Contact:
Tel.: 022-2527 2510/2527 6077 / 25276089 Telefax: 022-25276089
040-20000235 /20000233
E-mail: info@firstobjectindia.com
www.firstcallresearch.com

Contenu connexe

Tendances

FSA - equity research initiation report
FSA - equity research initiation reportFSA - equity research initiation report
FSA - equity research initiation reportGeorge Gabriel
 
Capital First: Long-term credit rating is rated highly at AA+ by CARE
Capital First: Long-term credit rating is rated highly at AA+ by CARECapital First: Long-term credit rating is rated highly at AA+ by CARE
Capital First: Long-term credit rating is rated highly at AA+ by CAREIndiaNotes.com
 
2017 회사소개서 en-최종
2017 회사소개서 en-최종2017 회사소개서 en-최종
2017 회사소개서 en-최종Hyundai Finance
 
Decoding the National Pension System (NPS)
Decoding the National Pension System (NPS)Decoding the National Pension System (NPS)
Decoding the National Pension System (NPS)Abhishek Mittal
 
SKS Microfinance Q1FY15: NII up 41% to Rs890 mn; Buy
 SKS Microfinance Q1FY15: NII up 41% to Rs890 mn; Buy SKS Microfinance Q1FY15: NII up 41% to Rs890 mn; Buy
SKS Microfinance Q1FY15: NII up 41% to Rs890 mn; BuyIndiaNotes.com
 
Stock Advisory for Today - Buy Stock of Bank of Baroda
Stock Advisory for Today - Buy Stock of Bank of BarodaStock Advisory for Today - Buy Stock of Bank of Baroda
Stock Advisory for Today - Buy Stock of Bank of BarodaNARNOLIA SECURITIES LIMITED
 
Smart Money January February 2012 Singles
Smart  Money January February 2012 SinglesSmart  Money January February 2012 Singles
Smart Money January February 2012 SinglesOliver Taylor
 
CDR of Lanco infratech
CDR of Lanco infratechCDR of Lanco infratech
CDR of Lanco infratechAman Sindhwani
 
Medium to Long Term Investment Idea: Capital Trust
Medium to Long Term Investment Idea: Capital TrustMedium to Long Term Investment Idea: Capital Trust
Medium to Long Term Investment Idea: Capital TrustIndiaNotes.com
 
Life Need Analysis And Concept Of Human Life
Life Need Analysis And Concept Of Human LifeLife Need Analysis And Concept Of Human Life
Life Need Analysis And Concept Of Human Lifenilesh03kumar
 
State bank of india initiating coverage
State bank of india initiating coverageState bank of india initiating coverage
State bank of india initiating coverageAnmol Das
 
RVP 2011 Q1 Letter
RVP 2011 Q1 LetterRVP 2011 Q1 Letter
RVP 2011 Q1 Letterbgcallahan
 
Model Portfolio Series IV 10th August 2012
Model Portfolio Series IV 10th August 2012Model Portfolio Series IV 10th August 2012
Model Portfolio Series IV 10th August 2012BMA Wealth Creators
 
Pre-tax retirement annuity contributions - the tax benefit that very few bene...
Pre-tax retirement annuity contributions - the tax benefit that very few bene...Pre-tax retirement annuity contributions - the tax benefit that very few bene...
Pre-tax retirement annuity contributions - the tax benefit that very few bene...Annemie Nieman CFP®
 

Tendances (20)

Report
ReportReport
Report
 
FSA - equity research initiation report
FSA - equity research initiation reportFSA - equity research initiation report
FSA - equity research initiation report
 
ATS Company Reports: Puravankara projects ltd.
ATS Company Reports: Puravankara projects ltd.ATS Company Reports: Puravankara projects ltd.
ATS Company Reports: Puravankara projects ltd.
 
DIS Initiation 2015
DIS  Initiation  2015DIS  Initiation  2015
DIS Initiation 2015
 
Union budget 2014
Union budget 2014Union budget 2014
Union budget 2014
 
Capital First: Long-term credit rating is rated highly at AA+ by CARE
Capital First: Long-term credit rating is rated highly at AA+ by CARECapital First: Long-term credit rating is rated highly at AA+ by CARE
Capital First: Long-term credit rating is rated highly at AA+ by CARE
 
2017 회사소개서 en-최종
2017 회사소개서 en-최종2017 회사소개서 en-최종
2017 회사소개서 en-최종
 
Decoding the National Pension System (NPS)
Decoding the National Pension System (NPS)Decoding the National Pension System (NPS)
Decoding the National Pension System (NPS)
 
SKS Microfinance Q1FY15: NII up 41% to Rs890 mn; Buy
 SKS Microfinance Q1FY15: NII up 41% to Rs890 mn; Buy SKS Microfinance Q1FY15: NII up 41% to Rs890 mn; Buy
SKS Microfinance Q1FY15: NII up 41% to Rs890 mn; Buy
 
Stock Advisory for Today - Buy Stock of Bank of Baroda
Stock Advisory for Today - Buy Stock of Bank of BarodaStock Advisory for Today - Buy Stock of Bank of Baroda
Stock Advisory for Today - Buy Stock of Bank of Baroda
 
Shikhar insurance fpo snapshot
Shikhar insurance fpo snapshotShikhar insurance fpo snapshot
Shikhar insurance fpo snapshot
 
Smart Money January February 2012 Singles
Smart  Money January February 2012 SinglesSmart  Money January February 2012 Singles
Smart Money January February 2012 Singles
 
CDR of Lanco infratech
CDR of Lanco infratechCDR of Lanco infratech
CDR of Lanco infratech
 
Medium to Long Term Investment Idea: Capital Trust
Medium to Long Term Investment Idea: Capital TrustMedium to Long Term Investment Idea: Capital Trust
Medium to Long Term Investment Idea: Capital Trust
 
Life Need Analysis And Concept Of Human Life
Life Need Analysis And Concept Of Human LifeLife Need Analysis And Concept Of Human Life
Life Need Analysis And Concept Of Human Life
 
State bank of india initiating coverage
State bank of india initiating coverageState bank of india initiating coverage
State bank of india initiating coverage
 
RVP 2011 Q1 Letter
RVP 2011 Q1 LetterRVP 2011 Q1 Letter
RVP 2011 Q1 Letter
 
Model Portfolio Series IV 10th August 2012
Model Portfolio Series IV 10th August 2012Model Portfolio Series IV 10th August 2012
Model Portfolio Series IV 10th August 2012
 
Credit Analysis Of HCC
Credit Analysis Of HCCCredit Analysis Of HCC
Credit Analysis Of HCC
 
Pre-tax retirement annuity contributions - the tax benefit that very few bene...
Pre-tax retirement annuity contributions - the tax benefit that very few bene...Pre-tax retirement annuity contributions - the tax benefit that very few bene...
Pre-tax retirement annuity contributions - the tax benefit that very few bene...
 

Similaire à Firstcall can fin_homes_ltd_29_july15

DHFC sales & profit accelerate in third quarter FY15, buy
 DHFC sales & profit accelerate in third quarter FY15, buy DHFC sales & profit accelerate in third quarter FY15, buy
DHFC sales & profit accelerate in third quarter FY15, buyIndiaNotes.com
 
Dewan Housing Finance: Net profit jumps 14.96% in Q4; Maintain buy
Dewan Housing Finance: Net profit jumps 14.96% in Q4; Maintain buyDewan Housing Finance: Net profit jumps 14.96% in Q4; Maintain buy
Dewan Housing Finance: Net profit jumps 14.96% in Q4; Maintain buyIndiaNotes.com
 
Bajaj Finance Q1FY15: Net profit jumps to Rs2113.60 mn, up 20.27%; Buy
Bajaj Finance Q1FY15: Net profit jumps to Rs2113.60 mn, up 20.27%; BuyBajaj Finance Q1FY15: Net profit jumps to Rs2113.60 mn, up 20.27%; Buy
Bajaj Finance Q1FY15: Net profit jumps to Rs2113.60 mn, up 20.27%; BuyIndiaNotes.com
 
GIC Housing Finance's surplus scenario likely to continue for next three year...
GIC Housing Finance's surplus scenario likely to continue for next three year...GIC Housing Finance's surplus scenario likely to continue for next three year...
GIC Housing Finance's surplus scenario likely to continue for next three year...IndiaNotes.com
 
Edelweiss Financial Services: Q4FY15 operating profit up 77.56% y/y; Buy
Edelweiss Financial Services: Q4FY15 operating profit up 77.56% y/y; BuyEdelweiss Financial Services: Q4FY15 operating profit up 77.56% y/y; Buy
Edelweiss Financial Services: Q4FY15 operating profit up 77.56% y/y; BuyIndiaNotes.com
 
Coral India Finance: Buy for medium to long-term investment
Coral India Finance: Buy for medium to long-term investmentCoral India Finance: Buy for medium to long-term investment
Coral India Finance: Buy for medium to long-term investmentIndiaNotes.com
 
PFC Q4FY15: Surplus scenario likely to continue for next three years
PFC Q4FY15: Surplus scenario likely to continue for next three yearsPFC Q4FY15: Surplus scenario likely to continue for next three years
PFC Q4FY15: Surplus scenario likely to continue for next three yearsIndiaNotes.com
 
Research report first source solution
Research report first source solutionResearch report first source solution
Research report first source solutionPreeti Srivastava
 
SKS Microfinance: Q4 net profit grows a whopping 49.50%; Buy
SKS Microfinance: Q4 net profit grows a whopping 49.50%; BuySKS Microfinance: Q4 net profit grows a whopping 49.50%; Buy
SKS Microfinance: Q4 net profit grows a whopping 49.50%; BuyIndiaNotes.com
 
Firstcall recommend this banking scrip on a strong Q4FY15
Firstcall recommend this banking scrip on a strong Q4FY15Firstcall recommend this banking scrip on a strong Q4FY15
Firstcall recommend this banking scrip on a strong Q4FY15IndiaNotes.com
 
2016년 2분기 ir 자료 en
2016년 2분기 ir 자료 en2016년 2분기 ir 자료 en
2016년 2분기 ir 자료 enHyundai Finance
 
2016년 2분기 ir 자료 캐피탈en
2016년 2분기 ir 자료 캐피탈en2016년 2분기 ir 자료 캐피탈en
2016년 2분기 ir 자료 캐피탈enHyundai Finance
 
Q2FY15: Hold Federal Bank for a target of Rs156 - Sushil Finance
Q2FY15: Hold Federal Bank for a target of Rs156 - Sushil FinanceQ2FY15: Hold Federal Bank for a target of Rs156 - Sushil Finance
Q2FY15: Hold Federal Bank for a target of Rs156 - Sushil FinanceIndiaNotes.com
 
Buy Gruh Finance, CRISIL and ICRA rate Fixed Deposit programme as "AAA"
Buy Gruh Finance, CRISIL and ICRA rate Fixed Deposit programme as "AAA"Buy Gruh Finance, CRISIL and ICRA rate Fixed Deposit programme as "AAA"
Buy Gruh Finance, CRISIL and ICRA rate Fixed Deposit programme as "AAA"IndiaNotes.com
 
Capital First: Q4FY15 net profit up 22.28% y/y to Rs. 364.73 mn; Buy
Capital First: Q4FY15 net profit up 22.28% y/y to Rs. 364.73 mn; BuyCapital First: Q4FY15 net profit up 22.28% y/y to Rs. 364.73 mn; Buy
Capital First: Q4FY15 net profit up 22.28% y/y to Rs. 364.73 mn; BuyIndiaNotes.com
 
CEAT ltd. Equity Research
CEAT ltd. Equity ResearchCEAT ltd. Equity Research
CEAT ltd. Equity ResearchBhagwati Maurya
 
Management of banks & financial institutions
Management of banks & financial institutionsManagement of banks & financial institutions
Management of banks & financial institutionsArpanKhanna3
 
Firstcall recommends a textile stock for the mid- to long-term
Firstcall recommends a textile stock for the mid- to long-termFirstcall recommends a textile stock for the mid- to long-term
Firstcall recommends a textile stock for the mid- to long-termIndiaNotes.com
 

Similaire à Firstcall can fin_homes_ltd_29_july15 (20)

DHFC sales & profit accelerate in third quarter FY15, buy
 DHFC sales & profit accelerate in third quarter FY15, buy DHFC sales & profit accelerate in third quarter FY15, buy
DHFC sales & profit accelerate in third quarter FY15, buy
 
Dewan Housing Finance: Net profit jumps 14.96% in Q4; Maintain buy
Dewan Housing Finance: Net profit jumps 14.96% in Q4; Maintain buyDewan Housing Finance: Net profit jumps 14.96% in Q4; Maintain buy
Dewan Housing Finance: Net profit jumps 14.96% in Q4; Maintain buy
 
Bajaj Finance Q1FY15: Net profit jumps to Rs2113.60 mn, up 20.27%; Buy
Bajaj Finance Q1FY15: Net profit jumps to Rs2113.60 mn, up 20.27%; BuyBajaj Finance Q1FY15: Net profit jumps to Rs2113.60 mn, up 20.27%; Buy
Bajaj Finance Q1FY15: Net profit jumps to Rs2113.60 mn, up 20.27%; Buy
 
GIC Housing Finance's surplus scenario likely to continue for next three year...
GIC Housing Finance's surplus scenario likely to continue for next three year...GIC Housing Finance's surplus scenario likely to continue for next three year...
GIC Housing Finance's surplus scenario likely to continue for next three year...
 
Edelweiss Financial Services: Q4FY15 operating profit up 77.56% y/y; Buy
Edelweiss Financial Services: Q4FY15 operating profit up 77.56% y/y; BuyEdelweiss Financial Services: Q4FY15 operating profit up 77.56% y/y; Buy
Edelweiss Financial Services: Q4FY15 operating profit up 77.56% y/y; Buy
 
Coral India Finance: Buy for medium to long-term investment
Coral India Finance: Buy for medium to long-term investmentCoral India Finance: Buy for medium to long-term investment
Coral India Finance: Buy for medium to long-term investment
 
PFC Q4FY15: Surplus scenario likely to continue for next three years
PFC Q4FY15: Surplus scenario likely to continue for next three yearsPFC Q4FY15: Surplus scenario likely to continue for next three years
PFC Q4FY15: Surplus scenario likely to continue for next three years
 
Research report first source solution
Research report first source solutionResearch report first source solution
Research report first source solution
 
SKS Microfinance: Q4 net profit grows a whopping 49.50%; Buy
SKS Microfinance: Q4 net profit grows a whopping 49.50%; BuySKS Microfinance: Q4 net profit grows a whopping 49.50%; Buy
SKS Microfinance: Q4 net profit grows a whopping 49.50%; Buy
 
Hcs e
Hcs eHcs e
Hcs e
 
Firstcall recommend this banking scrip on a strong Q4FY15
Firstcall recommend this banking scrip on a strong Q4FY15Firstcall recommend this banking scrip on a strong Q4FY15
Firstcall recommend this banking scrip on a strong Q4FY15
 
TEA FN A 7.2 FM Trident Ltd..pptx
TEA FN A 7.2 FM Trident Ltd..pptxTEA FN A 7.2 FM Trident Ltd..pptx
TEA FN A 7.2 FM Trident Ltd..pptx
 
2016년 2분기 ir 자료 en
2016년 2분기 ir 자료 en2016년 2분기 ir 자료 en
2016년 2분기 ir 자료 en
 
2016년 2분기 ir 자료 캐피탈en
2016년 2분기 ir 자료 캐피탈en2016년 2분기 ir 자료 캐피탈en
2016년 2분기 ir 자료 캐피탈en
 
Q2FY15: Hold Federal Bank for a target of Rs156 - Sushil Finance
Q2FY15: Hold Federal Bank for a target of Rs156 - Sushil FinanceQ2FY15: Hold Federal Bank for a target of Rs156 - Sushil Finance
Q2FY15: Hold Federal Bank for a target of Rs156 - Sushil Finance
 
Buy Gruh Finance, CRISIL and ICRA rate Fixed Deposit programme as "AAA"
Buy Gruh Finance, CRISIL and ICRA rate Fixed Deposit programme as "AAA"Buy Gruh Finance, CRISIL and ICRA rate Fixed Deposit programme as "AAA"
Buy Gruh Finance, CRISIL and ICRA rate Fixed Deposit programme as "AAA"
 
Capital First: Q4FY15 net profit up 22.28% y/y to Rs. 364.73 mn; Buy
Capital First: Q4FY15 net profit up 22.28% y/y to Rs. 364.73 mn; BuyCapital First: Q4FY15 net profit up 22.28% y/y to Rs. 364.73 mn; Buy
Capital First: Q4FY15 net profit up 22.28% y/y to Rs. 364.73 mn; Buy
 
CEAT ltd. Equity Research
CEAT ltd. Equity ResearchCEAT ltd. Equity Research
CEAT ltd. Equity Research
 
Management of banks & financial institutions
Management of banks & financial institutionsManagement of banks & financial institutions
Management of banks & financial institutions
 
Firstcall recommends a textile stock for the mid- to long-term
Firstcall recommends a textile stock for the mid- to long-termFirstcall recommends a textile stock for the mid- to long-term
Firstcall recommends a textile stock for the mid- to long-term
 

Plus de IndiaNotes.com

Fce glaxo smithkline_12aug15
Fce glaxo smithkline_12aug15Fce glaxo smithkline_12aug15
Fce glaxo smithkline_12aug15IndiaNotes.com
 
GSK Consumer: Horlicks strengthens its position as No.1 brand across India
GSK Consumer: Horlicks strengthens its position as No.1 brand across IndiaGSK Consumer: Horlicks strengthens its position as No.1 brand across India
GSK Consumer: Horlicks strengthens its position as No.1 brand across IndiaIndiaNotes.com
 
Hester Biosciences gets manufacturing licence for 2 additional poultry vaccines
Hester Biosciences gets manufacturing licence for 2 additional poultry vaccinesHester Biosciences gets manufacturing licence for 2 additional poultry vaccines
Hester Biosciences gets manufacturing licence for 2 additional poultry vaccinesIndiaNotes.com
 
Vidhi Dyestuffs: To keep its growth story in the coming quarters also
Vidhi Dyestuffs: To keep its growth story in the coming quarters alsoVidhi Dyestuffs: To keep its growth story in the coming quarters also
Vidhi Dyestuffs: To keep its growth story in the coming quarters alsoIndiaNotes.com
 
Apollo Tyres approves further expansion of the Truck & Bus radial tyre capacity
Apollo Tyres approves further expansion of the Truck & Bus radial tyre capacityApollo Tyres approves further expansion of the Truck & Bus radial tyre capacity
Apollo Tyres approves further expansion of the Truck & Bus radial tyre capacityIndiaNotes.com
 
Grasim Industries reports improved performance in Q1FY16
Grasim Industries reports improved performance in Q1FY16Grasim Industries reports improved performance in Q1FY16
Grasim Industries reports improved performance in Q1FY16IndiaNotes.com
 
Cummins India: No interest burden being free from long-term or short-term debt
Cummins India: No interest burden being free from long-term or short-term debtCummins India: No interest burden being free from long-term or short-term debt
Cummins India: No interest burden being free from long-term or short-term debtIndiaNotes.com
 
Buy Makers Laboratories, company growing rapidly with strong thrust on brande...
Buy Makers Laboratories, company growing rapidly with strong thrust on brande...Buy Makers Laboratories, company growing rapidly with strong thrust on brande...
Buy Makers Laboratories, company growing rapidly with strong thrust on brande...IndiaNotes.com
 
Buy Multibase India, globalisation of the auto component sector to benefit th...
Buy Multibase India, globalisation of the auto component sector to benefit th...Buy Multibase India, globalisation of the auto component sector to benefit th...
Buy Multibase India, globalisation of the auto component sector to benefit th...IndiaNotes.com
 
Orient Cement: Best placed to benefit from demand revival in AP & Telengana r...
Orient Cement: Best placed to benefit from demand revival in AP & Telengana r...Orient Cement: Best placed to benefit from demand revival in AP & Telengana r...
Orient Cement: Best placed to benefit from demand revival in AP & Telengana r...IndiaNotes.com
 
Canara Bank's operating performance to improve in remaining 9MFY16E
Canara Bank's operating performance to improve in remaining 9MFY16ECanara Bank's operating performance to improve in remaining 9MFY16E
Canara Bank's operating performance to improve in remaining 9MFY16EIndiaNotes.com
 
Buy Jenburkt Pharmaceuticals; government's amended FDI policy to cover medica...
Buy Jenburkt Pharmaceuticals; government's amended FDI policy to cover medica...Buy Jenburkt Pharmaceuticals; government's amended FDI policy to cover medica...
Buy Jenburkt Pharmaceuticals; government's amended FDI policy to cover medica...IndiaNotes.com
 
Hexaware Technologies adds 9 clients in Q2CY15, Buy
Hexaware Technologies adds 9 clients in Q2CY15, BuyHexaware Technologies adds 9 clients in Q2CY15, Buy
Hexaware Technologies adds 9 clients in Q2CY15, BuyIndiaNotes.com
 
Nirmal pi industries_03_aug15
Nirmal pi industries_03_aug15Nirmal pi industries_03_aug15
Nirmal pi industries_03_aug15IndiaNotes.com
 
Indoco Remedies: Weak domestic growth offsets export revenues in Q1FY16; Hold
Indoco Remedies: Weak domestic growth offsets export revenues in Q1FY16; HoldIndoco Remedies: Weak domestic growth offsets export revenues in Q1FY16; Hold
Indoco Remedies: Weak domestic growth offsets export revenues in Q1FY16; HoldIndiaNotes.com
 
PI Industries: Custom synthesis exports deliver growth of ~26% in Q1FY16; Buy
PI Industries: Custom synthesis exports deliver growth of ~26% in Q1FY16; BuyPI Industries: Custom synthesis exports deliver growth of ~26% in Q1FY16; Buy
PI Industries: Custom synthesis exports deliver growth of ~26% in Q1FY16; BuyIndiaNotes.com
 
Torrent Pharma Q1FY16: IndiaNivesh maintain 'buy' for an upgraded price target
Torrent Pharma Q1FY16: IndiaNivesh maintain 'buy' for an upgraded price targetTorrent Pharma Q1FY16: IndiaNivesh maintain 'buy' for an upgraded price target
Torrent Pharma Q1FY16: IndiaNivesh maintain 'buy' for an upgraded price targetIndiaNotes.com
 

Plus de IndiaNotes.com (20)

Fce glaxo smithkline_12aug15
Fce glaxo smithkline_12aug15Fce glaxo smithkline_12aug15
Fce glaxo smithkline_12aug15
 
GSK Consumer: Horlicks strengthens its position as No.1 brand across India
GSK Consumer: Horlicks strengthens its position as No.1 brand across IndiaGSK Consumer: Horlicks strengthens its position as No.1 brand across India
GSK Consumer: Horlicks strengthens its position as No.1 brand across India
 
GSK Consumer: Horlicks strengthens its position as No.1 brand across India
GSK Consumer: Horlicks strengthens its position as No.1 brand across IndiaGSK Consumer: Horlicks strengthens its position as No.1 brand across India
GSK Consumer: Horlicks strengthens its position as No.1 brand across India
 
Hester Biosciences gets manufacturing licence for 2 additional poultry vaccines
Hester Biosciences gets manufacturing licence for 2 additional poultry vaccinesHester Biosciences gets manufacturing licence for 2 additional poultry vaccines
Hester Biosciences gets manufacturing licence for 2 additional poultry vaccines
 
Vidhi Dyestuffs: To keep its growth story in the coming quarters also
Vidhi Dyestuffs: To keep its growth story in the coming quarters alsoVidhi Dyestuffs: To keep its growth story in the coming quarters also
Vidhi Dyestuffs: To keep its growth story in the coming quarters also
 
Apollo Tyres approves further expansion of the Truck & Bus radial tyre capacity
Apollo Tyres approves further expansion of the Truck & Bus radial tyre capacityApollo Tyres approves further expansion of the Truck & Bus radial tyre capacity
Apollo Tyres approves further expansion of the Truck & Bus radial tyre capacity
 
Grasim Industries reports improved performance in Q1FY16
Grasim Industries reports improved performance in Q1FY16Grasim Industries reports improved performance in Q1FY16
Grasim Industries reports improved performance in Q1FY16
 
Cummins India: No interest burden being free from long-term or short-term debt
Cummins India: No interest burden being free from long-term or short-term debtCummins India: No interest burden being free from long-term or short-term debt
Cummins India: No interest burden being free from long-term or short-term debt
 
Buy Makers Laboratories, company growing rapidly with strong thrust on brande...
Buy Makers Laboratories, company growing rapidly with strong thrust on brande...Buy Makers Laboratories, company growing rapidly with strong thrust on brande...
Buy Makers Laboratories, company growing rapidly with strong thrust on brande...
 
Buy Multibase India, globalisation of the auto component sector to benefit th...
Buy Multibase India, globalisation of the auto component sector to benefit th...Buy Multibase India, globalisation of the auto component sector to benefit th...
Buy Multibase India, globalisation of the auto component sector to benefit th...
 
Orient Cement: Best placed to benefit from demand revival in AP & Telengana r...
Orient Cement: Best placed to benefit from demand revival in AP & Telengana r...Orient Cement: Best placed to benefit from demand revival in AP & Telengana r...
Orient Cement: Best placed to benefit from demand revival in AP & Telengana r...
 
Canara Bank's operating performance to improve in remaining 9MFY16E
Canara Bank's operating performance to improve in remaining 9MFY16ECanara Bank's operating performance to improve in remaining 9MFY16E
Canara Bank's operating performance to improve in remaining 9MFY16E
 
Nirmal lupin 06_aug15
Nirmal lupin 06_aug15Nirmal lupin 06_aug15
Nirmal lupin 06_aug15
 
Buy Jenburkt Pharmaceuticals; government's amended FDI policy to cover medica...
Buy Jenburkt Pharmaceuticals; government's amended FDI policy to cover medica...Buy Jenburkt Pharmaceuticals; government's amended FDI policy to cover medica...
Buy Jenburkt Pharmaceuticals; government's amended FDI policy to cover medica...
 
Hexaware Technologies adds 9 clients in Q2CY15, Buy
Hexaware Technologies adds 9 clients in Q2CY15, BuyHexaware Technologies adds 9 clients in Q2CY15, Buy
Hexaware Technologies adds 9 clients in Q2CY15, Buy
 
Nirmal pi industries_03_aug15
Nirmal pi industries_03_aug15Nirmal pi industries_03_aug15
Nirmal pi industries_03_aug15
 
Indoco Remedies: Weak domestic growth offsets export revenues in Q1FY16; Hold
Indoco Remedies: Weak domestic growth offsets export revenues in Q1FY16; HoldIndoco Remedies: Weak domestic growth offsets export revenues in Q1FY16; Hold
Indoco Remedies: Weak domestic growth offsets export revenues in Q1FY16; Hold
 
Fce thermax 31_jul15
Fce thermax 31_jul15Fce thermax 31_jul15
Fce thermax 31_jul15
 
PI Industries: Custom synthesis exports deliver growth of ~26% in Q1FY16; Buy
PI Industries: Custom synthesis exports deliver growth of ~26% in Q1FY16; BuyPI Industries: Custom synthesis exports deliver growth of ~26% in Q1FY16; Buy
PI Industries: Custom synthesis exports deliver growth of ~26% in Q1FY16; Buy
 
Torrent Pharma Q1FY16: IndiaNivesh maintain 'buy' for an upgraded price target
Torrent Pharma Q1FY16: IndiaNivesh maintain 'buy' for an upgraded price targetTorrent Pharma Q1FY16: IndiaNivesh maintain 'buy' for an upgraded price target
Torrent Pharma Q1FY16: IndiaNivesh maintain 'buy' for an upgraded price target
 

Firstcall can fin_homes_ltd_29_july15

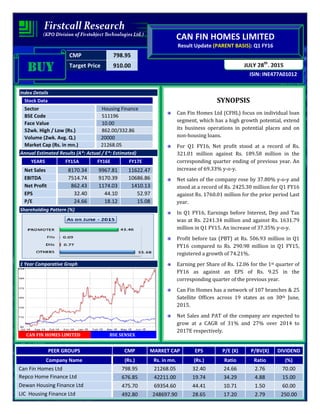
  • 1. CMP 798.95 Target Price 910.00 ISIN: INE477A01012 JULY 28th , 2015 CAN FIN HOMES LIMITED Result Update (PARENT BASIS): Q1 FY16 BUYBUYBUYBUY Index Details Stock Data Sector Housing Finance BSE Code 511196 Face Value 10.00 52wk. High / Low (Rs.) 862.00/332.86 Volume (2wk. Avg. Q.) 20000 Market Cap (Rs. in mn.) 21268.05 Annual Estimated Results (A*: Actual / E*: Estimated) YEARS FY15A FY16E FY17E Net Sales 8170.34 9967.81 11622.47 EBITDA 7514.74 9170.39 10686.86 Net Profit 862.43 1174.03 1410.13 EPS 32.40 44.10 52.97 P/E 24.66 18.12 15.08 Shareholding Pattern (%) 1 Year Comparative Graph CAN FIN HOMES LIMITED BSE SENSEX SYNOPSIS Can Fin Homes Ltd (CFHL) focus on individual loan segment, which has a high growth potential, extend its business operations in potential places and on non-housing loans. For Q1 FY16, Net profit stood at a record of Rs. 321.01 million against Rs. 189.58 million in the corresponding quarter ending of previous year. An increase of 69.33% y-o-y. Net sales of the company rose by 37.80% y-o-y and stood at a record of Rs. 2425.30 million for Q1 FY16 against Rs. 1760.01 million for the prior period Last year. In Q1 FY16, Earnings before Interest, Dep and Tax was at Rs. 2241.34 million and against Rs. 1631.79 million in Q1 FY15. An increase of 37.35% y-o-y. Profit before tax (PBT) at Rs. 506.93 million in Q1 FY16 compared to Rs. 290.98 million in Q1 FY15, registered a growth of 74.21%. Earning per Share of Rs. 12.06 for the 1st quarter of FY16 as against an EPS of Rs. 9.25 in the corresponding quarter of the previous year. Can Fin Homes has a network of 107 branches & 25 Satellite Offices across 19 states as on 30th June, 2015. Net Sales and PAT of the company are expected to grow at a CAGR of 31% and 27% over 2014 to 2017E respectively. PEER GROUPS CMP MARKET CAP EPS P/E (X) P/BV(X) DIVIDEND Company Name (Rs.) Rs. in mn. (Rs.) Ratio Ratio (%) Can Fin Homes Ltd 798.95 21268.05 32.40 24.66 2.76 70.00 Repco Home Finance Ltd 676.85 42211.00 19.74 34.29 4.88 15.00 Dewan Housing Finance Ltd 475.70 69354.60 44.41 10.71 1.50 60.00 LIC Housing Finance Ltd 492.80 248697.90 28.65 17.20 2.79 250.00
  • 2. Analysis & Recommendation - ‘BUY’ For the quarter ended 30th June 2015, Can Fin Homes Ltd reported its net sales of Rs. 2425.30 million against Rs. 1760.01 million in previous year period, which represents growth of 37.80% y-o-y. For Q1 FY16, EBITDA was Rs. 2241.34 million, an increase of 37.35% against Rs. 1631.79 million in Q1 FY15. The company earned profit after tax of Rs. 321.01 million, a growth of 69.33% y-o-y against Rs. 189.58 million in corresponding quarter of previous year. Profit before Tax (PBT) at Rs. 506.93 million in Q1 FY16 as against Rs. 290.98 million in Q1 FY15, registered a growth of 74.21% y-o-y. With a view to sustain and enhance its performance level, Company is offering a range of housing as well as non-housing products, with more emphasis on marketing and customer oriented business relationship. The real estate sector witnessed a good growth in the last few years. The demand for commercial property is being driven by the economic growth of the Country. As such, a sharp increase in demand for residential units and also commercial real estate are foreseen. The Company would continue to give a more focused attention for lending to individual loan segment, project loans and non-housing loans with an emphasis to further enhance its market share in the housing market segment. Over FY2014-17E, we expect the company to post a CAGR of 31% and 27% in its top-line and bottom-line respectively. Hence, we recommend ‘BUY’ for ‘CAN FIN HOMES LTD’ with a target price of Rs.910.00 for medium to long term investment. QUARTERLY HIGHLIGHTS (PARENT BASIS) Results updates- Q1 FY16, Can Fin Homes Ltd’s main business is to provide loans for the purchase and construction of residential houses, 88% of loans are retail Individual Housing Loans and reported its financial results for the quarter ended 30th June, 2015. Months June-15 June-14 % Change Net Sales 2425.30 1760.01 37.80 PAT 321.01 189.58 69.33 EPS 12.06 9.25 30.30 EBITDA 2241.34 1631.79 37.35 The company has achieved a turnover of Rs. 2425.30 million for the 1st quarter of the financial year 2016 as against Rs. 1760.01 million in the corresponding quarter of the previous year. In Q1 FY16, EBITDA stood at Rs. 2241.34 million and increase of 37.35% against the prior period previous year. In Q1 FY16, net profit of Rs. 321.01 million against Rs. 189.58 million in Q1 FY15. The company has reported an EPS of Rs. 12.06 for the 1st quarter as against an EPS of Rs. 9.25 in the corresponding quarter of the previous year.
  • 3. Break up of Expenditure During Q1 FY16, total Expenditure rose up by 44% per cent mainly on account of employee benefits expenses by 32% to Rs. 71.02 million against Rs. 53.70 million in Q1 FY15. In Q1 FY16 other Expenses increased by 52% and stood at Rs. 112.95 million against Rs. 74.51 million in Q1 FY15. Whereas Depreciation and amortization by 52% to Rs. 7.35 million in 1st quarter of FY16 from Rs. 4.83 million over the Corresponding quarter of previous year. Total expenditure in Q1 FY16 stood to Rs. 191.31 million as against Rs. 133.05 million in Q1 FY15. COMPANY PROFILE Can Fin Homes established in the year 1987, and is promoted by Canara Bank in association with reputed financial institutions including HDFC and UTI. The relevance of having an exclusive outfit for providing housing finance at a time when institutional finance was not flowing to the housing sector to the required extent and banks had constraints in locking up funds in long term housing finance saw the birth of CFHL. It was promoted in 1987, the "International Year for Shelter for the Homeless" by Canara Bank in association with reputed financial institutions including HDFC and UTI. Can Fin Homes is the first bank sponsored Housing Finance Company in India and one among the top players in the country's housing finance sector. The expertise gained by us in housing finance over the years gives us the confidence to come up to expectations. A unique personal touch in service makes us different from others. CFHL was set up with the mission of promoting home ownership and increasing housing stock all over the country. The housing finance company has a standing of over 27 years. It is one among the four HFCs selected by NHB in its first phase of securitization programme has an all-India presence with a network of 107 branches & 25 Satellite Offices in over 19 states as on 30th June, 2015.
  • 4. Business Areas Non Housing Loan • Personal Loan • Site Loan • Mortgage Loan • Loan against Property • Child Education Loan. Housing Loans • Loan for Rural Housing (LRH) • Housing Loan Individual • Home Loan for NRI. Deposit Scheme Can Fin Homes has the unique privilege of meeting the varied financial requirements of its customers, be it as a reliable home finance provider or as a competent fixed deposit accepting company. • Fixed Deposit • Cumulative Deposit • Fixed Deposit Scheme for Senior Citizen • Cumulative Deposit Scheme for Senior Citizen • Can fin Trust Fixed Deposit Scheme • Can fin Trust Cumulative Deposit Scheme. Recognitions • CFHL enjoys 5 Star rating from NHB for the purpose of refinance. • CFHL's Deposit programme enjoys 'MAA+' rating, which is the highest possible under high safety rating. Location & Branches • Chandigarh • Noida • Gurgaon • New Delhi • Jaipur • Luck now • Raipur • Patna • Ahmadabad • Bhopal • Indore • Vadodara • Bhubaneswar • Mumbai • Navi Mumbai • Pune • Hyderabad • Visakhapatnam • Vijayawada • Goa • Hubli • Davangere • Bangalore • Mangalore • Chennai • Hosur • Mysore • Pondicherry • Coimbatore • Calicut • Cochin • Trichy • Trichur • Madurai • Thiruvananthapuram.
  • 5. FINANCIAL HIGHLIGHT (PARENT BASIS) (A*- Actual, E* -Estimations & Rs. In Millions) Balance Sheet as at March 31, 2014A-2017E CAN FIN HOMES LTD. FY-14A FY-15A FY-16E FY-17E I EQUITY AND LIABILITES 1) Shareholder's Funds a) Capital 204.88 266.22 204.88 204.88 b) Reserves and Surplus 4318.17 7448.65 8938.38 10547.29 Sub -Total- Shareholder fund 4523.05 7714.87 9143.26 10752.17 2) Share application money pedding allotment 0.00 4.76 5.33 4.80 3) Non Current Liabilities a) Long- Term Borrowings 43287.95 54572.61 62976.79 71163.77 b) Differed Tax Liability 0.00 216.14 244.24 268.66 c) Long Term Provisions 407.59 539.41 0.00 0.00 Sub-Total -Non - Current liabilities 43695.54 55328.16 660.24 792.29 4) Current Liabilities a) Short Term Borrowings 3658.92 14836.56 19050.14 22860.17 b) Other Current Liabilities 6731.07 4755.65 5088.55 5495.63 c)Short Term Provisions 507.88 703.54 900.53 1035.61 Sub-Total - Current Liabilities 10897.87 20295.75 25039.22 29391.41 TOTAL-EQUITY AND LIABILITES (1 + 2 + 3+4) 59116.46 83343.54 98069.08 112373.10 II ASSETS 1) Non- Current Assets Fixed Assets i. Tangible Assets 78.16 92.77 108.54 124.82 ii. Capital work in progress 0.00 0.00 0.00 0.00 a) Total Fixed Assets 78.16 92.77 108.54 124.82 b) Non-Current Investment 149.35 149.35 149.35 149.35 c) Deferred Tax Assets 48.65 0.00 0.00 0.00 d) Long Term Loans & Advances 58306.15 82069.75 96514.03 110576.12 Sub -Total- Non- Current Assets 58582.31 82311.87 96771.92 110850.29 2) Current Assets a) Cash & Cash Equivalents 91.54 80.02 86.42 95.06 b) Short- Term Loans and Advances 438.05 948.38 1207.96 1424.69 c) Other Current Assets 4.56 3.27 2.78 3.06 Sub -Total Current Assets 534.15 1031.67 1297.16 1522.81 TOTAL-ASSETS(1 + 2) 59116.46 83343.54 98069.08 112373.10
  • 6. Annual Profit & Loss Statement for the period of 2014A to 2017E Value(Rs.in.mn) FY-14A FY-15A FY-16E FY-17E Description 12m 12m 12m 12m Net Sales 5780.04 8170.34 9967.81 11622.47 Other Income 0.00 0.00 0.00 0.00 Total Income 5780.04 8170.34 9967.81 11622.47 Expenditure -463.51 -655.60 -797.43 -935.61 Operating Profit 5316.53 7514.74 9170.39 10686.86 Interest -4227.67 -6102.90 -7231.94 -8352.89 Gross profit 1088.86 1411.84 1938.45 2333.98 Depreciation -20.10 -37.32 -41.80 -45.54 Exceptional Items -2.24 0.00 0.00 0.00 Profit Before Tax 1066.52 1374.52 1896.65 2288.43 Tax -309.40 -512.09 -722.63 -878.30 Net Profit 757.12 862.43 1174.03 1410.13 Equity capital 204.85 266.20 266.20 266.20 Reserves 4318.17 7448.65 8938.38 10547.29 Face value 10.00 10.00 10.00 10.00 EPS 36.96 32.40 44.10 52.97 Quarterly Profit & Loss Statement for the period of 31st Dec, 2014 to 30th Sep, 2015E Value(Rs.in.mn) 31-Dec-14 31-Mar-15 30-Jun-15 30-Sep-15E Description 3m 3m 3m 3m Net sales 2155.23 2270.59 2425.30 2667.83 Other income 0.00 0.00 0.00 0.00 Total Income 2155.23 2270.59 2425.30 2667.83 Expenditure -145.04 -191.26 -183.96 -234.77 Operating profit 2010.19 2079.33 2241.34 2433.06 Interest -1600.33 -1676.04 -1727.06 -1892.86 Gross profit 409.86 403.29 514.28 540.20 Depreciation -9.99 -10.36 -7.35 -11.17 Profit Before Tax 399.87 392.93 506.93 529.03 Tax -140.37 -164.06 -185.92 -198.39 Net Profit 259.50 228.87 321.01 330.64 Equity capital 204.85 266.20 266.20 266.20 Face value 10.00 10.00 10.00 10.00 EPS 12.67 8.60 12.06 12.42
  • 7. Ratio Analysis Particulars FY-14A FY-15A FY-16E FY-17E EPS (Rs.) 36.96 32.40 44.10 52.97 EBITDA Margin (%) 91.98% 91.98% 92.00% 91.95% PBT Margin (%) 18.45% 16.82% 19.03% 19.69% PAT Margin (%) 13.10% 10.56% 11.78% 12.13% P/E Ratio (x) 21.62 24.66 18.12 15.08 ROE (%) 16.74% 11.18% 12.75% 13.04% ROCE (%) 10.37% 9.79% 10.10% 10.24% Debt Equity Ratio 10.38 9.00 8.91 8.70 EV/EBITDA (x) 11.89 12.06 11.25 10.78 Book Value (Rs.) 220.80 289.81 345.78 406.22 P/BV 3.62 2.76 2.31 1.97 Charts
  • 8. OUTLOOK AND CONCLUSION At the current market price of Rs. 798.95, the stock P/E ratio is at 18.12 x FY16E and 15.08 x FY17E respectively. Earning per share (EPS) of the company for the earnings for FY16E and FY17E is seen at Rs.44.10 and Rs.52.97 respectively. Net Sales and PAT of the company are expected to grow at a CAGR of 31% and 27% over 2014 to 2017E respectively. On the basis of EV/EBITDA, the stock trades at 11.25 x for FY16E and 10.10.78 x for FY17E. Price to Book Value of the stock is expected to be at 2.31 x and 1.97 x respectively for FY16E and FY17E. We recommend ‘BUY’ in this particular scrip with a target price of Rs.910.00 for Medium to Long term investment.
  • 9. INDUSTRY OVERVIEW Global Economy: The global economy continued to expand during 2014 at a moderate and uneven pace, as the prolonged recovery process fro the global financial crises was still saddled with unfinished post- crises adjustments. Global recovery was also hampered by some new challenges, including a number of unexpected shocks, such as heightened geographical conflicts in various areas of the world. Fiscal policy in the United States of America is expected to remain restrictive, but less severe than in 2014. Real federal government spending is forecast to decline by less than 1 per cent in 2015–2016. It is also assumed that the debt ceiling will be increased during the forecasting period. In the baseline outlook, developing countries as a group are expected to grow at 4.8 and 5.1 per cent in 2015 and 2016, respectively, up from the 4.3 per cent estimated for 2014. Growth in the least developed countries (LDCs) is expected to continue exceeding the global average, at 5.7 per cent in 2015 and 5.9 per cent in 2016. Among the developed economies, the economy of United States, after some erratic fluctuations in 2014, is expected to improve in 2015 and 2016, with GDP projected to expand by 2.8 and 3.1 per cent respectively. Economic growth in South Asia is set to gradually pick up from an estimated 4.9 per cent in 2014 to 5.4 per cent in 2015 and 5.7 per cent in 2016. While the recovery will be led by India, which accounts for about 70 per cent of regional output, other economies such as Bangladesh and the Islamic Republic of Iran are also projected to see stronger growth in the forecast period. Along with robust external demand, growth is expected to be underpinned by a moderate strengthening of domestic consumptions and investments as countries bebifit from improved macroeconomics conditions. Financial Services India has a diversified financial sector, which is undergoing rapid expansion. The sector comprises commercial banks, insurance companies, non-banking financial companies, co-operatives, pension funds, mutual funds and other smaller financial entities. The financial sector in India is predominantly a banking sector with commercial banks accounting for more than 60 per cent of the total assets held by the financial system. India's services sector has always served the country’s economy well, accounting for about 57 per cent of the gross domestic product (GDP). In this regard, the financial services sector has been an important contributor. The Government of India has introduced reforms to liberalise, regulate and enhance this industry. At present, India is undoubtedly one of the world's most vibrant capital markets. Challenges remain, but the future of the sector looks good. The advent of technology has also aided the growth of the industry. About 75 per cent of the
  • 10. insurance policies sold by 2020 would, in one way or another, be influenced by digital channels during the pre- purchase, purchase or renewal stages, as per a report by Boston Consulting Group (BCG) and Google India. Market Size The size of banking assets in India reached US$ 1.8 trillion in FY14 and is expected to touch US$ 28.5 trillion by FY25. The Association of Mutual Funds in India (AMFI) data show that assets of the mutual fund industry have hit an all-time high of about Rs 12 trillion (US$ 189.83 billion). Equity funds had inflows of Rs 52170.00 mn (US$ 825.49 million), taking total inflows on a year-to-date basis to Rs 610890.00 mn (US$ 9.66 billion). Income funds and liquid funds account for the largest proportion of AUM, with Income funds accounting for Rs 5.22 trillion (US$ 82.59 billion) and equity funds accounting for Rs 3.06 trillion (US$ 48.41 billion). Government Initiatives Several measures have been outlined in the Union Budget 2014-15 that aim at reviving and accelerating investment which, inter alia, include fiscal consolidation with emphasis on expenditure reforms and continuation of fiscal reforms with rationalization of tax structure; fillip to industry and infrastructure, fiscal incentives and concrete measures for transport, power, and other urban and rural infrastructure; measures for promotion of foreign direct investment (FDI) in selected sectors, including defence manufacturing and insurance; and, steps to augment low cost long-term foreign borrowings by Indian companies. Fiscal reforms have been bolstered further by the recent deregulation of diesel prices. The launch of ‘Make in India’ global initiative is intended to invite both domestic and foreign investors to invest in India. The aim of the programme is to project India as an investment destination and develop, promote and market India as a leading manufacturing destination and as a hub for design and information. The programme further aims to radically improve the Ease of Doing Business, open FDI regime, improve the quality of infrastructure and make India a globally competitive manufacturing destination. Disclaimer: This document is prepared by our research analysts and it does not constitute an offer or solicitation for the purchase or sale of any financial instrument or as an official confirmation of any transaction. The information contained herein is from publicly available data or other sources believed to be reliable but we do not represent that it is accurate or complete and it should not be relied on as such. Firstcall Research or any of its affiliates shall not be in any way responsible for any loss or damage that may arise to any person from any inadvertent error in the information contained in this report. Firstcall Research and/ or its affiliates and/or employees will not be liable for the recipients’ investment decision based on this document.
  • 11. Firstcall India Equity Research: Email – info@firstobjectindia.com C.V.S.L.Kameswari Pharma & Diversified U. Janaki Rao Capital Goods B. Anil Kumar Auto, IT & FMCG M. Vinayak Rao Diversified G. Amarender Diversified Firstcall Research Provides Industry Research on all the Sectors and Equity Research on Major Companies forming part of Listed and Unlisted Segments For Further Details Contact: Tel.: 022-2527 2510/2527 6077 / 25276089 Telefax: 022-25276089 040-20000235 /20000233 E-mail: info@firstobjectindia.com www.firstcallresearch.com