Sunil Hitech Engineers bags major government contracts; Buy
•
1 j'aime•235 vues

Firstcall recommend Sunil Hitech for TGT of 240; major government contract bagged

Recommandé
Recommandé
Contenu connexe
Tendances
Tendances (20)
Similaire à Sunil Hitech Engineers bags major government contracts; Buy
Similaire à Sunil Hitech Engineers bags major government contracts; Buy (20)
Plus de IndiaNotes.com
Plus de IndiaNotes.com (20)
Dernier
Dernier (20)
Sunil Hitech Engineers bags major government contracts; Buy
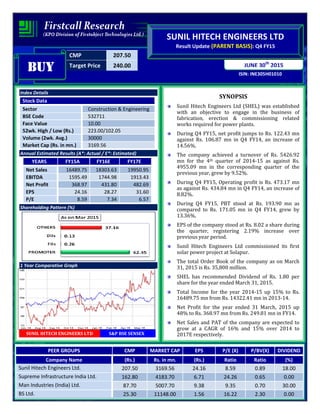
- 1. CMP 207.50 Target Price 240.00 ISIN: INE305H01010 JUNE 30th 2015 SUNIL HITECH ENGINEERS LTD Result Update (PARENT BASIS): Q4 FY15 BUYBUYBUYBUY Index Details Stock Data Sector Construction & Engineering BSE Code 532711 Face Value 10.00 52wk. High / Low (Rs.) 223.00/102.05 Volume (2wk. Avg.) 30000 Market Cap (Rs. in mn.) 3169.56 Annual Estimated Results (A*: Actual / E*: Estimated) YEARS FY15A FY16E FY17E Net Sales 16489.75 18303.63 19950.95 EBITDA 1595.49 1744.98 1913.43 Net Profit 368.97 431.80 482.69 EPS 24.16 28.27 31.60 P/E 8.59 7.34 6.57 Shareholding Pattern (%) 1 Year Comparative Graph SUNIL HITECH ENGINEERS LTD S&P BSE SENSEX SYNOPSIS Sunil Hitech Engineers Ltd (SHEL) was established with an objective to engage in the business of fabrication, erection & commissioning related works required for power plants. During Q4 FY15, net profit jumps to Rs. 122.43 mn against Rs. 106.87 mn in Q4 FY14, an increase of 14.56%. The company achieved a turnover of Rs. 5426.92 mn for the 4th quarter of 2014-15 as against Rs. 4955.09 mn in the corresponding quarter of the previous year, grew by 9.52%. During Q4 FY15, Operating profit is Rs. 473.17 mn as against Rs. 434.84 mn in Q4 FY14, an increase of 8.82%. During Q4 FY15, PBT stood at Rs. 193.90 mn as compared to Rs. 171.05 mn in Q4 FY14, grew by 13.36%. EPS of the company stood at Rs. 8.02 a share during the quarter, registering 2.19% increase over previous year period. Sunil Hitech Engineers Ltd commissioned its first solar power project at Solapur. The total Order Book of the company as on March 31, 2015 is Rs. 35,800 million. SHEL has recommended Dividend of Rs. 1.80 per share for the year ended March 31, 2015. Total Income for the year 2014-15 up 15% to Rs. 16489.75 mn from Rs. 14322.41 mn in 2013-14. Net Profit for the year ended 31 March, 2015 up 48% to Rs. 368.97 mn from Rs. 249.81 mn in FY14. Net Sales and PAT of the company are expected to grow at a CAGR of 16% and 15% over 2014 to 2017E respectively. PEER GROUPS CMP MARKET CAP EPS P/E (X) P/BV(X) DIVIDEND Company Name (Rs.) Rs. in mn. (Rs.) Ratio Ratio (%) Sunil Hitech Engineers Ltd. 207.50 3169.56 24.16 8.59 0.89 18.00 Supreme Infrastructure India Ltd. 162.80 4183.70 6.71 24.26 0.65 0.00 Man Industries (India) Ltd. 87.70 5007.70 9.38 9.35 0.70 30.00 BS Ltd. 25.30 11148.00 1.56 16.22 2.30 0.00
- 2. QUARTERLY HIGHLIGHTS (PARENT BASIS) Results updates- Q4 FY15, Months Mar-15 Mar-14 % Change Net Sales 5426.92 4955.09 9.52 PAT 122.43 106.87 14.56 EPS 8.02 7.84 2.19 EBITDA 473.17 434.84 8.82 The company net profit jumps to Rs. 122.43 million against Rs. 106.87 million in the corresponding quarter ending of previous year, an increase of 14.56%. The company achieved a turnover of Rs. 5426.92 million for the 4th quarter of the financial year 2014-15 as against Rs. 4955.09 millions in the corresponding quarter of the previous year. Reported earnings per share of the company stood at Rs. 8.02 a share during the quarter, registering 2.19% increase over previous year period. Profit before interest, depreciation and tax is Rs. 473.17 millions as against Rs. 434.84 millions in the corresponding period of the previous year. Break up of Expenditure Particulars Rs. Million Q4 FY15 Q4 FY14 Cost of Material Consumed 1349.59 1366.52 Employee Benefit Expenses 145.70 146.99 Depreciation & Amortization Expense 70.24 61.79 Other Expenses 99.63 116.68 Contract and site expenses 1375.96 1186.86 Purchase of stock in trade 2074.34 1730.31
- 3. Latest Updates • Sunil Hitech Engineers Limited (SHEL) commissioned its first solar power project at Solapur. • The total Order Book of the company as on March 31, 2015 is Rs. 35,800 million. • Sunil Hitech Engineers Ltd has recommended Dividend of Rs. 1.80 per share for the year ended March 31, 2015. • Sunil Hitech Engineers has bagged an order of Rs. 1220.2 million from the Ministry of Road Transport and Highways - Government of India for Rehabilitation and Upgrading to 2 lanes/2 lane with Paved shoulders configuration and strengthening of Madhugiri —Chikkaballapura — Mulbagal Section Road in the State of Karnataka. The work is expected to be executed in around 24 months. • The company has bagged a Rs. 900 million order from Kanpur Development Authority (KDA) for the construction and development work of houses in two different development areas of Kanpur. The company is expected to complete the execution of work in around 18 months. COMPANY PROFILE Incorporated in the year 1984, Sunil Hitech Engineers Ltd. (SHEL) has been promoted by first-gen promoter, Mr. Ratnakar. M. Gutte. The current operations are being handled majorly by Mr. Gutte’s son, Mr. Sunil Gutte. SHEL is well established player in EPC and Construction of Road & Bridges, Building works of institutions, hospitals and housing projects, cross country pipeline, civil & mechanical works of power and steel plants, cooling towers, chimneys, etc, also in renewable sector. SHEL has presence in 13 states and executing 30 plus projects in the country. Its major clients include NTPC, BHEL, L&T, JSW, Reliance, SAIL, Adani, Morth, PWD, Singareni Collieries Company Limited, KDA. The company recently engaged experts from the field on their board and is on the path of taking its renewable energy and Infra business at a higher level. Product and Services EPC/turnkey projects Civil Mechanical Transmission Distribution MANUFACTURING NDT O & M
- 4. FINANCIAL HIGHLIGHT (PARENT BASIS) (A*- Actual, E* -Estimations & Rs. In Millions) Balance Sheet as at March 31, 2014 -2017E FY14A FY15A FY16E FY17E EQUITY AND LIABILITIES Shareholders’ Funds: a) Share Capital 136.25 152.75 152.75 152.75 b) Reserves and Surplus 2991.98 3426.52 3852.82 4335.51 c) Money received against share warrants 30.11 61.63 67.80 73.22 A. Net worth 3158.34 3640.90 4073.36 4561.48 Non-Current Liabilities: a) Long-term borrowings 303.67 436.05 514.54 581.43 b) Other Long Term Liabilities 956.95 1144.41 1258.85 1359.56 c) Long Term Provisions 21.29 23.74 25.64 27.18 B. Non-Current Liabilities 1281.92 1604.20 1799.03 1968.16 Current Liabilities a) Short-term borrowings 3508.36 3362.86 3194.71 3098.87 b) Trade Payables 4955.93 4144.75 4393.43 4613.10 c) Other Current Liabilities 978.70 1205.06 1397.87 1565.61 d) Short Term Provisions 22.61 47.79 53.52 58.88 C. Current Liabilities 9465.61 8760.45 9039.54 9336.47 Total Liabilities (A+B+C) 13905.87 14005.55 14911.93 15866.11 ASSETS Non-Current Assets: a) Fixed Assets 1199.32 1422.05 1592.69 1736.04 b) Non Current Investments 356.84 499.70 564.66 621.13 c) Deferred tax assets 75.19 90.21 100.13 109.14 d) Long Term Loans and Advances 284.27 335.63 375.90 405.98 e) Other non-current assets 428.47 441.00 458.64 476.98 D. Non-Current Assets 2344.10 2788.58 3092.02 3349.26 Current Assets: a) Current Investments 2.50 0.00 0.00 0.00 b) Inventories 1395.09 1748.21 1992.96 2212.19 c) Trade Receivables 4734.25 3799.69 3951.68 4109.75 d) Cash and Bank Balances 832.02 898.50 943.42 981.16 e) Short Term Loans and Advances 1518.55 1807.48 2024.38 2189.99 f) Other Current Assets 3079.35 2963.08 2907.46 3023.76 E. Current Assets 11561.77 11216.97 11819.90 12516.85 Total Assets (D+E) 13905.87 14005.55 14911.93 15866.11
- 5. Annual Profit & Loss Statement for the period of 2014 to 2017E Value(Rs. mn) FY14A FY15A FY16E FY17E Description 12m 12m 12m 12m Net Sales 14322.41 16489.75 18303.63 19950.95 Other Income 99.36 162.73 170.87 177.70 Total Income 14421.77 16652.48 18474.49 20128.65 Expenditure -13003.03 -15057.00 -16729.52 -18215.22 Operating Profit 1418.74 1595.49 1744.98 1913.43 Interest -769.76 -778.57 -833.07 -899.71 Gross profit 648.98 816.92 911.91 1013.72 Depreciation -243.78 -258.59 -274.10 -293.29 Profit Before Tax 405.20 558.34 637.81 720.43 Tax -155.39 -189.37 -206.01 -237.74 Net Profit 249.81 368.97 431.80 482.69 Equity capital 136.25 152.75 152.75 152.75 Reserves 2986.40 3421.02 3852.82 4335.51 Face value 10.00 10.00 10.00 10.00 EPS 18.33 24.16 28.27 31.60 Quarterly Profit & Loss Statement for the period of 30th Sep, 2014 to 30th June, 2015E Value(Rs. mn) 30-Sep-14 31-Dec-14 31-Mar-15 30-Jun-15E Description 3m 3m 3m 3m Net Sales 3046.42 4171.93 5426.92 4558.61 Other income 22.93 18.40 91.49 77.76 Total Income 3069.35 4190.33 5518.40 4636.37 Expenditure -2718.68 -3827.13 -5045.23 -4177.97 Operating profit 350.67 363.20 473.17 458.41 Interest -191.89 -174.46 -209.04 -217.40 Gross profit 158.78 188.74 264.14 241.01 Depreciation -62.19 -64.69 -70.24 -74.45 Profit Before Tax 96.59 124.05 193.90 166.56 Tax -31.35 -33.08 -71.47 -55.46 Net Profit 65.24 90.97 122.43 111.09 Equity capital 152.75 152.75 152.75 152.75 Face value 10.00 10.00 10.00 10.00 EPS 4.27 5.96 8.02 7.27
- 6. Ratio Analysis Particulars FY14A FY15A FY16E FY17E EPS (Rs.) 18.33 24.16 28.27 31.60 EBITDA Margin (%) 9.91% 9.68% 9.53% 9.59% PBT Margin (%) 2.83% 3.39% 3.48% 3.61% PAT Margin (%) 1.74% 2.24% 2.36% 2.42% P/E Ratio (x) 11.32 8.59 7.34 6.57 ROE (%) 8.00% 10.32% 10.78% 10.75% ROCE (%) 23.97% 25.15% 26.17% 27.01% Debt Equity Ratio 1.22 1.06 0.93 0.82 EV/EBITDA (x) 4.09 3.80 3.40 3.07 Book Value (Rs.) 229.19 233.96 262.23 293.83 P/BV 0.91 0.89 0.79 0.71 Charts
- 7. OUTLOOK AND CONCLUSION At the current market price of Rs. 207.50, the stock P/E ratio is at 7.34 x FY16E and 6.57 x FY17E respectively. Earnings per share (EPS) of the company for the earnings for FY16E and FY17E are seen at Rs. 28.27 and Rs. 31.60 respectively. Net Sales and PAT of the company are expected to grow at a CAGR of 16% and 15% over 2014 to 2017E respectively. On the basis of EV/EBITDA, the stock trades at 3.40 x for FY16E and 3.07 x for FY17E. Price to Book Value of the stock is expected to be at 0.79 x and 0.71 x for FY16E and FY17E respectively. The company has ventured into Roads and Construction of buildings for Public Sector enterprise. It has been a great year for their new business in Projects segment as it received their first major project in Road EPC space. The company Buildings EPS business has received a prestigious order from Kanpur Development Authority, and Singreni colliery for housing, during FY15. Power Projects business continues to be strong with orders flowing in from prestigious clients like BHEL, NTPC, and others. SHEL commissioned its first solar power project at Solapur. The commissioning marks the foray into non conventional green energy projects. SHEL is committed to the green initiatives in the Power Sector. This experience will be extremely helpful to tap the huge EPC opportunity in the Solar space opening up recently in India. The Government vision is 100 GW of Solar power projects by 2022. The overall focus on EPC business will drive the future growth of the company. Hence, we recommend ‘BUY’ in this particular scrip with a target price of Rs. 240.00 for Medium to Long term investment.
- 8. INDUSTRY OVERVIEW A key driver of the economy, Infrastructure is highly responsible for propelling India’s overall development. The industry enjoys intense focus from the top officials of the Government for initiating policies that would ensure time-bound creation of world class infrastructure in the country. This sector includes power, bridges, dams, roads and urban infrastructure development. Market Size The Indian power sector has an investment potential of US$ 250 billion in the next 4-5 years, providing immense opportunities in power generation, distribution, transmission and equipment, according to Mr Piyush Goyal, Union minister of coal, power and renewable energy. The total approximate earnings from goods during 1st April 2014 – 31st December 2014 were Rs 77,161.55 crore (US$ 12.4 billion) compared to Rs 68,776.35 crore (US$ 11.05 billion) during the same period last year, registering an increase of 12.19 per cent. Foreign direct investment (FDI) received in construction development sector from April 2000 to January 2015 stood at US$ 24,028.19 million, according to the Department of Industrial Policy and Promotion (DIPP). Recent Developments India is witnessing significant interest from international investors in the infrastructure space. Many Spanish companies are keen on collaborating with India on infrastructure, high speed trains, renewable energy and developing smart cities • The government has unveiled plans to invest US$ 137 billion in its decrepit rail network over the next five years, heralding Prime Minister Narendra Modi's aggressive approach to building infrastructure needed to unlock faster economic growth. Over the next year, India will increase investment by about a half to US$ 16.15 billion including funds raised by market borrowing. • Union government-owned Kolkata Port Trust has signed an agreement with the West Bengal government to set up a new port at Sagar Island in South 24 Parganas district through a joint venture (JV) between the two. The Sagar Island port is estimated to cost Rs 11,900 crore (US$ 1.91 billion) and will be the first port to be built by the Union government in 14 years. • Larsen and Toubro Ltd (L&T) has announced that its building and factories business under L&T Construction has secured orders worth Rs 2,521 crore (US$ 405.27 million) in December 2014.
- 9. Government Initiatives The Indian Government is taking every possible initiative to boost the infrastructure sector. Some of the steps taken in the recent past are being discussed hereafter. The Reserve Bank of India (RBI) has notified 100 per cent foreign direct investment (FDI) under automatic route in the construction development sector. The new limit is effective 2 December 2014, RBI said in a notification on its website. Recently, the Government has relaxed rules for FDI in the construction sector by reducing minimum built-up area as well as capital requirement and liberalised the exit norms. The Cabinet has also approved the proposal to amend the FDI policy. India and the US have signed a memorandum of understanding (MoU) in order to establish Infrastructure Collaboration Platform The MoU’s scope envisages efforts in the areas of Urban Development, Commerce and Industry, Railways, Road Transport and Highways, Micro Small and Medium Enterprises, Power, New & Renewable Energy, Information and Broadcasting, Communications & Information Technology, Water Resources, River Development and Ganga Rejuvenation. Road Ahead India's growing population requires a robust infrastructure. The government, through a series of initiatives, is working on policies to attract significant investor interest. The Indian government plans to develop a total of 66,117 km of roads under different programmes such as National Highways Development Project (NHDP), Special Accelerated Road Development Programme in North East (SARDP-NE) and Left Wing Extremism (LWE), and has set an objective of building 30 km of road a day from 2016. Also, about two-thirds of NHDP road projects (ex-phase IV) have not been awarded as yet, thus offering a massive opportunity to private players in future. Disclaimer: This document is prepared by our research analysts and it does not constitute an offer or solicitation for the purchase or sale of any financial instrument or as an official confirmation of any transaction. The information contained herein is from publicly available data or other sources believed to be reliable but we do not represent that it is accurate or complete and it should not be relied on as such. Firstcall Research or any of its affiliates shall not be in any way responsible for any loss or damage that may arise to any person from any inadvertent error in the information contained in this report. Firstcall Research and/ or its affiliates and/or employees will not be liable for the recipients’ investment decision based on this document.
- 10. Firstcall India Equity Research: Email – info@firstobjectindia.com C.V.S.L.Kameswari Pharma & Diversified U. Janaki Rao Capital Goods B. Anil Kumar Auto, IT & FMCG M. Vinayak Rao Diversified G. Amarender Diversified Firstcall Research Provides Industry Research on all the Sectors and Equity Research on Major Companies forming part of Listed and Unlisted Segments For Further Details Contact: Tel.: 022-2527 2510/2527 6077 / 25276089 Telefax: 022-25276089 040-20000235 /20000233 E-mail: info@firstobjectindia.com www.firstcallresearch.com