Pidilite Ind: Reports 11% volume growth in a tough operating environment - Prabhudas Lilladher
•
1 like•266 views


Recommended
Recommended
More Related Content
What's hot
What's hot (20)
Similar to Pidilite Ind: Reports 11% volume growth in a tough operating environment - Prabhudas Lilladher
Similar to Pidilite Ind: Reports 11% volume growth in a tough operating environment - Prabhudas Lilladher (20)
More from IndiaNotes.com
More from IndiaNotes.com (20)
Recently uploaded
Recently uploaded (20)
Pidilite Ind: Reports 11% volume growth in a tough operating environment - Prabhudas Lilladher
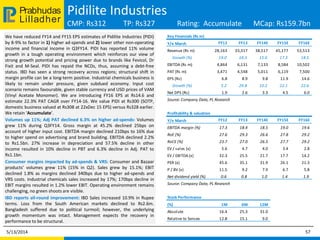
- 1. Lilladher Prabhudas Pidilite Industries CMP: Rs312 TP: Rs327 Rating: Accumulate MCap: Rs159.7bn We have reduced FY14 and FY15 EPS estimates of Pidilite Industries (PIDI) by 8-9% to factor in 1) higher ad-spends and 2) lower other non-operating income and financial income in Q3FY14. PIDI has reported 11% volume growth in a tough operating environment which reinforces our view of strong growth potential and pricing power due to brands like Fevicol, Dr Fixit and M-Seal. PIDI has repaid the NCDs, thus, assuming a debt-free status. IBD has seen a strong recovery across regions; structural shift in margin profile can be a long-term positive. Industrial chemicals business is likely to remain under pressure, given subdued economy. Input cost scenario remains favourable, given stable currency and USD prices of VAM (Vinyl Acetate Monomer). We are introducing FY16 EPS at Rs14.6 and estimate 22.3% PAT CAGR over FY14-16. We value PIDI at Rs300 (SOTP, domestic business valued at Rs308 at 22xDec 15 EPS) versus Rs328 earlier. We retain ‘Accumulate’. Volumes up 11%; Adj PAT declined 6.3% on higher ad-spends: Volumes grew 11% during Q3FY14. Gross margin at 45.2% declined 25bps on account of higher input cost. EBITDA margin declined 210bps to 16% due to higher spend on advertising and brand building. EBITDA declined 2.2% to Rs1.5bn. 27% increase in depreciation and 57.5% decline in other income resulted in 10% decline in PBT and 6.3% decline in Adj. PAT to Rs1.1bn. Consumer margins impacted by ad-spends & VRS: Consumer and Bazaar products’ volumes grew 11% (15% in Q2). Sales grew by 15.1%; EBIT declined 1.8% as margins declined 340bps due to higher ad-spends and VRS costs. Industrial chemicals sales increased by 17%; 170bps decline in EBIT margins resulted in 1.2% lower EBIT. Operating environment remains challenging, no green shoots are visible. IBD reports all-round improvement: IBD Sales increased 10.9% in Rupee terms. Loss from the South American markets declined to Rs2.6m. Bangladesh suffered due to political turmoil; however, the underlying growth momentum was intact. Management expects the recovery in performance to be structural. 5/13/2014 57 Key Financials (Rs m) Y/e March FY12 FY13 FY14E FY15E FY16E Revenue (Rs m) 28,163 33,317 38,517 45,177 53,513 Growth (%) 19.0 18.3 15.6 17.3 18.5 EBITDA (Rs m) 4,864 6,131 7,133 8,584 10,502 PAT (Rs m) 3,471 4,548 5,011 6,119 7,500 EPS (Rs) 6.8 8.9 9.8 11.9 14.6 Growth (%) 5.2 29.8 10.2 22.1 22.6 Net DPS (Rs) 1.9 2.6 3.3 4.5 6.0 Source: Company Data, PL Research Profitability & valuation Y/e March FY12 FY13 FY14E FY15E FY16E EBITDA margin (%) 17.3 18.4 18.5 19.0 19.6 RoE (%) 27.6 29.3 26.6 27.8 29.2 RoCE (%) 23.7 27.0 26.5 27.7 29.2 EV / sales (x) 5.6 4.7 4.0 3.4 2.8 EV / EBITDA (x) 32.3 25.5 21.7 17.7 14.2 PER (x) 45.6 35.1 31.9 26.1 21.3 P / BV (x) 11.5 9.2 7.9 6.7 5.8 Net dividend yield (%) 0.6 0.8 1.0 1.4 1.9 Source: Company Data, PL Research Stock Performance (%) 1M 6M 12M Absolute 16.4 25.3 31.0 Relative to Sensex 12.8 15.1 9.0
- 2. Lilladher Prabhudas Financials Pidilite Industries 5/13/2014 58 Income Statement (Rs m) Y/e March FY12 FY13 FY14E FY15E FY16E Net Revenue 28,163 33,317 38,517 45,177 53,513 Direct Expenses 20,688 24,175 27,863 32,507 38,305 % of Net Sales 73.5 72.6 72.3 72.0 71.6 Employee Cost 2,612 3,010 3,522 4,086 4,707 % of Net Sales 9.3 9.0 9.1 9.0 8.8 SG&A Expenses - - - - - % of Net Sales 0.0 0.0 0.0 0.0 0.0 Other Expenses - - - - - % of Net Sales 0.0 0.0 0.0 0.0 0.0 EBITDA 4,864 6,131 7,133 8,584 10,502 Margin (%) 17.3 18.4 18.5 19.0 19.6 Depreciation 479 532 638 721 809 PBIT 4,385 5,599 6,494 7,863 9,693 Interest Expenses 245 122 111 45 45 PBT 4,567 6,136 6,864 8,498 10,563 Total tax 1,096 1,588 1,853 2,379 3,063 Effective Tax rate (%) 24.0 25.9 27.0 28.0 29.0 PAT 3,345 4,608 4,933 6,119 7,500 Extraordinary Gain/(Loss) (126) 59 (78) - - Adjusted PAT 3,471 4,548 5,011 6,119 7,500 Source: Company Data, PL Research Balance Sheet (Rs m) Y/e March FY12 FY13 FY14E FY15E FY16E Share Capital 508 513 513 513 513 Reserves & Surplus 13,209 16,812 19,795 23,215 27,116 Shareholder's Fund 13,717 17,324 20,308 23,728 27,629 Preference Share Capital - - - - - Total Debt 2,641 602 200 100 100 Other Liabilities(net) - - - - - Deferred Tax Liability 454 484 434 384 334 Total Liabilities 16,812 18,410 20,941 24,211 28,062 Gross Block 9,723 10,607 12,607 14,107 15,857 Less: Depreciation 4,764 5,270 5,908 6,630 7,439 Net Block 4,959 5,337 6,699 7,477 8,418 Capital Work in Progress 3,713 4,087 4,187 4,287 4,387 Cash & Cash Equivalent 5,905 6,838 7,975 10,387 13,223 Total Current Assets 11,913 13,337 15,765 19,829 24,750 Total Current Liabilities 6,193 6,974 8,446 10,219 12,429 Net Current Assets 5,719 6,363 7,319 9,610 12,320 Other Assets 1 (0) (0) (0) (0) Total Assets 16,812 18,410 20,941 24,211 28,062 Source: Company Data, PL Research
- 3. Lilladher Prabhudas Disclaimer 5/13/2014 80 BUY : Over 15% Outperformance to Sensex over 12-months Accumulate : Outperformance to Sensex over 12-months Reduce : Underperformance to Sensex over 12-months Sell : Over 15% underperformance to Sensex over 12-months Trading Buy : Over 10% absolute upside in 1-month Trading Sell : Over 10% absolute decline in 1-month Not Rated (NR) : No specific call on the stock Under Review (UR) : Rating likely to change shortly This document has been prepared by the Research Division of Prabhudas Lilladher Pvt. Ltd. Mumbai, India (PL) and is meant for use by the recipient only as information and is not for circulation. This document is not to be reported or copied or made available to others without prior permission of PL. It should not be considered or taken as an offer to sell or a solicitation to buy or sell any security. The information contained in this report has been obtained from sources that are considered to be reliable. However, PL has not independently verified the accuracy or completeness of the same. Neither PL nor any of its affiliates, its directors or its employees accept any responsibility of whatsoever nature for the information, statements and opinion given, made available or expressed herein or for any omission therein. Recipients of this report should be aware that past performance is not necessarily a guide to future performance and value of investments can go down as well. The suitability or otherwise of any investments will depend upon the recipient's particular circumstances and, in case of doubt, advice should be sought from an independent expert/advisor. Either PL or its affiliates or its directors or its employees or its representatives or its clients or their relatives may have position(s), make market, act as principal or engage in transactions of securities of companies referred to in this report and they may have used the research material prior to publication. We may from time to time solicit or perform investment banking or other services for any company mentioned in this document. Prabhudas Lilladher Pvt. Ltd. 3rd Floor, Sadhana House, 570, P. B. Marg, Worli, Mumbai 400 018, India. Tel: (91 22) 6632 2222 Fax: (91 22) 6632 2209 PL’s Recommendation Nomenclature Rating Distribution of Research Coverage 27.2% 51.5% 21.4% 0.0% 0% 10% 20% 30% 40% 50% 60% BUY Accumulate Reduce Sell %ofTotalCoverage