SlideShare une entreprise Scribd logo
1  sur  9
Télécharger pour lire hors ligne
2012: The Shoe
 4th Quarter 2012                                                               Never Dropped
                                                                                Last year was marked by continuous and
                                                                                pervasive fears of the “next shoe to drop.”
                                                                                Worries included (but were by no means
                                                                                limited to) the European debt crisis, slower-
                                                                                than-expected economic growth in China,
                                                                                another fun-filled edition of the quadrennial
                                                                                U.S. Presidential elections, and weeks of
                                                                                year-end handwringing over the Fiscal Cliff.
                                                                                In spite of it all, and against most odds, the
                                                                                U.S. stock market clawed upward in 2012.
                                                                                Including reinvested dividends, the S&P 500
                                                                                returned 16% last year, leaving the index
                                                                                within 11% of its all-time high of 1576.

                                                                                As we noted in our 4th Quarter 2011 Quar-
                                                                                terly Comments (“Flabbergasting Flat-
                                                                                ness”), we expected the markets to pro-
Market Index Update                                                             duce positive returns in 2012. Mission ac-
                                                                                complished, but we were definitely sur-
                                                                                prised by the magnitude of the gain in U.S.
S&P 500 TR             -0.38%
                                                                                stocks in the face of so many well-
                                                        16.00%
                                                                                publicized headwinds.

RUSSELL 1000          -1.32%
                                                                                Our assessment of the multi-year European
GROWTH
                                                      15.26%
                                                                                debt crisis was also on-target. In last
                                                                                year’s Comments, we opined that “…the
                                                                                resolution is very likely to follow the path
NASDAQ              -3.10%                                                      the U.S. followed after the financial crisis in
                                                       15.91%                   2008: a combination of central bank action,
                                                                                political maneuvering, and market forces
                                                                                will coalesce to allow the European econ-
BARCLAYS                          0.22%
AGGREGATE                                                                       omy and banking systems to ‘muddle
                                       4.22%
                                                                                through.’” This turned out to be a decent
                                                                                approximation of what actually occurred in
BARCLAYS
                                  0.35%                                         the EU this past year, but financial markets
INTERMEDIATE
                                       3.89%                                    responded much more positively than we
GOV./ CREDIT
                                                                                thought possible. In fact, most eurozone
                -10% -5% 0%           5% 10% 15% 20% 25%                        markets not only gained ground in 2012,
                                                                                some actually outperformed the US market
          4th Quarter                     Trailing Year                         by a wide margin.
                                                                                                           (Continued on next page)


      Nothing in this document is intended as an offer or a recommendation to purchase or sell securities. Please see the last page for additional disclosures.
YTD Thru 12/31/2012 Performance for the U.S. and
                         Selected European Markets
45%

                         40.50%
40%


35%
                                    31.72%                          31.92%

30%
             26.87%

25%                                                                                                                                                     23.28%
                                                          22.70%
                                                                                                            21.10%                                            21.36%
                                                                                                                  19.59%                                                                          19.83%
20%

      16.05%                                   16.41%
                                                                                                                                                                                15.22%
15%                                                                                                13.39%


10%

                                                                               5.71% 6.26%
                                                                                                                                    4.95% 4.71%
 5%


 0%
       USA


                                     DENMARK
               AUSTRIA


                                                           FRANCE


                                                                                         IRELAND

                                                                                                    ITALY


                                                                                                                                     PORTUGAL


                                                                                                                                                                                 UNITED KINGDOM
                                                                                                                           NORWAY
                                                                                                             NETHERLANDS


                                                                                                                                                         SWEDEN
                                                FINLAND


                                                                                                                                                SPAIN
                                                                     GERMANY

                                                                                GREECE


                                                                                                                                                                                                   EUROPE
                          BELGIUM


                                                                                                                                                                  SWITZERLAND
  Source: MSCI, JAG Advisors


Lest anyone assumes that we are patting ourselves on the back, we must admit that we
were dead wrong about the direction of interest rates in 2012. Referring back to last
year’s Comments, we wrote: “…While the Fed will probably continue to anchor short-term
rates near zero, we think sub-2% yields on U.S. 10-year Treasury bonds are the very defi-
nition of unsustainable. Therefore, in our view, the probabilities favor modestly higher 10
-year and longer rates in 2012, especially if conditions in Europe improve and/or the U.S.
economy continues its modest recovery.” While that statement sounded logical at the
time (at least to us), the bond market had other plans in mind. The yield on 10-year
Treasuries began 2012 at 1.87%, fell as low as 1.4% during the tumultuous summer, and
ended the year at 1.76% - modestly lower than where it started.


         Nothing in this document is intended as an offer or a recommendation to purchase or sell securities. Please see the last page for additional disclosures.
Year End Report Card 2012 on the Markets
and the Economy
Back by popular demand, we have once again included our internal report card on the
markets and the economy. It provides a snapshot of market and economic data as they
stood as of the years ending 2010, 2011, and 2012, along with some brief commentary
on each category.

As we can see in the S&P 500 Earnings part of the table, Operating Earnings have in-
creased from $83.76 to $99.37 over the past three years – an increase of roughly 19%.
Over the same time period, the S&P 500 Index has risen from 1,258 to 1,467, which
equates to an increase of approximately 17%. Since corporate operating earnings
growth has outstripped the price performance of the S&P 500, the index’s trailing P/E
ratio based upon reported earnings has actually decreased. By taking the inverse of
this P/E ratio, we can see that the Earnings Yield on the S&P 500 stands at over 6%.


      Nothing in this document is intended as an offer or a recommendation to purchase or sell securities. Please see the last page for additional disclosures.
Category                                          Item                              Dec-10        Dec-11       Dec-12*                            Comments
                              S&P 500                                                         1,257.64      1,257.60      1,426.19
                              Nasdaq Composite                                                2,652.87      2,605.15      3,019.51    As economies heal and central banks flood the
                              Russell 1000 Growth                                               495.30        508.39        585.96    world with liquidity, global equity markets have
                              Russell 1000 Value                                                681.82        684.49        804.33    continued to grind higher over the past three
                              Russell 2000 Growth                                             2,942.70      2,857.13      3,273.92    years. Of the major indices tracked here, only the
                              Russell 2000 Value                                              5,635.60      5,325.60      6,286.93    Hang Seng Index and the Shanghai Composite
     Equity Indices           MSCI EAFE                                                       5,225.89      4,612.71      5,438.30    ended 2012 lower than they were at the end of
                              MSCI Europe                                                     6,390.61      5,719.40      6,859.25    2010 - but both produced gains between 2011 and
                              MSCI Emerging Markets Far East                                    653.32        562.21        678.51    2012. Over the past year, the MSCI Europe, MSCI
                              Nikkei                                                         10,228.92      8,455.35     10,395.18    Emerging Markets Far East, and Nikkei indices
                              Hang Seng Index                                                23,035.45     18,434.39     22,656.92    were standout performers.
                              Shanghai Composite                                              2,808.08      2,199.42      2,269.13
                              5 Year U.S. Treasury Note Yield (%)                                 2.02          0.83          0.73    U.S. Treasury and Corporate bond yields have
                              10 Year U.S. Treasury Bond Yield (%)                                3.31          1.87          1.76    fallen to multi-generational lows thanks to Fed
                              30 Year U.S. Treasury Bond Yield (%)                                4.36          2.89          2.95    policy and high global demand for "safe" assets.
                              Moody's Baa Corporate Bond Yield (%)                                6.10          5.25          4.63    The spreads between German and Spanish/Italian
     Interest Rates           Baa / 10 year Treasury Yield Ratio                                  1.81          2.73          2.65    bonds remain wide, but much tighter than their
                              Spain 10 year Govt. Bond Yield (%)                                  5.45          5.09          5.31    highest levels of the past several years as
                              Italy 10 year Govt. Bond Yield (%)                                  4.82          7.11          4.53    Eurozone leaders "muddle" their way to a
                              Germany 10 year Govt. Bond Yield (%)                                2.96          1.83          1.32    resolution of the three-year debt crisis.
      Federal Debt            Total Federal Debt (millions of $)                             14,025,215    15,222,940    16,335,939 * Total U.S. Debt continues to rise.
                              CPI - YoY percent change                                             1.50          2.96          1.76 * Inflation remains contained, despite record-low
        Inflation             Core CPI YoY percent change                                          0.80          2.23          1.94 * interest rates.
                              Bank Loans (millions of $)                                    6,753,742.1   6,915,535.3   7,200,785.4 *
                                                                                                                                      Total Bank Loans have increased by almost $500
                              Bank Loans - Commercial and Industrial (millions of $)        1,210,960.7   1,338,788.0   1,498,751.2 *
       Bank Loans             Bank Loans - Real Estate (millions of $)                      3,602,170.6   3,495,619.1   3,549,247.1 *
                                                                                                                                      billion since December 2010. Commercial and
                                                                                                                                      Industrial lending has been particularly strong.
                              Bank Loans - Consumer (millions of $)                         1,114,733.2   1,092,208.2   1,115,061.4 *
                              S&P 500 TTM Reported EPS                                            77.35         86.95         87.10 * Corporate earnings grown have been
   S&P 500 Earnings           S&P 500 TTM Operating EPS                                           83.76         96.44         99.37 * exceptionally strong in the U.S.
                              S&P 500 P/E Ratio using TTM Reported EPS                            17.50         14.46         16.49 * Traditional P/E ratios have risen only modestly
   S&P 500 P/E Ratios         S&P 500 P/E Ratio using Normalized Reported EPS                     19.57         18.49         19.81 * since 2010. The Shiller CAPE has contracted
                              Shiller Cyclically Adjusted P/E Ratio (Shiller CAPE)                22.39         20.52         21.18 * slightly over the same time period.
                              S&P 500 Earnings Yield using TTM Reported EPS (%)                    5.71          6.92          6.07 *
                                                                                                                                      Earnings yields imply stocks are favorably valued
S&P 500 Earnings Yields       S&P 500 Earnings Yield using Normalized Reported EPS (%)             5.11          5.41          5.05 *
                                                                                                                                      when compared to most classes of bonds.
                              S&P 500 Earnings Yield using Shiller CAPE (%)                        4.47          4.87          4.72 *
                              Initial Claims for Unemployment (4wk MA)                          420,000       377,000       350,000 *
                              Non farm payrolls (thousands)                                     130,346       132,186       133,852 * The U.S. employment market is showing
   Employment Data            Unemployment Rate (%)                                                 9.4           8.5           7.7 * consistent (albeit slow-paced) recovery.
                              Unemployment Rate U-6 (%)                                            16.6          15.2          14.4 *
                              ECRI Weekly Leading Index                                           128.6         120.0         128.3 The economic data is mixed. There were some
                              ISM Purchasing Manager's Index (PMI)                                 57.3          53.1          50.7 signs of deceleration in the US in the summer/fall
  Economic Indicators         ISM New Orders                                                       59.0          54.8          50.3 2012 period, but more recent data has been more
                              Philadelphia Fed Mfg Survey                                          18.1           6.8           8.1 positive.
                              New Home Starts (thousands)                                           539           697           861 *
                                                                                                                                      The residential real estate market is now in a
   Housing Indicators         New Home Sales (thousands)                                            326           339           377 *
                                                                                                                                      firmly-established recovery.
                              Case-Shiller 20 City House Price Index                             142.57        136.83        144.12 *
                              Total U.S. Rail Car Loadings (4 wk MA)                            264,255       283,749       295,194 Total U.S. Rail Car loadings increasing, with most
                              U.S. Rail Car Loadings Cyclical Sectors (4 wk MA)                 100,575       113,877       132,249 of the increase centered in cyclical sectors. This
Transportation Indicators     U.S. Rail Car Loadings Baseline Sectors (4 wk MA)                 160,095       166,131       158,492 may imply underlying strength in the U.S.
                              Baltic Dry Index                                                    1,773         1,738           699 economy looking to 2013.
                              DJ-UBS Commodity Index                                             326.29        282.83        279.84
                              DJ-UBS Copper Price Index                                          962.47        727.56        763.98 In part due to slower growth in China and Europe,
                              Journal of Commerce - ECRI Commodity Price Index                   134.39        117.34        125.64 commodity price action has generally cooled off
   Commodity Prices           Brent Crude ($ per barrel)                                          93.23        108.09        110.04 since 2010. Oil and gold prices are (so far)
                              Gold                                                             1,410.25      1,574.50      1,664.00 exceptions.
                              Silver                                                              30.63         28.18         29.95
                              *or most recent available as of 12/31/2012


                              Equity Indexes - Yahoo Finance, MSCI, Interest Rates - Fed H.15 Release, Bloomberg, Federal Debt - U.S. Treasury, Inflation - Bureau of Labor Statistics,
                              Bank Loans - Fed H.8 Release, S&P 500 Earnings - Standard & Poor's, S&P 500 Valuation - S&P, JAG Advisors, Employment Data - Bureau of Labor Statistics,
        Sources               Dept. of Labor, Economic Indicators - ECRI, ISM, Philadelphia Fed, Housing Indicators - U.S. Census Bureau, Standard & Poor's, Transportation Indicators -
                              American Association of Railroads, Commodity Prices - Dow Jones, Bloomberg, Kitco


                    Nothing in this document is intended as an offer or a recommendation to purchase or sell securities. Please see the last page for additional disclosures.
In our opinion, these valuation metrics imply that stocks are relatively cheap when com-
pared to Treasury bonds (10-year Treasury yields were at 1.76% at year-end 2012) and
corporate bonds (Baa-rated corporates yielded 4.63%). Furthermore, to echo a point we
originally made last summer, the S&P 500’s current dividend yield of 2.1% still exceeds
the yield offered by 10-year Treasuries. This means that capital invested in the S&P 500
is very likely to earn higher total returns than capital invested in U.S. Treasuries over the
next 10 years, even if stock prices were to remain pancake-flat for the next decade.

We remain encouraged by a variety of other data in the table, most notably the Housing
and Transportation indicators. As most of us are aware, the genesis of the Great Reces-
sion of 2008-2009 was a broad collapse in the residential real estate market. Because of
its importance to the American economy, we have long thought that an improvement in
housing would be an important component of a sustained and durable economic recov-
ery. After several years of falling housing prices, real estate markets bottomed in mid-
2011. Since then, the U.S. housing market has steadily improved, as evidenced by the
increases in New Home Starts, New Home Sales, and the Case-Shiller 20 City House
Price Index since the end of 2010.

Despite huge changes in our economy over the last century, railroads remain the main
arteries of commercial activity in the U.S., so we review Rail Car Loading data weekly
during our research meetings. Note from the table that total rail car loadings have risen
significantly over the past several years, driven by a big increase in economically-
sensitive Cyclical Sector car loads.

Looking at the totality of the data contained the report card, we give the economy a
grade of “B,” with some evidence that it could improve to a “B+” in 2013. A lackadaisi-
cal job market, mixed signals in the ECRI Weekly Leading Index, and softness in the ISM
Purchasing Managers Index restrain our enthusiasm. But it could be much worse! At
various points during the last three years, the recovery has appeared to be in serious
jeopardy. With a resolution to the Fiscal Cliff now behind us, and assuming that our poli-
ticians in Washington (more on them later) do not screw up the upcoming debate over
the debt ceiling early in 2013, we think it is possible that the economy could strengthen
modestly throughout the coming year.


2013 Market Outlook


       Nothing in this document is intended as an offer or a recommendation to purchase or sell securities. Please see the last page for additional disclosures.
In any given calendar year, stock market                                           for stocks continues to be weak, and we
returns fall into four broad categories:                                           face more political uncertainty in the U.S.
they can be up a lot (10% or more), up a                                           and Europe over the next several months.
little (up between 0% and 10%), down a
little (down between 0% and -10%), or                                              So while we expect that stocks will pro-
down a lot (-10% or more). Investors                                               duce positive returns in 2013, we would be
have always been obsessed with avoiding                                            quite surprised (pleasantly we might add)
the “down a lot” years, but over the full                                          if this year’s market returns exceed last
                                                                                   year’s.
span of history they are relatively rare:
the S&P 500 has declined by more than                                              We expect bond investing to be challeng-
10% in only eleven calendar years since                                            ing this year. Barring an external shock to
1926. Unfortunately, since three of those                                          the U.S. economy (i.e. unexpected war,
eleven truly bad years have occurred since                                         terror attack, return to crisis in Europe,
2000 (2001, 2002, and the dreadful                                                 etc.), we think that interest rates could
2008), investors today are as circumspect                                          move up modestly in 2013. We think high
about stocks as they have ever been. We                                            -quality and below investment-grade
can see this attitude most clearly in the                                          bonds should outperform Treasuries, and
mutual fund flow data, which show that                                             we expect longer-term bond returns could
investors redeemed over $149.190 billion                                           be pressured by a steepening yield curve.
from domestic equity mutual funds in                                               Therefore, we plan to maintain our portfo-
2012, continuing a trend that has been in                                          lios’ historical focus on shorter-term and
place for years. Since January 2008, mu-                                           intermediate-maturity bonds. We will
tual fund investors have redeemed over                                             seek to generate competitive yields, but
$538.851 billion from stock funds.                                                 not at the expense of assuming excess in-
Our baseline expectation for 2013 is that                                          terest rate risk.
the market will be “up a little.” On the                                           In closing, we leave you with an old Irish
positive side of the ledger, we believe                                            holiday toast:
stock valuations are undemanding
(especially compared with zero-yielding                                                “In the New Year, may your right
cash, CD’s, and Treasury bonds), corpora-                                              hand always be stretched out in
tions are financially strong and poised to                                             friendship and never in want.”
grow earnings again in 2013, our domestic
                                                                                   All of us at JAG wish you and yours a
economy is showing underlying signs of
                                                                                   happy, healthy, and prosperous 2013.
strength, and global central banks are in-
jecting liquidity into financial systems                                           Norm Conley
around the world. On the negative side,
                                                                                   CEO & CIO
corporate profit margins are likely to con-
tract this year after huge expansion since
2009, history shows that stock market re-
turns during the first year of Presidential
terms tend to be muted, investor demand


       Nothing in this document is intended as an offer or a recommendation to purchase or sell securities. Please see the last page for additional disclosures.
Bonus: A New Year’s Pop Quiz


Please circle the best answer from the choices provided.

The phrase Les Miserables best refers to:
     a. A French historical novel by Victor Hugo, first published in 1862 and widely
        considered to be one of the greatest novels of the 19th Century.
     b. The stage musical adaptation of the novel, popularly known as “Les Miz,”
        which won eight Tony Awards during a 17-year run on Broadway which began
        in 1987.
     c. The 2012 film adaptation of the musical, starring Hugh Jackman, Russell
        Crowe, and Anne Hathaway.
     d. The pathetic collection of politicians in the U.S. Congress, who (once again)
        successfully created a manufactured crisis out of whole cloth, this time result-
        ing in the several weeks of nonstop media coverage of the brinksmanship
        surrounding a deal to resolve the so-called “Fiscal Cliff.”
     e. All of the above.

We will not keep you in suspense. Obviously, but unfortunately, the correct answer is
“e.”

The good news is that late on New Year’s Day, Congress and the President finally
ended two months of brinksmanship and came to a deal that prevents the nation from
careening over the Fiscal Cliff. Global stock markets cheered the news as they opened
for trading on January 2, and politicians from both sides made the media rounds to
trumpet a deal which will result in modestly higher taxes for most individuals and
some very minor federal spending cuts.
The bad news is not only the fact that we were forced to endure this sordid spectacle
at all, but that this much-ballyhooed deal on the Cliff does nothing to address a central
long-term problem: unbridled growth in government spending. While the government
spends our money on all sorts of things – some good, some bad, depending upon your
perspective – the growth in transfer payments over the past several decades has been
particularly breathtaking. As the chart below shows in grim detail, transfer payments
now consume almost 90% of all federal government tax receipts – despite comprising
only 56% of the total federal budget.


Put another way, almost 90 cents of every single dollar of federal tax revenue is com-
mitted to fund programs like Medicare, Medicaid, Food Stamps, Social Security, and Un-
employment insurance – among others. This leaves only approximately 10 cents of
every dollar of tax receipts available to fund everything else in the budget– including
huge line items like the Defense Department (24% of the budget), Interest Expense
(6% of the budget), Education (4% of the budget), and Transportation (3% of the
budget). Since it is impossible to square this circle, the Treasury borrows money
through the Treasury market to fund the deficit – leading to an ever-larger mountain of
government debt, expanding yearly budget deficits, and never-ending infighting in Con-
gress.
Understand that we are not offering commentary on the worthiness of any particular
form of transfer payments. The question is not about the quality of the spending so
much as it is the mind-boggling quantity. We are also not proffering any opinion on
tax policy. The simple fact is that this problem is just too big to be solved entirely
through tax increases, even if tax rates were to rise dramatically from current levels.
Note also that this is not a Democrat versus Republican issue: both parties have had a
hand in creating and growing entitlement programs without accounting for their long-
term costs. As the chart clearly shows, the percentage of tax revenue spent on trans-
fer payments has grown consistently since the early 1960’s – through the Kennedy,
LBJ, Nixon, Ford, Carter, Reagan, Bush I, Clinton, Bush II, and Obama administra-
tions. Otherwise known as “kicking the can down the road,” this is a long-term issue
that has grown in importance over the past several decades and is coming into
sharper focus as the Baby Boomer generation moves into retirement age. It will not
be solved overnight, and it certainly cannot be addressed in the pressure-cooker envi-
ronment of a manufactured Fiscal Cliff deadline.

In the long run, voters of all political persuasions will have to force their representa-
tives to craft sensible spending and tax policies that get us closer to a balanced
budget.


Norm Conley                           Mike Buck, CFA
CEO & CIO                             Quantitative Analyst

PAST PERFORMANCE SHOULD NOT BE CONSIDERED INDICATIVE OF FUTURE PERFORMANCE. Please refer to
our Q4 ’12 full performance disclosure for additional information.
This report was prepared by J.A. Glynn & Co., a registered broker-dealer and member FINRA/SIPC, and JAG
Advisors, an investment adviser registered under the Investment Advisers Act of 1940, as amended. The
information herein was obtained from various sources; we do not guarantee its accuracy or completeness.
The information in this report is given as of the date indicated. We assume no obligation to update this in-
formation, or to advise on further developments relating to issuer(s) discussed in this report. Additional in-
formation is available upon request.
The information contained in this document is prepared for general circulation and is circulated for general
information only. It does not address specific investment objectives, or the financial situation and the par-
ticular needs of any recipient. These materials do not contain, and are not intended to provide, information
reasonably sufficient upon which to base an investment decision and should not be used for such purposes.
Investors should seek financial advice regarding the appropriateness of investing in any securities discussed
in this document. This document does not constitute an offer, or an invitation to make an offer, to buy or
sell any securities discussed herein. J.A. Glynn & Co., its affiliates, directors, officers, employees, employee
benefit programs and discretionary client accounts may have a long position in any securities listed herein.
Past performance is not necessarily indicative of future performance.
The views expressed are those of the adviser as of 1/7/13. Opinions expressed in this newsletter are those
of the CIO, are subject to change without notice, and are not guarantees of future performance.

Contenu connexe

Tendances

Focus Mai En V Finale
Focus Mai En V FinaleFocus Mai En V Finale
Focus Mai En V Finaleericfleury
 
Europe and The Summer of Uncertainty
Europe and The Summer of UncertaintyEurope and The Summer of Uncertainty
Europe and The Summer of UncertaintyJeff Green
 
YE 2008 Special Veiwpoint Insert
YE 2008 Special Veiwpoint InsertYE 2008 Special Veiwpoint Insert
YE 2008 Special Veiwpoint Insertmjdeschaine
 
Altrius Town Hall Webinar 06/14/12
Altrius Town Hall Webinar 06/14/12Altrius Town Hall Webinar 06/14/12
Altrius Town Hall Webinar 06/14/12altriuscapital
 
CCA Items Of Interest—Sep 2011
CCA Items Of Interest—Sep 2011CCA Items Of Interest—Sep 2011
CCA Items Of Interest—Sep 2011Ronald Quintero
 
Mid year outlook market perspectives july 2012 final
Mid year outlook market perspectives july 2012 finalMid year outlook market perspectives july 2012 final
Mid year outlook market perspectives july 2012 finalRankia
 
Consumer perceptions of the UK financial services revealed, 1:5 bitter & hostile
Consumer perceptions of the UK financial services revealed, 1:5 bitter & hostileConsumer perceptions of the UK financial services revealed, 1:5 bitter & hostile
Consumer perceptions of the UK financial services revealed, 1:5 bitter & hostilePhilip Brooks
 
RICS Property World pgs5 8
RICS Property World pgs5 8RICS Property World pgs5 8
RICS Property World pgs5 8RICS Americas
 
Property Snapshot Thailand Dec 09
Property Snapshot Thailand Dec 09Property Snapshot Thailand Dec 09
Property Snapshot Thailand Dec 09talk2tony
 
Harris Interactive Financial Services Market Viewpoint Aug2009
Harris Interactive Financial Services Market Viewpoint Aug2009Harris Interactive Financial Services Market Viewpoint Aug2009
Harris Interactive Financial Services Market Viewpoint Aug2009rpiombino
 
4th Qrt 2010 8 Page Final
4th Qrt 2010 8 Page Final4th Qrt 2010 8 Page Final
4th Qrt 2010 8 Page Finalmjdeschaine
 
December 11 Quarterly
December 11 QuarterlyDecember 11 Quarterly
December 11 QuarterlyMark_Krygier
 

Tendances (15)

Ben Pace, Deutsche Bank
Ben Pace, Deutsche BankBen Pace, Deutsche Bank
Ben Pace, Deutsche Bank
 
Focus Mai En V Finale
Focus Mai En V FinaleFocus Mai En V Finale
Focus Mai En V Finale
 
Europe and The Summer of Uncertainty
Europe and The Summer of UncertaintyEurope and The Summer of Uncertainty
Europe and The Summer of Uncertainty
 
Market Update
Market UpdateMarket Update
Market Update
 
YE 2008 Special Veiwpoint Insert
YE 2008 Special Veiwpoint InsertYE 2008 Special Veiwpoint Insert
YE 2008 Special Veiwpoint Insert
 
Altrius Town Hall Webinar 06/14/12
Altrius Town Hall Webinar 06/14/12Altrius Town Hall Webinar 06/14/12
Altrius Town Hall Webinar 06/14/12
 
CCA Items Of Interest—Sep 2011
CCA Items Of Interest—Sep 2011CCA Items Of Interest—Sep 2011
CCA Items Of Interest—Sep 2011
 
Mid year outlook market perspectives july 2012 final
Mid year outlook market perspectives july 2012 finalMid year outlook market perspectives july 2012 final
Mid year outlook market perspectives july 2012 final
 
Consumer perceptions of the UK financial services revealed, 1:5 bitter & hostile
Consumer perceptions of the UK financial services revealed, 1:5 bitter & hostileConsumer perceptions of the UK financial services revealed, 1:5 bitter & hostile
Consumer perceptions of the UK financial services revealed, 1:5 bitter & hostile
 
RICS Property World pgs5 8
RICS Property World pgs5 8RICS Property World pgs5 8
RICS Property World pgs5 8
 
Property Snapshot Thailand Dec 09
Property Snapshot Thailand Dec 09Property Snapshot Thailand Dec 09
Property Snapshot Thailand Dec 09
 
Harris Interactive Financial Services Market Viewpoint Aug2009
Harris Interactive Financial Services Market Viewpoint Aug2009Harris Interactive Financial Services Market Viewpoint Aug2009
Harris Interactive Financial Services Market Viewpoint Aug2009
 
2013 Outlook
2013 Outlook2013 Outlook
2013 Outlook
 
4th Qrt 2010 8 Page Final
4th Qrt 2010 8 Page Final4th Qrt 2010 8 Page Final
4th Qrt 2010 8 Page Final
 
December 11 Quarterly
December 11 QuarterlyDecember 11 Quarterly
December 11 Quarterly
 

En vedette

Nanaimo Marketing Agency - Evolution Business Media Group
Nanaimo Marketing Agency - Evolution Business Media GroupNanaimo Marketing Agency - Evolution Business Media Group
Nanaimo Marketing Agency - Evolution Business Media GroupChris Cathers
 
Avoiding Commodity Stocks Was a Key to 2015
Avoiding Commodity Stocks Was a Key to 2015Avoiding Commodity Stocks Was a Key to 2015
Avoiding Commodity Stocks Was a Key to 2015James Sindelar
 
DIRECTIVA N° 019-2015-CG/GPROD “AUDITORÍA FORENSE”, APROBADA CON R. C. N° 373...
DIRECTIVA N° 019-2015-CG/GPROD “AUDITORÍA FORENSE”, APROBADA CON R. C. N° 373...DIRECTIVA N° 019-2015-CG/GPROD “AUDITORÍA FORENSE”, APROBADA CON R. C. N° 373...
DIRECTIVA N° 019-2015-CG/GPROD “AUDITORÍA FORENSE”, APROBADA CON R. C. N° 373...miguelserrano5851127
 
Alimentos
AlimentosAlimentos
Alimentospilar47
 
Normas para Control interno en el Gobierno Federal – Libro Verde la Oficina d...
Normas para Control interno en el Gobierno Federal – Libro Verde la Oficina d...Normas para Control interno en el Gobierno Federal – Libro Verde la Oficina d...
Normas para Control interno en el Gobierno Federal – Libro Verde la Oficina d...miguelserrano5851127
 
Curso herramientas para la eficacia de la auditoría gubernamental 09.feb.2014
Curso herramientas para la eficacia de la auditoría gubernamental 09.feb.2014Curso herramientas para la eficacia de la auditoría gubernamental 09.feb.2014
Curso herramientas para la eficacia de la auditoría gubernamental 09.feb.2014miguelserrano5851127
 
Evaluación del Diseño y Efectividad de los Controles Internos 12.MAR.2014 - D...
Evaluación del Diseño y Efectividad de los Controles Internos 12.MAR.2014 - D...Evaluación del Diseño y Efectividad de los Controles Internos 12.MAR.2014 - D...
Evaluación del Diseño y Efectividad de los Controles Internos 12.MAR.2014 - D...miguelserrano5851127
 

En vedette (8)

Nanaimo Marketing Agency - Evolution Business Media Group
Nanaimo Marketing Agency - Evolution Business Media GroupNanaimo Marketing Agency - Evolution Business Media Group
Nanaimo Marketing Agency - Evolution Business Media Group
 
Avoiding Commodity Stocks Was a Key to 2015
Avoiding Commodity Stocks Was a Key to 2015Avoiding Commodity Stocks Was a Key to 2015
Avoiding Commodity Stocks Was a Key to 2015
 
DIRECTIVA N° 019-2015-CG/GPROD “AUDITORÍA FORENSE”, APROBADA CON R. C. N° 373...
DIRECTIVA N° 019-2015-CG/GPROD “AUDITORÍA FORENSE”, APROBADA CON R. C. N° 373...DIRECTIVA N° 019-2015-CG/GPROD “AUDITORÍA FORENSE”, APROBADA CON R. C. N° 373...
DIRECTIVA N° 019-2015-CG/GPROD “AUDITORÍA FORENSE”, APROBADA CON R. C. N° 373...
 
Alimentos
AlimentosAlimentos
Alimentos
 
Setas
SetasSetas
Setas
 
Normas para Control interno en el Gobierno Federal – Libro Verde la Oficina d...
Normas para Control interno en el Gobierno Federal – Libro Verde la Oficina d...Normas para Control interno en el Gobierno Federal – Libro Verde la Oficina d...
Normas para Control interno en el Gobierno Federal – Libro Verde la Oficina d...
 
Curso herramientas para la eficacia de la auditoría gubernamental 09.feb.2014
Curso herramientas para la eficacia de la auditoría gubernamental 09.feb.2014Curso herramientas para la eficacia de la auditoría gubernamental 09.feb.2014
Curso herramientas para la eficacia de la auditoría gubernamental 09.feb.2014
 
Evaluación del Diseño y Efectividad de los Controles Internos 12.MAR.2014 - D...
Evaluación del Diseño y Efectividad de los Controles Internos 12.MAR.2014 - D...Evaluación del Diseño y Efectividad de los Controles Internos 12.MAR.2014 - D...
Evaluación del Diseño y Efectividad de los Controles Internos 12.MAR.2014 - D...
 

Similaire à Jag qtrly comments_4q2012

Brent woyat q4 2012 pimg commentary jan2013
Brent woyat q4 2012 pimg commentary jan2013Brent woyat q4 2012 pimg commentary jan2013
Brent woyat q4 2012 pimg commentary jan2013bwoyat
 
2012: More Questions Than Answers
2012: More Questions Than Answers2012: More Questions Than Answers
2012: More Questions Than Answersebruck
 
Colliers International Highlights_Retail_na_2011_q4
Colliers International Highlights_Retail_na_2011_q4Colliers International Highlights_Retail_na_2011_q4
Colliers International Highlights_Retail_na_2011_q4Coy Davidson
 
Annual Market Report (2012)
Annual Market Report (2012)Annual Market Report (2012)
Annual Market Report (2012)jasonwtolliver
 
LPL Financial Research Second Quarter 2012 Market Insight
LPL Financial Research Second Quarter 2012 Market InsightLPL Financial Research Second Quarter 2012 Market Insight
LPL Financial Research Second Quarter 2012 Market Insightchrisphil
 
Saxo Bank's Yearly Outlook 2011
Saxo Bank's Yearly Outlook 2011Saxo Bank's Yearly Outlook 2011
Saxo Bank's Yearly Outlook 2011Trading Floor
 
250 global powers_deloitte_2013
250 global powers_deloitte_2013250 global powers_deloitte_2013
250 global powers_deloitte_2013pluto1970
 
WHV '11AR_Final_PressQuality_Crop&Bleed
WHV '11AR_Final_PressQuality_Crop&BleedWHV '11AR_Final_PressQuality_Crop&Bleed
WHV '11AR_Final_PressQuality_Crop&BleedTlielaxu Miykel
 
Horacio Outlook 2012-FINAL
Horacio Outlook 2012-FINALHoracio Outlook 2012-FINAL
Horacio Outlook 2012-FINALGreg Meier
 
Tricumen 2Q12 Results Update Public
Tricumen 2Q12 Results Update PublicTricumen 2Q12 Results Update Public
Tricumen 2Q12 Results Update Publicsebwalker
 
Syz & co syz asset management - 1 year in 10 snapshots 2013
Syz & co   syz asset management - 1 year in 10 snapshots 2013Syz & co   syz asset management - 1 year in 10 snapshots 2013
Syz & co syz asset management - 1 year in 10 snapshots 2013SYZBank
 
Jg letter shortest_letterever_3q11
Jg letter shortest_letterever_3q11Jg letter shortest_letterever_3q11
Jg letter shortest_letterever_3q11Frank Ragol
 
Jg letter shortest_letterever_3q11
Jg letter shortest_letterever_3q11Jg letter shortest_letterever_3q11
Jg letter shortest_letterever_3q11Frank Ragol
 
Henley outlook feb 2013 web
Henley outlook   feb 2013 webHenley outlook   feb 2013 web
Henley outlook feb 2013 webTania Scott
 

Similaire à Jag qtrly comments_4q2012 (20)

Brent woyat q4 2012 pimg commentary jan2013
Brent woyat q4 2012 pimg commentary jan2013Brent woyat q4 2012 pimg commentary jan2013
Brent woyat q4 2012 pimg commentary jan2013
 
2012 Mid Year Outlook
2012 Mid Year Outlook2012 Mid Year Outlook
2012 Mid Year Outlook
 
Mid year outlook_2012
Mid year outlook_2012Mid year outlook_2012
Mid year outlook_2012
 
2012: More Questions Than Answers
2012: More Questions Than Answers2012: More Questions Than Answers
2012: More Questions Than Answers
 
Colliers International Highlights_Retail_na_2011_q4
Colliers International Highlights_Retail_na_2011_q4Colliers International Highlights_Retail_na_2011_q4
Colliers International Highlights_Retail_na_2011_q4
 
Annual Market Report (2012)
Annual Market Report (2012)Annual Market Report (2012)
Annual Market Report (2012)
 
LPL Financial Research Second Quarter 2012 Market Insight
LPL Financial Research Second Quarter 2012 Market InsightLPL Financial Research Second Quarter 2012 Market Insight
LPL Financial Research Second Quarter 2012 Market Insight
 
Saxo Bank's Yearly Outlook 2011
Saxo Bank's Yearly Outlook 2011Saxo Bank's Yearly Outlook 2011
Saxo Bank's Yearly Outlook 2011
 
Yearly Outlook 2011
Yearly Outlook  2011Yearly Outlook  2011
Yearly Outlook 2011
 
250 global powers_deloitte_2013
250 global powers_deloitte_2013250 global powers_deloitte_2013
250 global powers_deloitte_2013
 
WHV '11AR_Final_PressQuality_Crop&Bleed
WHV '11AR_Final_PressQuality_Crop&BleedWHV '11AR_Final_PressQuality_Crop&Bleed
WHV '11AR_Final_PressQuality_Crop&Bleed
 
LPL Financial 2012 Outlook
LPL Financial 2012 OutlookLPL Financial 2012 Outlook
LPL Financial 2012 Outlook
 
Horacio Outlook 2012-FINAL
Horacio Outlook 2012-FINALHoracio Outlook 2012-FINAL
Horacio Outlook 2012-FINAL
 
Tricumen 2Q12 Results Update Public
Tricumen 2Q12 Results Update PublicTricumen 2Q12 Results Update Public
Tricumen 2Q12 Results Update Public
 
Tic Us Gcf Stocks
Tic Us Gcf StocksTic Us Gcf Stocks
Tic Us Gcf Stocks
 
Syz & co syz asset management - 1 year in 10 snapshots 2013
Syz & co   syz asset management - 1 year in 10 snapshots 2013Syz & co   syz asset management - 1 year in 10 snapshots 2013
Syz & co syz asset management - 1 year in 10 snapshots 2013
 
Jg letter shortest_letterever_3q11
Jg letter shortest_letterever_3q11Jg letter shortest_letterever_3q11
Jg letter shortest_letterever_3q11
 
Jg letter shortest_letterever_3q11
Jg letter shortest_letterever_3q11Jg letter shortest_letterever_3q11
Jg letter shortest_letterever_3q11
 
Jan 2012
Jan 2012Jan 2012
Jan 2012
 
Henley outlook feb 2013 web
Henley outlook   feb 2013 webHenley outlook   feb 2013 web
Henley outlook feb 2013 web
 

Dernier

House of Commons ; CDC schemes overview document
House of Commons ; CDC schemes overview documentHouse of Commons ; CDC schemes overview document
House of Commons ; CDC schemes overview documentHenry Tapper
 
NO1 Certified kala jadu karne wale ka contact number kala jadu karne wale bab...
NO1 Certified kala jadu karne wale ka contact number kala jadu karne wale bab...NO1 Certified kala jadu karne wale ka contact number kala jadu karne wale bab...
NO1 Certified kala jadu karne wale ka contact number kala jadu karne wale bab...Amil baba
 
原版1:1复刻堪萨斯大学毕业证KU毕业证留信学历认证
原版1:1复刻堪萨斯大学毕业证KU毕业证留信学历认证原版1:1复刻堪萨斯大学毕业证KU毕业证留信学历认证
原版1:1复刻堪萨斯大学毕业证KU毕业证留信学历认证jdkhjh
 
NO1 Certified Amil Baba In Lahore Kala Jadu In Lahore Best Amil In Lahore Ami...
NO1 Certified Amil Baba In Lahore Kala Jadu In Lahore Best Amil In Lahore Ami...NO1 Certified Amil Baba In Lahore Kala Jadu In Lahore Best Amil In Lahore Ami...
NO1 Certified Amil Baba In Lahore Kala Jadu In Lahore Best Amil In Lahore Ami...Amil baba
 
PMFBY , Pradhan Mantri Fasal bima yojna
PMFBY , Pradhan Mantri  Fasal bima yojnaPMFBY , Pradhan Mantri  Fasal bima yojna
PMFBY , Pradhan Mantri Fasal bima yojnaDharmendra Kumar
 
Economic Risk Factor Update: April 2024 [SlideShare]
Economic Risk Factor Update: April 2024 [SlideShare]Economic Risk Factor Update: April 2024 [SlideShare]
Economic Risk Factor Update: April 2024 [SlideShare]Commonwealth
 
Financial Preparation for Millennia.pptx
Financial Preparation for Millennia.pptxFinancial Preparation for Millennia.pptx
Financial Preparation for Millennia.pptxsimon978302
 
Vp Girls near me Delhi Call Now or WhatsApp
Vp Girls near me Delhi Call Now or WhatsAppVp Girls near me Delhi Call Now or WhatsApp
Vp Girls near me Delhi Call Now or WhatsAppmiss dipika
 
Managing Finances in a Small Business (yes).pdf
Managing Finances  in a Small Business (yes).pdfManaging Finances  in a Small Business (yes).pdf
Managing Finances in a Small Business (yes).pdfmar yame
 
(中央兰开夏大学毕业证学位证成绩单-案例)
(中央兰开夏大学毕业证学位证成绩单-案例)(中央兰开夏大学毕业证学位证成绩单-案例)
(中央兰开夏大学毕业证学位证成绩单-案例)twfkn8xj
 
原版1:1复刻温哥华岛大学毕业证Vancouver毕业证留信学历认证
原版1:1复刻温哥华岛大学毕业证Vancouver毕业证留信学历认证原版1:1复刻温哥华岛大学毕业证Vancouver毕业证留信学历认证
原版1:1复刻温哥华岛大学毕业证Vancouver毕业证留信学历认证rjrjkk
 
Uae-NO1 Black Magic Specialist In Lahore Black magic In Pakistan Kala Ilam Ex...
Uae-NO1 Black Magic Specialist In Lahore Black magic In Pakistan Kala Ilam Ex...Uae-NO1 Black Magic Specialist In Lahore Black magic In Pakistan Kala Ilam Ex...
Uae-NO1 Black Magic Specialist In Lahore Black magic In Pakistan Kala Ilam Ex...Amil baba
 
BPPG response - Options for Defined Benefit schemes - 19Apr24.pdf
BPPG response - Options for Defined Benefit schemes - 19Apr24.pdfBPPG response - Options for Defined Benefit schemes - 19Apr24.pdf
BPPG response - Options for Defined Benefit schemes - 19Apr24.pdfHenry Tapper
 
Role of Information and technology in banking and finance .pptx
Role of Information and technology in banking and finance .pptxRole of Information and technology in banking and finance .pptx
Role of Information and technology in banking and finance .pptxNarayaniTripathi2
 
magnetic-pensions-a-new-blueprint-for-the-dc-landscape.pdf
magnetic-pensions-a-new-blueprint-for-the-dc-landscape.pdfmagnetic-pensions-a-new-blueprint-for-the-dc-landscape.pdf
magnetic-pensions-a-new-blueprint-for-the-dc-landscape.pdfHenry Tapper
 
Stock Market Brief Deck for "this does not happen often".pdf
Stock Market Brief Deck for "this does not happen often".pdfStock Market Brief Deck for "this does not happen often".pdf
Stock Market Brief Deck for "this does not happen often".pdfMichael Silva
 
NCDC and NAFED presentation by Paras .pptx
NCDC and NAFED presentation by Paras .pptxNCDC and NAFED presentation by Paras .pptx
NCDC and NAFED presentation by Paras .pptxnaikparas90
 
Uae-NO1 Kala Jadu specialist Expert in Pakistan kala ilam specialist Expert i...
Uae-NO1 Kala Jadu specialist Expert in Pakistan kala ilam specialist Expert i...Uae-NO1 Kala Jadu specialist Expert in Pakistan kala ilam specialist Expert i...
Uae-NO1 Kala Jadu specialist Expert in Pakistan kala ilam specialist Expert i...Amil baba
 
cost of capital questions financial management
cost of capital questions financial managementcost of capital questions financial management
cost of capital questions financial managementtanmayarora23
 
SBP-Market-Operations and market managment
SBP-Market-Operations and market managmentSBP-Market-Operations and market managment
SBP-Market-Operations and market managmentfactical
 

Dernier (20)

House of Commons ; CDC schemes overview document
House of Commons ; CDC schemes overview documentHouse of Commons ; CDC schemes overview document
House of Commons ; CDC schemes overview document
 
NO1 Certified kala jadu karne wale ka contact number kala jadu karne wale bab...
NO1 Certified kala jadu karne wale ka contact number kala jadu karne wale bab...NO1 Certified kala jadu karne wale ka contact number kala jadu karne wale bab...
NO1 Certified kala jadu karne wale ka contact number kala jadu karne wale bab...
 
原版1:1复刻堪萨斯大学毕业证KU毕业证留信学历认证
原版1:1复刻堪萨斯大学毕业证KU毕业证留信学历认证原版1:1复刻堪萨斯大学毕业证KU毕业证留信学历认证
原版1:1复刻堪萨斯大学毕业证KU毕业证留信学历认证
 
NO1 Certified Amil Baba In Lahore Kala Jadu In Lahore Best Amil In Lahore Ami...
NO1 Certified Amil Baba In Lahore Kala Jadu In Lahore Best Amil In Lahore Ami...NO1 Certified Amil Baba In Lahore Kala Jadu In Lahore Best Amil In Lahore Ami...
NO1 Certified Amil Baba In Lahore Kala Jadu In Lahore Best Amil In Lahore Ami...
 
PMFBY , Pradhan Mantri Fasal bima yojna
PMFBY , Pradhan Mantri  Fasal bima yojnaPMFBY , Pradhan Mantri  Fasal bima yojna
PMFBY , Pradhan Mantri Fasal bima yojna
 
Economic Risk Factor Update: April 2024 [SlideShare]
Economic Risk Factor Update: April 2024 [SlideShare]Economic Risk Factor Update: April 2024 [SlideShare]
Economic Risk Factor Update: April 2024 [SlideShare]
 
Financial Preparation for Millennia.pptx
Financial Preparation for Millennia.pptxFinancial Preparation for Millennia.pptx
Financial Preparation for Millennia.pptx
 
Vp Girls near me Delhi Call Now or WhatsApp
Vp Girls near me Delhi Call Now or WhatsAppVp Girls near me Delhi Call Now or WhatsApp
Vp Girls near me Delhi Call Now or WhatsApp
 
Managing Finances in a Small Business (yes).pdf
Managing Finances  in a Small Business (yes).pdfManaging Finances  in a Small Business (yes).pdf
Managing Finances in a Small Business (yes).pdf
 
(中央兰开夏大学毕业证学位证成绩单-案例)
(中央兰开夏大学毕业证学位证成绩单-案例)(中央兰开夏大学毕业证学位证成绩单-案例)
(中央兰开夏大学毕业证学位证成绩单-案例)
 
原版1:1复刻温哥华岛大学毕业证Vancouver毕业证留信学历认证
原版1:1复刻温哥华岛大学毕业证Vancouver毕业证留信学历认证原版1:1复刻温哥华岛大学毕业证Vancouver毕业证留信学历认证
原版1:1复刻温哥华岛大学毕业证Vancouver毕业证留信学历认证
 
Uae-NO1 Black Magic Specialist In Lahore Black magic In Pakistan Kala Ilam Ex...
Uae-NO1 Black Magic Specialist In Lahore Black magic In Pakistan Kala Ilam Ex...Uae-NO1 Black Magic Specialist In Lahore Black magic In Pakistan Kala Ilam Ex...
Uae-NO1 Black Magic Specialist In Lahore Black magic In Pakistan Kala Ilam Ex...
 
BPPG response - Options for Defined Benefit schemes - 19Apr24.pdf
BPPG response - Options for Defined Benefit schemes - 19Apr24.pdfBPPG response - Options for Defined Benefit schemes - 19Apr24.pdf
BPPG response - Options for Defined Benefit schemes - 19Apr24.pdf
 
Role of Information and technology in banking and finance .pptx
Role of Information and technology in banking and finance .pptxRole of Information and technology in banking and finance .pptx
Role of Information and technology in banking and finance .pptx
 
magnetic-pensions-a-new-blueprint-for-the-dc-landscape.pdf
magnetic-pensions-a-new-blueprint-for-the-dc-landscape.pdfmagnetic-pensions-a-new-blueprint-for-the-dc-landscape.pdf
magnetic-pensions-a-new-blueprint-for-the-dc-landscape.pdf
 
Stock Market Brief Deck for "this does not happen often".pdf
Stock Market Brief Deck for "this does not happen often".pdfStock Market Brief Deck for "this does not happen often".pdf
Stock Market Brief Deck for "this does not happen often".pdf
 
NCDC and NAFED presentation by Paras .pptx
NCDC and NAFED presentation by Paras .pptxNCDC and NAFED presentation by Paras .pptx
NCDC and NAFED presentation by Paras .pptx
 
Uae-NO1 Kala Jadu specialist Expert in Pakistan kala ilam specialist Expert i...
Uae-NO1 Kala Jadu specialist Expert in Pakistan kala ilam specialist Expert i...Uae-NO1 Kala Jadu specialist Expert in Pakistan kala ilam specialist Expert i...
Uae-NO1 Kala Jadu specialist Expert in Pakistan kala ilam specialist Expert i...
 
cost of capital questions financial management
cost of capital questions financial managementcost of capital questions financial management
cost of capital questions financial management
 
SBP-Market-Operations and market managment
SBP-Market-Operations and market managmentSBP-Market-Operations and market managment
SBP-Market-Operations and market managment
 

Jag qtrly comments_4q2012

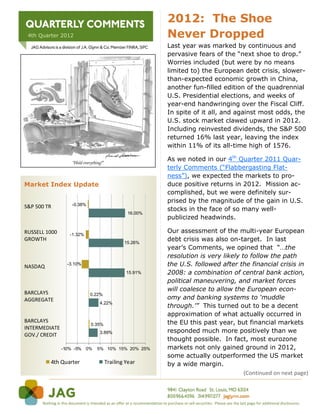
  • 1. 2012: The Shoe 4th Quarter 2012 Never Dropped Last year was marked by continuous and pervasive fears of the “next shoe to drop.” Worries included (but were by no means limited to) the European debt crisis, slower- than-expected economic growth in China, another fun-filled edition of the quadrennial U.S. Presidential elections, and weeks of year-end handwringing over the Fiscal Cliff. In spite of it all, and against most odds, the U.S. stock market clawed upward in 2012. Including reinvested dividends, the S&P 500 returned 16% last year, leaving the index within 11% of its all-time high of 1576. As we noted in our 4th Quarter 2011 Quar- terly Comments (“Flabbergasting Flat- ness”), we expected the markets to pro- Market Index Update duce positive returns in 2012. Mission ac- complished, but we were definitely sur- prised by the magnitude of the gain in U.S. S&P 500 TR -0.38% stocks in the face of so many well- 16.00% publicized headwinds. RUSSELL 1000 -1.32% Our assessment of the multi-year European GROWTH 15.26% debt crisis was also on-target. In last year’s Comments, we opined that “…the resolution is very likely to follow the path NASDAQ -3.10% the U.S. followed after the financial crisis in 15.91% 2008: a combination of central bank action, political maneuvering, and market forces will coalesce to allow the European econ- BARCLAYS 0.22% AGGREGATE omy and banking systems to ‘muddle 4.22% through.’” This turned out to be a decent approximation of what actually occurred in BARCLAYS 0.35% the EU this past year, but financial markets INTERMEDIATE 3.89% responded much more positively than we GOV./ CREDIT thought possible. In fact, most eurozone -10% -5% 0% 5% 10% 15% 20% 25% markets not only gained ground in 2012, some actually outperformed the US market 4th Quarter Trailing Year by a wide margin. (Continued on next page) Nothing in this document is intended as an offer or a recommendation to purchase or sell securities. Please see the last page for additional disclosures.
  • 2. YTD Thru 12/31/2012 Performance for the U.S. and Selected European Markets 45% 40.50% 40% 35% 31.72% 31.92% 30% 26.87% 25% 23.28% 22.70% 21.10% 21.36% 19.59% 19.83% 20% 16.05% 16.41% 15.22% 15% 13.39% 10% 5.71% 6.26% 4.95% 4.71% 5% 0% USA DENMARK AUSTRIA FRANCE IRELAND ITALY PORTUGAL UNITED KINGDOM NORWAY NETHERLANDS SWEDEN FINLAND SPAIN GERMANY GREECE EUROPE BELGIUM SWITZERLAND Source: MSCI, JAG Advisors Lest anyone assumes that we are patting ourselves on the back, we must admit that we were dead wrong about the direction of interest rates in 2012. Referring back to last year’s Comments, we wrote: “…While the Fed will probably continue to anchor short-term rates near zero, we think sub-2% yields on U.S. 10-year Treasury bonds are the very defi- nition of unsustainable. Therefore, in our view, the probabilities favor modestly higher 10 -year and longer rates in 2012, especially if conditions in Europe improve and/or the U.S. economy continues its modest recovery.” While that statement sounded logical at the time (at least to us), the bond market had other plans in mind. The yield on 10-year Treasuries began 2012 at 1.87%, fell as low as 1.4% during the tumultuous summer, and ended the year at 1.76% - modestly lower than where it started. Nothing in this document is intended as an offer or a recommendation to purchase or sell securities. Please see the last page for additional disclosures.
  • 3. Year End Report Card 2012 on the Markets and the Economy Back by popular demand, we have once again included our internal report card on the markets and the economy. It provides a snapshot of market and economic data as they stood as of the years ending 2010, 2011, and 2012, along with some brief commentary on each category. As we can see in the S&P 500 Earnings part of the table, Operating Earnings have in- creased from $83.76 to $99.37 over the past three years – an increase of roughly 19%. Over the same time period, the S&P 500 Index has risen from 1,258 to 1,467, which equates to an increase of approximately 17%. Since corporate operating earnings growth has outstripped the price performance of the S&P 500, the index’s trailing P/E ratio based upon reported earnings has actually decreased. By taking the inverse of this P/E ratio, we can see that the Earnings Yield on the S&P 500 stands at over 6%. Nothing in this document is intended as an offer or a recommendation to purchase or sell securities. Please see the last page for additional disclosures.
  • 4. Category Item Dec-10 Dec-11 Dec-12* Comments S&P 500 1,257.64 1,257.60 1,426.19 Nasdaq Composite 2,652.87 2,605.15 3,019.51 As economies heal and central banks flood the Russell 1000 Growth 495.30 508.39 585.96 world with liquidity, global equity markets have Russell 1000 Value 681.82 684.49 804.33 continued to grind higher over the past three Russell 2000 Growth 2,942.70 2,857.13 3,273.92 years. Of the major indices tracked here, only the Russell 2000 Value 5,635.60 5,325.60 6,286.93 Hang Seng Index and the Shanghai Composite Equity Indices MSCI EAFE 5,225.89 4,612.71 5,438.30 ended 2012 lower than they were at the end of MSCI Europe 6,390.61 5,719.40 6,859.25 2010 - but both produced gains between 2011 and MSCI Emerging Markets Far East 653.32 562.21 678.51 2012. Over the past year, the MSCI Europe, MSCI Nikkei 10,228.92 8,455.35 10,395.18 Emerging Markets Far East, and Nikkei indices Hang Seng Index 23,035.45 18,434.39 22,656.92 were standout performers. Shanghai Composite 2,808.08 2,199.42 2,269.13 5 Year U.S. Treasury Note Yield (%) 2.02 0.83 0.73 U.S. Treasury and Corporate bond yields have 10 Year U.S. Treasury Bond Yield (%) 3.31 1.87 1.76 fallen to multi-generational lows thanks to Fed 30 Year U.S. Treasury Bond Yield (%) 4.36 2.89 2.95 policy and high global demand for "safe" assets. Moody's Baa Corporate Bond Yield (%) 6.10 5.25 4.63 The spreads between German and Spanish/Italian Interest Rates Baa / 10 year Treasury Yield Ratio 1.81 2.73 2.65 bonds remain wide, but much tighter than their Spain 10 year Govt. Bond Yield (%) 5.45 5.09 5.31 highest levels of the past several years as Italy 10 year Govt. Bond Yield (%) 4.82 7.11 4.53 Eurozone leaders "muddle" their way to a Germany 10 year Govt. Bond Yield (%) 2.96 1.83 1.32 resolution of the three-year debt crisis. Federal Debt Total Federal Debt (millions of $) 14,025,215 15,222,940 16,335,939 * Total U.S. Debt continues to rise. CPI - YoY percent change 1.50 2.96 1.76 * Inflation remains contained, despite record-low Inflation Core CPI YoY percent change 0.80 2.23 1.94 * interest rates. Bank Loans (millions of $) 6,753,742.1 6,915,535.3 7,200,785.4 * Total Bank Loans have increased by almost $500 Bank Loans - Commercial and Industrial (millions of $) 1,210,960.7 1,338,788.0 1,498,751.2 * Bank Loans Bank Loans - Real Estate (millions of $) 3,602,170.6 3,495,619.1 3,549,247.1 * billion since December 2010. Commercial and Industrial lending has been particularly strong. Bank Loans - Consumer (millions of $) 1,114,733.2 1,092,208.2 1,115,061.4 * S&P 500 TTM Reported EPS 77.35 86.95 87.10 * Corporate earnings grown have been S&P 500 Earnings S&P 500 TTM Operating EPS 83.76 96.44 99.37 * exceptionally strong in the U.S. S&P 500 P/E Ratio using TTM Reported EPS 17.50 14.46 16.49 * Traditional P/E ratios have risen only modestly S&P 500 P/E Ratios S&P 500 P/E Ratio using Normalized Reported EPS 19.57 18.49 19.81 * since 2010. The Shiller CAPE has contracted Shiller Cyclically Adjusted P/E Ratio (Shiller CAPE) 22.39 20.52 21.18 * slightly over the same time period. S&P 500 Earnings Yield using TTM Reported EPS (%) 5.71 6.92 6.07 * Earnings yields imply stocks are favorably valued S&P 500 Earnings Yields S&P 500 Earnings Yield using Normalized Reported EPS (%) 5.11 5.41 5.05 * when compared to most classes of bonds. S&P 500 Earnings Yield using Shiller CAPE (%) 4.47 4.87 4.72 * Initial Claims for Unemployment (4wk MA) 420,000 377,000 350,000 * Non farm payrolls (thousands) 130,346 132,186 133,852 * The U.S. employment market is showing Employment Data Unemployment Rate (%) 9.4 8.5 7.7 * consistent (albeit slow-paced) recovery. Unemployment Rate U-6 (%) 16.6 15.2 14.4 * ECRI Weekly Leading Index 128.6 120.0 128.3 The economic data is mixed. There were some ISM Purchasing Manager's Index (PMI) 57.3 53.1 50.7 signs of deceleration in the US in the summer/fall Economic Indicators ISM New Orders 59.0 54.8 50.3 2012 period, but more recent data has been more Philadelphia Fed Mfg Survey 18.1 6.8 8.1 positive. New Home Starts (thousands) 539 697 861 * The residential real estate market is now in a Housing Indicators New Home Sales (thousands) 326 339 377 * firmly-established recovery. Case-Shiller 20 City House Price Index 142.57 136.83 144.12 * Total U.S. Rail Car Loadings (4 wk MA) 264,255 283,749 295,194 Total U.S. Rail Car loadings increasing, with most U.S. Rail Car Loadings Cyclical Sectors (4 wk MA) 100,575 113,877 132,249 of the increase centered in cyclical sectors. This Transportation Indicators U.S. Rail Car Loadings Baseline Sectors (4 wk MA) 160,095 166,131 158,492 may imply underlying strength in the U.S. Baltic Dry Index 1,773 1,738 699 economy looking to 2013. DJ-UBS Commodity Index 326.29 282.83 279.84 DJ-UBS Copper Price Index 962.47 727.56 763.98 In part due to slower growth in China and Europe, Journal of Commerce - ECRI Commodity Price Index 134.39 117.34 125.64 commodity price action has generally cooled off Commodity Prices Brent Crude ($ per barrel) 93.23 108.09 110.04 since 2010. Oil and gold prices are (so far) Gold 1,410.25 1,574.50 1,664.00 exceptions. Silver 30.63 28.18 29.95 *or most recent available as of 12/31/2012 Equity Indexes - Yahoo Finance, MSCI, Interest Rates - Fed H.15 Release, Bloomberg, Federal Debt - U.S. Treasury, Inflation - Bureau of Labor Statistics, Bank Loans - Fed H.8 Release, S&P 500 Earnings - Standard & Poor's, S&P 500 Valuation - S&P, JAG Advisors, Employment Data - Bureau of Labor Statistics, Sources Dept. of Labor, Economic Indicators - ECRI, ISM, Philadelphia Fed, Housing Indicators - U.S. Census Bureau, Standard & Poor's, Transportation Indicators - American Association of Railroads, Commodity Prices - Dow Jones, Bloomberg, Kitco Nothing in this document is intended as an offer or a recommendation to purchase or sell securities. Please see the last page for additional disclosures.
  • 5. In our opinion, these valuation metrics imply that stocks are relatively cheap when com- pared to Treasury bonds (10-year Treasury yields were at 1.76% at year-end 2012) and corporate bonds (Baa-rated corporates yielded 4.63%). Furthermore, to echo a point we originally made last summer, the S&P 500’s current dividend yield of 2.1% still exceeds the yield offered by 10-year Treasuries. This means that capital invested in the S&P 500 is very likely to earn higher total returns than capital invested in U.S. Treasuries over the next 10 years, even if stock prices were to remain pancake-flat for the next decade. We remain encouraged by a variety of other data in the table, most notably the Housing and Transportation indicators. As most of us are aware, the genesis of the Great Reces- sion of 2008-2009 was a broad collapse in the residential real estate market. Because of its importance to the American economy, we have long thought that an improvement in housing would be an important component of a sustained and durable economic recov- ery. After several years of falling housing prices, real estate markets bottomed in mid- 2011. Since then, the U.S. housing market has steadily improved, as evidenced by the increases in New Home Starts, New Home Sales, and the Case-Shiller 20 City House Price Index since the end of 2010. Despite huge changes in our economy over the last century, railroads remain the main arteries of commercial activity in the U.S., so we review Rail Car Loading data weekly during our research meetings. Note from the table that total rail car loadings have risen significantly over the past several years, driven by a big increase in economically- sensitive Cyclical Sector car loads. Looking at the totality of the data contained the report card, we give the economy a grade of “B,” with some evidence that it could improve to a “B+” in 2013. A lackadaisi- cal job market, mixed signals in the ECRI Weekly Leading Index, and softness in the ISM Purchasing Managers Index restrain our enthusiasm. But it could be much worse! At various points during the last three years, the recovery has appeared to be in serious jeopardy. With a resolution to the Fiscal Cliff now behind us, and assuming that our poli- ticians in Washington (more on them later) do not screw up the upcoming debate over the debt ceiling early in 2013, we think it is possible that the economy could strengthen modestly throughout the coming year. 2013 Market Outlook Nothing in this document is intended as an offer or a recommendation to purchase or sell securities. Please see the last page for additional disclosures.
  • 6. In any given calendar year, stock market for stocks continues to be weak, and we returns fall into four broad categories: face more political uncertainty in the U.S. they can be up a lot (10% or more), up a and Europe over the next several months. little (up between 0% and 10%), down a little (down between 0% and -10%), or So while we expect that stocks will pro- down a lot (-10% or more). Investors duce positive returns in 2013, we would be have always been obsessed with avoiding quite surprised (pleasantly we might add) the “down a lot” years, but over the full if this year’s market returns exceed last year’s. span of history they are relatively rare: the S&P 500 has declined by more than We expect bond investing to be challeng- 10% in only eleven calendar years since ing this year. Barring an external shock to 1926. Unfortunately, since three of those the U.S. economy (i.e. unexpected war, eleven truly bad years have occurred since terror attack, return to crisis in Europe, 2000 (2001, 2002, and the dreadful etc.), we think that interest rates could 2008), investors today are as circumspect move up modestly in 2013. We think high about stocks as they have ever been. We -quality and below investment-grade can see this attitude most clearly in the bonds should outperform Treasuries, and mutual fund flow data, which show that we expect longer-term bond returns could investors redeemed over $149.190 billion be pressured by a steepening yield curve. from domestic equity mutual funds in Therefore, we plan to maintain our portfo- 2012, continuing a trend that has been in lios’ historical focus on shorter-term and place for years. Since January 2008, mu- intermediate-maturity bonds. We will tual fund investors have redeemed over seek to generate competitive yields, but $538.851 billion from stock funds. not at the expense of assuming excess in- Our baseline expectation for 2013 is that terest rate risk. the market will be “up a little.” On the In closing, we leave you with an old Irish positive side of the ledger, we believe holiday toast: stock valuations are undemanding (especially compared with zero-yielding “In the New Year, may your right cash, CD’s, and Treasury bonds), corpora- hand always be stretched out in tions are financially strong and poised to friendship and never in want.” grow earnings again in 2013, our domestic All of us at JAG wish you and yours a economy is showing underlying signs of happy, healthy, and prosperous 2013. strength, and global central banks are in- jecting liquidity into financial systems Norm Conley around the world. On the negative side, CEO & CIO corporate profit margins are likely to con- tract this year after huge expansion since 2009, history shows that stock market re- turns during the first year of Presidential terms tend to be muted, investor demand Nothing in this document is intended as an offer or a recommendation to purchase or sell securities. Please see the last page for additional disclosures.
  • 7. Bonus: A New Year’s Pop Quiz Please circle the best answer from the choices provided. The phrase Les Miserables best refers to: a. A French historical novel by Victor Hugo, first published in 1862 and widely considered to be one of the greatest novels of the 19th Century. b. The stage musical adaptation of the novel, popularly known as “Les Miz,” which won eight Tony Awards during a 17-year run on Broadway which began in 1987. c. The 2012 film adaptation of the musical, starring Hugh Jackman, Russell Crowe, and Anne Hathaway. d. The pathetic collection of politicians in the U.S. Congress, who (once again) successfully created a manufactured crisis out of whole cloth, this time result- ing in the several weeks of nonstop media coverage of the brinksmanship surrounding a deal to resolve the so-called “Fiscal Cliff.” e. All of the above. We will not keep you in suspense. Obviously, but unfortunately, the correct answer is “e.” The good news is that late on New Year’s Day, Congress and the President finally ended two months of brinksmanship and came to a deal that prevents the nation from careening over the Fiscal Cliff. Global stock markets cheered the news as they opened for trading on January 2, and politicians from both sides made the media rounds to trumpet a deal which will result in modestly higher taxes for most individuals and some very minor federal spending cuts.
  • 8. The bad news is not only the fact that we were forced to endure this sordid spectacle at all, but that this much-ballyhooed deal on the Cliff does nothing to address a central long-term problem: unbridled growth in government spending. While the government spends our money on all sorts of things – some good, some bad, depending upon your perspective – the growth in transfer payments over the past several decades has been particularly breathtaking. As the chart below shows in grim detail, transfer payments now consume almost 90% of all federal government tax receipts – despite comprising only 56% of the total federal budget. Put another way, almost 90 cents of every single dollar of federal tax revenue is com- mitted to fund programs like Medicare, Medicaid, Food Stamps, Social Security, and Un- employment insurance – among others. This leaves only approximately 10 cents of every dollar of tax receipts available to fund everything else in the budget– including huge line items like the Defense Department (24% of the budget), Interest Expense (6% of the budget), Education (4% of the budget), and Transportation (3% of the budget). Since it is impossible to square this circle, the Treasury borrows money through the Treasury market to fund the deficit – leading to an ever-larger mountain of government debt, expanding yearly budget deficits, and never-ending infighting in Con- gress.
  • 9. Understand that we are not offering commentary on the worthiness of any particular form of transfer payments. The question is not about the quality of the spending so much as it is the mind-boggling quantity. We are also not proffering any opinion on tax policy. The simple fact is that this problem is just too big to be solved entirely through tax increases, even if tax rates were to rise dramatically from current levels. Note also that this is not a Democrat versus Republican issue: both parties have had a hand in creating and growing entitlement programs without accounting for their long- term costs. As the chart clearly shows, the percentage of tax revenue spent on trans- fer payments has grown consistently since the early 1960’s – through the Kennedy, LBJ, Nixon, Ford, Carter, Reagan, Bush I, Clinton, Bush II, and Obama administra- tions. Otherwise known as “kicking the can down the road,” this is a long-term issue that has grown in importance over the past several decades and is coming into sharper focus as the Baby Boomer generation moves into retirement age. It will not be solved overnight, and it certainly cannot be addressed in the pressure-cooker envi- ronment of a manufactured Fiscal Cliff deadline. In the long run, voters of all political persuasions will have to force their representa- tives to craft sensible spending and tax policies that get us closer to a balanced budget. Norm Conley Mike Buck, CFA CEO & CIO Quantitative Analyst PAST PERFORMANCE SHOULD NOT BE CONSIDERED INDICATIVE OF FUTURE PERFORMANCE. Please refer to our Q4 ’12 full performance disclosure for additional information. This report was prepared by J.A. Glynn & Co., a registered broker-dealer and member FINRA/SIPC, and JAG Advisors, an investment adviser registered under the Investment Advisers Act of 1940, as amended. The information herein was obtained from various sources; we do not guarantee its accuracy or completeness. The information in this report is given as of the date indicated. We assume no obligation to update this in- formation, or to advise on further developments relating to issuer(s) discussed in this report. Additional in- formation is available upon request. The information contained in this document is prepared for general circulation and is circulated for general information only. It does not address specific investment objectives, or the financial situation and the par- ticular needs of any recipient. These materials do not contain, and are not intended to provide, information reasonably sufficient upon which to base an investment decision and should not be used for such purposes. Investors should seek financial advice regarding the appropriateness of investing in any securities discussed in this document. This document does not constitute an offer, or an invitation to make an offer, to buy or sell any securities discussed herein. J.A. Glynn & Co., its affiliates, directors, officers, employees, employee benefit programs and discretionary client accounts may have a long position in any securities listed herein. Past performance is not necessarily indicative of future performance. The views expressed are those of the adviser as of 1/7/13. Opinions expressed in this newsletter are those of the CIO, are subject to change without notice, and are not guarantees of future performance.