1. 1
What explains the behaviour of global income inequality: An
examination of the relationship between trade liberalization,
government debt to GDP ratios, human capital and income inequality.
Jamie Spencer Holmes
University of Nottingham
School of Economics
MSc Economics and Econometrics
Supervisor: Dr. Mark Roberts
This Dissertation is presented in part fulfilment of the requirement for the completion
of an MSc in the School of Economics, University of Nottingham. The work is the sole
responsibility of the candidate.
2. 2
Abstract
The importance of understanding income inequality is vital to a fair and prosperous global
economy. By informing policy, research on income inequality can help to alleviate poverty
and target the determinants of inequality in a bid to reduce income gaps between people
within a country. Panel data econometric techniques are used to explore the impact of
several macroeconomic variables on income inequality for a sample of 136 countries over
the period 1968-2008 using the consistent EHII index; static techniques are used to explore
various relationships regarding income inequality. Dynamic panel techniques are used to
account for the persistence of income inequality to estimate the inequality-growth
relationship. The results suggest that the downward sloping income-inequality relationship
holds, that human capital can be potent for reducing inequality and higher trade tariffs
increase inequality. There is some weak evidence that a higher government debt to GDP
ratio increases income inequality. The results show that the inequality-income relationship
differs among developed and developing countries, with the standard Kuznets specification
receiving more support for developing countries. Government debt to GDP ratios and
human capital have larger effects on inequality in developing countries, whereas openness
has a larger and more significant effect on inequality in developed countries. It is observed
that the upward trend in inequality in high-income countries over time is partially accounted
for by government debt to GDP, inflation, openness, human capital and growth, but there is
still an upward trend, suggesting other important factors have increased inequality.
3. 3
Contents
1. Introduction........................................................................................................................4
2. Literature review...................................................................................................................8
2.1 The effect of Inequality on growth ..................................................................................8
2.2 Measuring income inequality: EHII vs. Gini....................................................................11
2.3 The effect of growth on income inequality....................................................................15
2.4 Globalization and the behaviour of global income inequality.......................................17
3. Methodology and Hypotheses............................................................................................23
3.1 Econometric Methodology.............................................................................................23
3.2 Hypotheses.....................................................................................................................26
4. Data and descriptive statistics............................................................................................27
5. Results and Analysis.........................................................................................................36
5.1 Static Panel Data results.................................................................................................36
5.2 Dynamic Panel Data results............................................................................................44
5.3 Sensitivity Analysis .........................................................................................................46
6. Conclusion ........................................................................................................................48
7. Bibliography .....................................................................................................................50
8. Appendix...........................................................................................................................54
8.1 Panel Data Set and Country Codes .............................................................................54
8.2 Descriptive Statistics/Graphs....................................................................................195
8.3 Panel Unit Root Tests:...............................................................................................200
8.4 Estimation Outputs...................................................................................................202
8.5 Sensitivity Analysis....................................................................................................214
4. 4
1. Introduction
The question of income distribution is important, since 1970 income inequality has
increased in advanced economies and since the late 1980’s so have the developing
countries. The concentration of income regained the level attained in the 1910’s according
to tax data (Piketty, 2014). It is therefore crucial to understand the dynamics of income
distribution, which can help to reduce poverty and reduce inequalities. The rapid growth of
low income and emerging economies, such as China, may prove to be a potent force for
reducing inequalities at the global level, as the advanced nations did in the Bretton Woods
period (1945-1971). But as the balance of power shifts to emerging countries, within-
country inequality in developed countries may increase, therefore understanding its
dynamics can inform alleviative policy at the national and global level.
The importance of inequality relates to economic and social effects; higher rates of crime
and poverty are characteristic of relatively unequal cities, states and countries. Also, the
low inequality observed for countries, such as the Scandinavian countries, are associated
with higher standards of living and higher indexes of individual freedoms and rights.
Inequality also has psychological effects on people, where people are happier when
inequality is lower. Experiments with students have shown that relative prosperity is more
important to people’s happiness than absolute prosperity (Solnick & Hemenway, 1998). By
measuring and gaining a better understanding of the determinants of inequality, it can be
curbed to induce positive developments in social and economic issues.
As a consequence of Kuznet’s (1955) optimistic conclusions regarding the relationship
between inequality and long-run growth, it could be argued economists have neglected the
distribution of income and wealth. If the question of inequality is to become central again,
an extensive data set is required to understand past and present trends. This paper presents
an analysis of inequality at the global level to understand the determinants of income
inequality, by making use of the relatively consistent and reliable EHII dataset. This data
source is a complement to other sources of data such as the Luxembourg Income Study and
tax data used by Piketty (2014). An analysis of the rise of inequality in developed economies
also provides insight for policy to dampen or reverse this trend. By placing a lens on
inequality, the paper also hopes to spark interest and discussion on the role of income
distribution in economics. Multiple disequilibria observed in recent decades in financial and
5. 5
real estate markets have raised doubts concerning the ‘balanced growth path’ described by
Solow and Kuznets, where all key economic variables are supposed to move at the same
pace. Since there is no fundamental reason to believe growth is automatically balanced,
research can help to determine under what conditions growth can equalize or widen the
income distribution.
The marked rise in pay inequality, which would have surprised Kuznets, is documented by
Galbraith & Kum (2003); they show that global pay inequality increased sharply independent
of growth over the period 1980-2000. Also, by addressing some data and econometric
issues, their paper provided a foundation for a new wave of research regarding income
inequality. By using consistent manufacturing pay inequality data with better coverage than
the standard Gini index, more precise measurements of inequality are available and trends
that are not apparent in the Gini index are uncovered. The cause of rising inequality at the
global level is suggested by Galbraith & Kum (2003) to be underlying macroeconomic
factors. The data provides a more reliable picture of within-country income inequality; it is
also used to estimate household income inequality (EHII), accounting for population and the
size of the manufacturing sector, which was developed by Galbriath and Kum (2005). A large
majority of existing studies have used the unreliable Gini index to measure income
inequality. By making use of this consistent data set and macroeconomic data, this paper
measures the effect of human capital, trade openness, government debt, inflation and
growth on income inequality. Also, two related exploratory research questions are; what
accounts for the rise in global inequality and in advanced economies?
Panel data methods are used to explore these questions. This paper also differs from some
papers in the literature by accounting for the stage of development a country is in. Also,
dynamic panel data models are estimated accounting for the persistence of inequality to
determine the effect of growth on income inequality for the sample as a whole and by
development/developing categories.
Galbraith & Kum (2003) suggest the global rise in pay inequalities could be related to the
debt crisis in 1982, where several Latin American countries defaulted on their external debt.
The rises of government debt and inequality have been in tandem over the past two
decades or so. With national debts in excess of 100% of GDP in many advanced countries,
6. 6
an important question is will this affect inequality and by how much? Should the developed
nations act to reduce debt to improve future inequality? Bleaney and Nishiyama (2002) note
the absence of a theoretical guide to include variables as determinants of inequality, barring
growth, human capital and trade related variables. This motivated their general to specific
approach. Notable developments regarding theory related to debt and inequality are Salti
(2010). The sharp rise in government debt as a ratio of GDP in countries such as Ireland, Italy
and Greece in recent times have seen their governments reduce benefits such as pensions
and other cash transfers, which has contributed to a surge in inequality. Since domestic debt
is held by some but not others in a country, servicing the debt will have a distributional
effect by transferring resources in an economy. Given the absence of debt from a majority
of economic theory and empirics regarding income distribution, this paper seeks to test and
measure the relationship between income inequality and the ratio of government debt to
gross domestic product for a group of developing and developed countries and developed
countries separately. The results show that the government debt to GDP ratios has a more
significant and larger effect on inequality in developing countries than in developed
countries. The results from the estimation without the influential observations show the
government debt variable has a positive effect on inequality, implying that higher
government debt to GDP ratios increase income inequality.
The results also shows that for high-income countries, the effects of inflation, human
capital, government debt to GDP, trade openness account for a significant portion of the
upward trend of inequality over time. The results show that contrary to the Heckscher-Ohlin
trade theory, that lower tariff rates decrease income inequality in both developed and
developing countries. The effect of human capital on reducing inequality is much stronger in
developing countries, as expected. The results generally support the augmented Kuznets
curve for developed countries, where inequality declines but then slightly increases as
incomes per capita rise.
Section 2 provides a literature review regarding the Kuznets relationship and other
relationships that involve determination of income inequality. Section 3 provides the
econometric methodology and the hypotheses of the paper. Section 4 provides an overview
of the data and discussion of the results of the panel unit root tests. Section 5 presents the
7. 7
results and analysis of the panel methods. Section 6 provides an evaluation and summary of
the paper and suggestions for further research.
8. 8
2. Literature review
2.1 The effect of Inequality on growth
One important question related to the economic development literature is; has inequality
been falling or rising? Income inequality can be measure in three ways; un-weighted
between country inequality, weighted between country inequality and within-country
inequality. The first two regard the inequality differences across countries whereas the third
way is concerned with inequality between citizens of one nation Milanovic (2002). The first
way of measuring inequality has been shown to be rising in most studies in the literature.
The second way of measuring inequality has been falling, due to China’s reduction of
income inequality. Concerning the third way of measuring inequality, it cannot be said for
definite whether it has been rising or falling. Existing studies on within-country inequality
have given conflicting results. A survey by Milanovic & Squire (2005) show that different
conclusions have arisen; Sala-i-Martin’s (2002, cited in Milanovic & Squire, 2005) paper
claims within country inequality has been steadily falling, then a slight rise. However, the
method of combining household survey data and national accounts while making strong
assumption in place of sufficient data requirements is questionable.
The literature on income inequality can be categorized into two broad strands: the effect on
inequality on growth and the determination of income inequality. Most of the latter
involves testing the Kuznets hypothesis and the Heckscher-Ohlin-Samuelson trade theorem.
The literature can also be categorized by the methods that are applied; cross-sectional,
panel and dynamic panel data methods have been used. As developments have been made
in econometric theory regarding panel data estimators, they have been applied to
estimating the relationship between income inequality and various macroeconomic
variables. Since panel data provides more information and more reliable inferences than
cross-sectional methods, the focus will be on the segment of the literature that uses these
methods.
The effect of inequality on growth is important for policy. It is especially relevant for
developing countries. Some have decided to forgo redistributive efforts until the economy
has experienced sustained, high growth levels. China used policy to let the coastal regions
experience rising incomes first and once growth was sustained, focus turned to inequality.
9. 9
Brazil has similarly targeted high growth rate in the 1990’s and then from the mid-2000’s
turned attention to redistributive policies to reduce inequality. Brazil’s experience seems to
support the ‘efficiency then equity’ argument; what is the theory behind this approach? One
theory proposed by Galor and Tsiddon (1997) is that technological progress raises inequality
and increases the concentration of skilled workers in advanced sectors. A high
concentration of skilled workers in technologically advanced sectors stimulates future
growth and technological progress. However, when technologies become more accessible
inequality decreases and as the reduction in the concentration of skilled workers declines,
future growth prospects are dampened.
On the other hand, lower inequality may help boost growth, especially in a democracy.
Median voter theory, which relies on the democratic determination of taxes, proposes that
a median voter’s distance from the aggregate capital endowment in the economy increases
with the aggregate inequality of wealth; they will be led to approve a higher tax rate. This in
turn reduces incentives for productive investment, dampening growth. According to this
theory, democratic countries with an unequal wealth distribution should be characterized
by high taxes, low growth and low investment. Therefore, inequality and economic growth
have a negative relationship, reducing inequality will increase growth. The post-war OECD
data weakly supports this theory.
Persson and Tabelinni (1994) find that income inequality has a negative effect on economic
growth. The overlapping generations model is used to show that a more equitable
distribution of income increases growth. Inequality is harmful to growth as it leads to
policies that fail to protect property rights and do not allow full private appropriation of
returns from investment. The positive correlation between initial income inequality and
growth is only found in democratic countries, but the nature of the political regime does not
affect how other variables affect growth. These findings are important as they suggest that
the effect of inequality on growth may operate through a political channel. By decomposing
the regressions to reflect the channels suggested by this theory and estimating reduced
form equations, their results from this exercise further supports the theory for OECD data.
The Partridge-Barro hypothesis (Bleaney & Nishiyama, 2002) is that the effect of inequality
on growth is negative at low levels of per-capita income but positive at high levels of per-
10. 10
capita income. Bleaney et al. (2002) test this by splitting their sample, but find no evidence
in support of this hypothesis. The coefficients on income inequality are similar across low-
income and high-income countries for their ‘reliable’ sample and their sample that gave the
largest possible observations.
A substantial amount of studies on the effect of inequality on growth find that the
relationship is negative and statistically significant. However, the majority are based on
parsimonious specifications. Using more additional explanatory variables to explain growth,
the relationship seems to change to a positive one, providing empirical support for the
‘efficiency then equity’ argument. Bleaney and Nishiyama (2002) use a general to specific
methodology showing that initial income inequality has a positive but statistically
insignificant coefficient when accounting for other variables that affect growth.
Castello-Climent (2010) investigate the effect of income inequality and human capital
inequality on economic growth. To control for country specific effects and the persistency of
inequality, estimate a dynamic panel data model using systemGMM, as the first differenced
GMM technique used by Forbes (2000) may not be appropriate when income inequality is
highly persistent. The results show a different effect of inequality on growth depending on
the level of development of the region; a negative relationship between income and human
capital inequality and economic growth for low-income and middle-income countries, but
not for high-income countries. High income inequality positively impacts growth in
advanced economies and this finding is robust to using different measures, such as from the
Luxembourg Income Study, the Gini index and ratios of incomes accruing to the top middle
and bottom percentiles.
Herzer & Vollmer (2012) use heterogenous panel cointegration estimators to estimate the
relationship between inequality and growth. Heterogenous panel cointegration estimators
are robust under cointegration to estimation problems that afflict panel regressions such as
omitted variables bias, slope heterogeneity and endogeneity. Both the long-run growth of
income and income inequality are found to be cointegrated. Using dynamic OLS, they find
that a 1% increase in income inequality decreases per capita income by 0.013%. A one
standard deviation increase in income inequality decreases per capita income by 9.35% of
the standard deviation of per capita income. The effect of a decrease in inequality on per
11. 11
capita income is about as half as large as the effect of an increase in the investment share.
Regardless of whether a country is developed/developing or a democracy/non-democracy,
they find that long-run relationship between income inequality and per capita income
growth is negative and significant.
2.2 Measuring income inequality: EHII vs. Gini
An important consideration when evaluating these results is the reliability and comparability
of the data used. Atkinson & Brandolini (2001) state that data quality and data consistency
are often overlooked by economists; the Deneinger and Squire (1998) Gini data set has
different reference units for different countries, some are before-tax, some are after-tax,
some are consumption based, others income based, some are at the individual level, others
are at the household level. The sources and methods vary in their quality across countries as
well. This has implications for the econometric work using this data; are the results genuine
features of inequality or are they the product of data differences across countries?
To get around the problem of differences in definitions, some researchers have used
dummy variables to represent regions; however, adding group specific constants may cause
inference to be conditional on the countries in the sample. This approach is suggested not
to be an adequate substitute for a data set where the observations are as consistent as
possible. Also, there is no adjustment for the size or composition of the reference unit in the
Deneinger & Squire data set. Moreover, the observations are not consistent across
countries, as Gini data suggest that Indonesia and India are more equitable societies than
Japan and Australia, which seems highly doubtful. Some researchers stress that India and
Indonesia have egalitarian but impoverished agricultural workers, so the inequality does not
appear. However, assuming this were true, the D&S Gini measure would not be very high in
Africa, where most countries have a large agriculture sector. Also, large jumps in inequality
are found for some countries and this is a concern as inequality is not likely to increase or
decrease rapidly over the course of one year. Atkinson & Brandolini’s main conclusion is
that there is no real alternative to seeking data sets with consistent observations.
Many researchers have used the Gini as a measure of income inequality; such as Barro
(2000), Forbes (2000) and Chen (2003). The results of panel econometric studies on
12. 12
inequality have that used the Gini index as a measure of inequality are subject to errors and
the inferences are biased due to the inconsistency and sparseness of the Gini data set. One
of the main arguments of Galbraith & Kum (2003) is that the D&S data set is not adequate; it
is an unbalanced panel, there is a lack of comparability across countries, inequality is
measured using different definitions and reference units and some countries have few
and/or spread out observations. Therefore, the reliability of the D&S data set is
questionable. Secondly, even if it were reliable, the distribution of non-labour income may
mask the Kuznets relationship. The motivation behind the article by Galbraith and Kum is to
obtain reliable statistical inference concerning the relationship between inequality and
growth/development by considering data that is more comparable across countries. It is
also motivated by the ‘bad econometrics’ found in the literature, i.e. the reliance on just
cross-sectional analysis by some researchers. Trygve Haavelmo, one of the pioneers of
econometrics, delivered an important insight; if natural variations in economic factors are
properly accounted for, these factors could act as a surrogate for absent experimental
controls (Hoover, 2005). The D&S data set does not capture variations in inequality to a
satisfactory standard due to limited coverage, an unbalanced panel data set and that
different sources are used to calculate inequality.
To get around these problems, Galbraith & Kum propose using measures of inequality of
manufacturing pay since this is a more consistent measure of inequality. Theoretically, the
evolution of inequality in manufacturing earnings and the evolution of inequality of earnings
in other sectors will rarely move in opposite directions. Galbraith & Kum follow an
econometric methodology that seems to be a theory-of-errors approach, more so than the
probabilistic reduction approach. The theory-of-errors approach takes regression to be a
tool of approximation of known theoretical relationships applied to empirical data (Hoover,
2005). According to this methodology the role of regression is to measure, instead of test,
certain factors or phenomenon. By estimating fixed effects, the authors measure within
country inequality and also time effects, i.e. the effects on inequality not due to economic
development or the rate of economic development. Instead of what other papers have
done in the development literature, which was to test the hypothesis that coefficient on
GDP per capita is positive and the coefficient on the square of GDP per capita is negative,
13. 13
Galbraith & Kum (2003) have attempted to measure the effect of growth on manufacturing
pay inequality using panel data estimation techniques.
Using the Theil index, they find no significant effect of inequality on subsequent growth,
conflicting with the result of Forbes (2000) that high inequality will increase subsequent
growth. Also, they find evidence of an augmented Kuznets curve for OECD countries. This
relates to rising income inequality in rich countries due to a dualism of advanced technology
and services. Generally speaking, the relationship between pay inequalities and income for
most countries is downward sloping, but for high income countries, the relationship
reverses slightly.
Also, measurement error is not as problematic as with the D&S dataset, manufacturing pay
measured accurately in most countries for more than 40 years. Galbraith & Kum’s inequality
measure is based on a 2 or 3 digit code of the International Standard Industrial Classification
a single systematic accounting framework and these manufacturing pay inequalities are
documented by UNIDO. Using the Theil between-group t statistic as the inequality measure,
they estimate cross-sectional and panel models. Comparing the Theil T statistics and GINI
coefficients from the D&S dataset for 4 countries, the authors illustrate that both these
measures can have very similar series but also can have divergent series. For example, the
two measures show different trends over time for Finland and Canada, possibly due to
measurement error, missing observations, etc.
The between-groups component of a Theil inequality measure provides a lower-bound
estimate of total inequality, which is a generally accepted argument. The correlations
between the inequalities in manufacturing pay are high across other measures of inequality
and following this, manufacturing pay dispersions are a robust indicator of the behaviour of
broader and often elusive economic distributions (Galbraith, 2007). Theil’s measure has all
the desirable properties that an inequality measure should have; symmetric, replication
invariant, mean independent and satisfies the Pigou-Dalton property (Conceicao &
Galbraith, 2000) whereas the GINI measure only has some of these properties.
Then, the authors go on to show that the sparseness of the D&S data set hides several
important features that the new UNIDO dataset reveal; within-country inequality is higher
for developing countries, both OECD and non-OECD countries experience rising pay
14. 14
inequality since the 1980s and the gap in pay inequality between developed and developing
countries remains nearly steady over 40 years. However, the D&S dataset suggests that
OECD countries have not experienced increased inequality since the 1980s, despite the fact
that inequality has increased substantially in OECD countries.
The estimated household income inequality (EHII) combines the advantages of two sets of
observations on income inequality. The Gini coefficient has the advantage of an intuitive
interpretation but requires comprehensive individual level data. On the other hand, the
Theil statistic for the inequality of manufacturing sector pay allows effective use of group
data but has no intuition underlying it. The calculation of the EHII from the UTIP-UNIDO
industrial pay statistics is based on a regression of overlapping observations on the original
D&S dataset of Gini coefficients. The regression controls for the share of manufacturing
workers in the total population and for the type of measure involved in the Gini
observations; dummy variables for Gross, equalling one if the Gini is based on a gross
measure and zero if the Gini is based on a net measure. Another dummy variable for
household, differentiating between individual and household observations and a dummy for
income, differentiating between Gini observations based on income and those based on
expenditure.
The EHII is calculated using the coefficient estimates of the log of the UTIP-UNIDO measures
and the manufacturing population ratio. The residuals from the whole regression can then
be used to determine where the Gini measures over-report or under-report inequality. The
EHII index takes these measurement errors into account. All coefficients in the regression
are standardized on the concept of gross household income, so this inequality measure
estimates the inequality in the presence of all cash inflows, including government transfers
such as benefits, state pensions, healthcare and so on. However, it does not account for
taxes and does not incorporate household disposable income.
EHII is measure built ‘on top’ of D&S GINI index, method suggested by Atkinson & Brandolini
(2001) has three advantages over GINI; 3000 observations as compared to 700 ‘high-quality’
observations in the D&S dataset. EHII data from UNIDO, changes in pay dispersion are thus
reflected in income inequality. All estimates are also adjusted to household gross income –
making the measure more congruent. The literature contains only a handful of studies on
15. 15
whose results we can trust, i.e. those studies that have not used the Gini index as a measure
of income distribution. The following studies use the more comparable and consistent EHII
measure; Meschi & Vivarelli (2009) and Lin et al. (2006). This measure can be used to
ascertain the effect of particular variables on income inequality, providing more reliable
inferences than previously possible.
2.3 The effect of growth on income inequality
The main theory on the inequality-development relationship is the ‘Kuznets curve’.
According to Kuznets (1955), the relationship between inequality and economic
development follows an inverted-U pattern with inequality rising at the initial stages of
development and then falling. Kuznets’ model is a demand-pull model, where growth in
demand encourages labour-saving technological change. This favours the demand for
capital and skilled workers, increasing pay inequality. Later on in the course of development,
the labour saving tendency attenuates and more egalitarian forces, such as a rise in human
capital (and consequently a rise in the supply of skilled workers) are allowed to have their
impact.
Income inequality would automatically decrease in advanced phases of capitalist
development, regardless of economic policy choices or other differences between countries,
until it eventually stabilized at an acceptable level. Kuznets (1955) used tax data to show
that the upper decile of the income distribution decreased significantly over the period
1913-1948. Earlier classicaleconomists could only theorize and had not substantially
objective data to rely on. The sharp reduction we observe for rich countries between 1914
and 1945 were due to war and the economic and political shocks. It has little to do with the
tranquil process of inter-sectoral mobility described by Kuznets.
Various studies have examined the relationship between inequality and income, where the
distribution of income is determined by the distribution of pay, capital income and
entitlements. These studies may have failed to find the Kuznets relationship because they
focus on income rather than pay; the relationship may be unobservable in income but
observable for pay. Moreover, the focus is mistakenly placed on testing the Kuznets
16. 16
hypothesis in the literature; it has become a statistical exercise with no consideration of
institutions and history. What is important is the causal force of inter-sectoral transitions.
Kuznets has offered a general method for coming to some expectation concerning the
pattern of inequality that might be reasonably expected; we should assess inequality as a
matter of an appropriate pattern of inter-sectoral transitions (Galbraith, 2007). Also, many
studies have ignored the level of development and this could affect the inequality-growth
relationship as suggested by Osborne (2006) and others
Deininger & Squire (1998) do not find the presence of the Kuznets curve in the fixed effects
case for their functional form, but this does not rule out that it exists for a different
functional form. Most papers have used a parametric approach to testing the Kuznets
hypothesis, with conclusion varying depending on the functional form being used. To obtain
more descriptive results than a hypothesis test, Frazer (2006) uses an overlapping non-
parametric approach to explore the relationship between inequality and income both in the
pooled relation and within and between countries as they have developed. Studies that
have explored the Kuznets hypothesis have been criticized in three ways; comparability of
data across countries, the parametric form used and the cross-sectional nature of these
tests. The functional form chosen to test the U-shape hypothesis can have considerable
impact on the turning point of the curve. Frazer (2006) avoids questions and issues of
functional form by using nonparametric analysis. Finds little evidence for the Kuznets
hypothesis. Kuznets effect wanes when using nonparametric analysis and considering
confidence intervals. Technique of overlapping nonparametric regressions has the following
advantage; cross country empirical studies are criticized for describing relationships that
hold across countries but not within countries as they develop. Running fixed effects
regressions on cross country panel data does not allow for different processes to be at work
in different countries. Allowing coefficients to vary across countries allows for this
heterogeneity, but this can lead to misleading results, as the relationship across countries is
restricted to the parametric functional form being estimated.
Lin, Huang & Weng (2006) apply a semi-parametric partially linear regression to investigate
the existence of an inverted U-shaped relationship between income inequality and
development. In testing Kuznets hypothesis, most studies follow the approach of regressing
GINI coefficients on GDP per capita and its squared term, along with other explanatory
17. 17
variables. This approach may be subject to model misspecification, so that the results may
be incorrect. A more flexible approach is to let the data speak for themselves instead of
imposing a specific functional form. Huang (2004) uses a flexible non-linear inference
approach to test for the validity of an inverted-U Kuznets curve. Although his empirical
results detect non-linearity, the inverted U link between GDP per capita and inequality is still
verified. Lin et al use the semi-parametric partially linear regression approach (PLR). For
both parametric and semi-parametric estimation, they find evidence in favour of Kuznets
hypothesis and the GDP per capita variables remain significant whether or not additional
explanatory variables are included. This finding is robust to different inequality measures;
the GINI and the ratio of incomes between the most developed and least developed regions
of a country.
2.4 Globalization and the behaviour of global income inequality
From the existing literature, it seems that growth reduces inequality, but this may depend
on the stage of development a country is at. The yearly effects from Galbraith & Kum (2003)
and the construction of a consistent data set with wide coverage, the EHII index, show that
within-country income inequality has been rising globally. There are many variables that
could have precipitated this global rise in inequality.
For developing countries, after trade liberalization, they can export more of their goods and
receive foreign direct investment from capital-rich countries. According to the simplest
version of the Heckscher-Ohlin-Samuelson (HOS) model, developing countries tend to
export low-skill intensive products, as low-skilled labour is the abundant factor in
developing countries. Since in developed countries, the abundant factor is skilled labour and
these countries tend to export skill-intensive products. This should reduce the relative
wages of highly-skilled workers in developing countries. Approximating income inequality by
the ratio between high-skilled and low-skilled labour wages, income inequality within
developing countries should decrease. However, income distribution in developed countries
should increase. These results derive from the price-equalization theorem.
18. 18
Furthermore, as developing countries go through the process of development, which entails
improvements in human capital, the relative supply of high-skilled labourers increases
compared to low-skilled labourers. This will further reduce the wage differential between
high- and low-skilled workers and contribute to a reduction to income inequality. However,
if we consider three types of labour instead of two (no education, low education and high
education), openness is low-income countries might increase inequality. Openness may
encourage movement from low skilled sectors to medium-skilled sectors where wages
differences are larger. So even though the inequality between high-skilled and low-skilled
workers decreases, the overall income inequality may increase due to a larger wage
differential in the medium-skilled sectors.
There is empirical evidence that the conditional effects of trade liberalization on inequality
are correlated with relative factor endowments (Gourdon, et al., 2007). One study finds that
endowments matter as according to the standard Heckscher-Ohlin theory; trade
liberalization is associated with increases in inequality in countries that are relatively well
endowed with capital and highly skilled workers. However, trade liberalization is associated
with decreases in inequality in countries relatively well endowed with primary
educated/unskilled workers and arable land.
Meschi & Vivarelli (2009) is one empirical paper that uses the EHII index as a measure of
inequality and investigates the effect of trade on inequality since the 1980’s in developing
countries. According to Robbins skill enhancing trade hypothesis, inflows of technology and
practices leads to an increase in demand for skilled labour and increases income inequality
in developing countries. Few empirical studies unambiguously support the predictions of the
HOS theorem; majority of cross country studies show no relationship or clearly contradict
the distributive outcomes of traditional trade theory, e.g. Barro (2000). Meschi & Vivarelli
(2009) adopt a dynamic specification since the EHII measure is highly persistent, including
the lagged value can account for the path-dependent nature of inequality. Dynamic
specification with fixed effects allows ignorance of time invariant and quasi fixed factors,
but still includes some controlling variables which may change over the short term, such as
inflation and the lagged value of human capital. People’s income in lower income groups are
disproportionately affected by inflation as it erodes their real wages at a greater proportion
than other income groups.
19. 19
Their findings confirm the results of previous studies that failed to find any strong
relationship between within country income inequality and trade. Inflation and
contemporaneous supply of education have the expected signs. However the insignificance
of trade may be due to composition effects, since it is trade with richer countries that
increases the demand for skilled labour and increases inequality. However, they do find that
only trade with high-income countries worsens the income distribution for middle income
economies. The results suggest that the HOS theory does not apply to the current
globalization, as increases in income inequality are a consequence of skill enhancing trade.
It is difficult to reconcile the results of papers that study trade liberalization and within
country income inequality, as different time periods and countries are covered and different
definitions of trade liberalization are used. One implication from the existing results is that
categorization of countries may be important. Ravallion (2002) and Milanovic (2005) find
that openness increases income inequality in low-income countries.
Salti (2010) looks at the composition of public debt and its effect on income inequality.
While access to public debt products as savings instruments for lenders are primarily
reserved for the higher end of the income distribution, the burden of debt financing falls on
the entire tax base. In the case of domestic public debt, since it tends to be held by domestic
lenders, involves a transfer of resources. The main finding is that the domestic share of
public debt is consistently regressive on income inequality for a range of specifications. The
mainstream view that national debt has no implications for the distribution of income has
been examined and refuted in a series of empirical and theoretical papers in the Post
Keynesian literature.
Government debt could also influence inequality, specifically the ratio of government debt
to GDP. As this measure increases, the interest payments increases and the domestic
holders of government debt generally pay higher rates of interest. The increased costs of
servicing the debt will divert government resources away from redistributive cash transfers,
such as pensions, thereby reducing the incomes of low-income households and contributing
to income inequality. The results in Salti (2010) applies for domestic share of government
debt, but could also apply to external debt too. Azzimonti, et al. (2012) proposes a multi-
20. 20
country political economy model with incomplete markets and endogenous government
borrowing. Their theoretical prediction is that governments choose higher levels of public
debt when financial markets become more integrated and income inequality increases. As
financial markets integrate globally, external debt increases as the mobility of capital
increases, allowing more borrowing. Governments take advantage of this and choose higher
levels of debt. As the debt servicing increases when the debt becomes a larger proportion of
GDP, this reduces government investment in human capital and redistributive cash
transfers, negatively impacting income inequality. Azzimonti, et al. (2012) conduct an
empirical analysis to test their theory and using data from the OECD, they find that their
theoretical predictions are supported by the data.
Bleaney & Nishiyama (2002) look at how inequality evolves over time and the impact on
growth. Using the general to specific methodology, they find the only robust feature is
inequality convergence. The general to specific methodology starts with a broad general
specification then searches over the space of possible restrictions to find the most
parsimonious specification. However, the general to specific methodology is not an essential
element of econometric methodology; the data generating process assumed at the start of
any search is “local” and not the true one. Its specification is based on common sense,
availability of data and exploratory data analysis. Since there is no direct access to the true
specification, there is no way to demonstrate that the local data-generating process is itself
a legitimate one.
But it has a strong heuristic justification; it ensures that the space of alternative
specifications is fully explored. Consequently, using this particular methodology minimizes
the risk of ignoring relevant competing specifications and ensures no information is lost
relative to the general specification. The criticism of this approach is that it is a form of data
mining; the large number of sequential tests renders the reported test statistics
uninterpretable. On the other hand, Monte Carlo studies suggest that the general to specific
methodology has a high ability to recover the true specification.
Bleaney & Nishiyama use two different samples; one that has reliable observations and one
with the largest possible number of observations. In the reliable sample, tropical location
was found to have a strong negative impact on the change in income inequality, whilst
21. 21
government savings and democracy have a strong positive impact. In the larger samples of
unreliable data, the fertility ratio has a significant negative impact on the change in income
inequality. The only variable significant in both samples is initial income inequality, which
has a highly significant coefficient. This suggests strong convergence of income equality,
independent of other factors, similar to the results of Ravallion (2001), except that Ravallion
used a sample of regions within a country. It is possible that this finding reflects
measurement error; if measurement errors in income inequality at different dates are only
partially correlated, then there will be apparent mean reversion in the measurement error
component of income inequality. This suggests that mean reversion would be weaker for
more reliable data. However, they find that this is not the case, providing empirical evidence
that convergence in income equality is an authentic feature of the data. The evolution of
income inequality appears to be dominated by convergence to the mean, though at a much
faster rate in the OECD countries than in the developing world. Since OECD countries tend
to have more reliable data, income equality convergence is a feature of the data.
Jaumotte, et al., (2013) investigate the causes of the sustained increase in inequality for the
period 1981-2003, specifically looking at the impact of technological progress and
globalization. Trade liberalization and export growth are found to be associated with lower
income inequality whereas increased financial openness is associated with higher inequality.
Financial globalization and technological progress benefit mainly that richest quintile of the
population. However, the inequality measure used in this study is the Gini index, making the
results unreliable. They use fixed effects estimation and find that the impact of globalization
on inequality differs between developed and developing countries, where the impact of
globalization is more pronounced on inequality in developed countries.
Many of the studies in the literature suggest that a given factor will affect inequality
differently depending on whether the country is developed or developing. Consequently,
mixing countries at different stages of development in the same pool may give misleading
conclusions. Most studies have used Gini index for the measure of inequality, which has
limitations and the EHII is a more consistent data set. By estimating separately for
developed and developing countries for a larger number of observations, more reliable
inferences are sought on the determinants of income inequality. Only trade related
variables and economic development have been examined using this measure. Therefore,
22. 22
this paper fills in the gap by measuring the effect of human capital, government debt to GDP
ratios, inflation, per capita income growth and trade openness on the EHII. The literature is
also quite silent on the role of government debt on the income distribution. Whereas one
study has found effects of household and government debt on inequality, this study
examines government debt to GDP ratios as an alternative measure to ascertain its
relationship with inequality. Also, the analysis of Galbraith & Kum (2003) is updated using a
more recent dataset with more observations and takes a more appropriate approach to
estimation. For example, the convergence in income inequality implies that a lagged income
inequality variable should be included in the specification. However, this will make the fixed
effects estimator inconsistent. Therefore, we extend and update the analysis of Galbraith &
Kum, using fixed effects estimation and also dynamic panel data estimation techniques.
23. 23
3. Methodology andHypotheses
3.1 Econometric Methodology
3.1.1 Static Panel data modelling
Instead of using a general to specific methodology, the approach used is the theory-in-
errors approach. This methodology takes regression to be a tool of approximation of known
theoretical relationships applied to empirical data. In this case, regression is used to
measure the effects of human capital, the ratio of government debt to GDP, trade
openness, inflation and economic development on income inequality. The natural
logarithms are taken each variable so that the coefficients can be interpreted as elasticities.
Firstly, estimation of equation (1) is conducted using ordinary least squares regression as a
baseline for analysis.
𝑙𝑛(𝐸𝐻𝐼𝐼)𝑖,𝑡 = 𝛽1 ln( 𝐺𝐷𝑃𝑃𝐶)𝑖,𝑡 + 𝛽2ln(𝐺𝐷𝑃𝑃𝐶)𝑖,𝑡
2
+ 𝜀𝑖,𝑡 (1)
Then to account for possible omitted variables bias and country heterogeneity, individual
effects models are estimated. Tests are run to determine whether ordinary least squares is
inconsistent and to determine whether the fixed effects or random effects is appropriate.
We also estimate separately for countries by developed/developing and low-
income/middle-income and high-income to examine the robustness of the results.
𝑙𝑛(𝐸𝐻𝐼𝐼)𝑖,𝑡 = 𝛽1 ln( 𝐺𝐷𝑃𝑃𝐶)𝑖,𝑡 + 𝛽2ln(𝐺𝐷𝑃𝑃𝐶)𝑖,𝑡
2
+ 𝑢 𝑖 + 𝜀𝑖,𝑡 (2)
Panel data by nature is likely to suffer from serial correlation and heteroskedasticity.
Moreover, as social norms and psychological behaviour patterns typically enter panel
regressions as unobservables, complex forms of spatial and temporal dependence may arise
even when the cross-sectional units are randomly and independently sample. If there is
cross-sectional dependence in the panel data, the standard error estimates of the
commonly applied covariance matrix estimation techniques are biased and so is any
resulting statistical inference (Baltagi, 2008).
24. 24
Large macro panels with large N and large T, with countries possibly belonging to the same
group may be affected by cross-sectional dependence; arises when, for example, the GDP
series of several countries are correlated with each other and leads to biased inference if
not accounted for. This problem is especially acute for cointegrated panels, the results of
tests and the estimators are significantly biased.
The specification in equation (2) is also estimated with a nonparametric covariance
estimator that is robust to general forms of spatial and temporal dependence, as well as
serial correlation and heteroskedasticity. This estimator is known as the Driscoll-Kray
estimator. It is based on asymptotic theory and is relevant to the study as the number of
cross-sections and time period are both quite large, whereas if the time periods were small,
more caution would be necessary in interpreting the Driscoll-Kray standard error estimates.
The longer the time series dimension, the better calibrated these standard errors are.
The time effects are estimated using year dummies to examine the global trend of income
inequality independent of GDP per capita and its changes, shown in equation (3).
𝑙𝑛(𝐸𝐻𝐼𝐼)𝑖,𝑡 = 𝛽1 ln( 𝐺𝐷𝑃𝑃𝐶)𝑖,𝑡 + 𝛽2ln(𝐺𝐷𝑃𝑃𝐶)𝑖,𝑡
2
+ 𝛽31963 + 𝛽41964 + ⋯+
𝛽46 2008 + 𝑢 𝑖 + 𝜀𝑖,𝑡 (3)
An important question related to this is, what accounts for the observed trend of global
income inequality? To explore this question, several macroeconomic variables are added to
the model. The time effects are re-estimated and the new global trend of income inequality
will show the effects of these variables on the trend of income inequality. The lagged value
of school enrolment is used, as the effect of school enrolment on income inequality is not
immediate. As the measure of openness is only available from 1988 onwards, the year
effects will only be estimated for 1989-2008, shown in equation (4).
𝑙𝑛( 𝐸𝐻𝐼𝐼)𝑖,𝑡 = 𝛽1 ln( 𝐺𝐷𝑃𝑃𝐶)𝑖,𝑡 + 𝛽2 ln( 𝐺𝐷𝑃𝑃𝐶)𝑖,𝑡
2
+ β3 ln (
𝐷𝐸𝐵𝑇
𝐺𝐷𝑃
)
𝑖,𝑡
+
𝛽4 ln( 𝐼𝑁𝐹𝐿𝐴𝑇𝐼𝑂𝑁)𝑖,𝑡 + 𝛽5 𝑙𝑛(𝐻𝐶𝐴𝑃𝐼𝑇𝐴𝐿)𝑖,𝑡−1 + 𝛽6 𝑙𝑛( 𝑂𝑃𝐸𝑁𝑁𝐸𝑆𝑆)𝑖,𝑡 +
𝛽71989+ ⋯+ 𝛽362008 + 𝑢 𝑖 + 𝜀𝑖,𝑡 (4)
25. 25
3.1.2 Dynamic Panel Data modelling
There is considerable empirical evidence that inequality is persistent and future inequality
depends on its present state, specifically Bleaney and Nishayama’s (2002) finding and the
fact that an AR(1) fixed effects regression1 of EHII on its lagged value gives a coefficient
estimate of 0.8805, with the 95% confidence interval ranging from 0.8648-0.8962. To
account for this, a dynamic panel data model is estimated to provide more reliable
inferences. The fixed effects, also known as the least square dummy variable estimator, is
inconsistent if a lagged value of the dependent variable is included in the equation. A Monte
Carlo study by Judson & Owen (1999) finds that for T=30 and N=100, the bias of fixed effects
can be as much as 20% of the true coefficient value. One possible procedure is to use the
GMM Arellano and Bond estimator; however, this method is only efficient asymptotically
making it unsuitable for small samples.
𝑙𝑛(𝐸𝐻𝐼𝐼)𝑖𝑡 = 𝛼 + 𝛾1ln(𝐸𝐻𝐼𝐼)𝑖,𝑡−1 + 𝛽1 ln( 𝐺𝐷𝑃𝑃𝐶)𝑖,𝑡 + 𝛽2ln(𝐺𝐷𝑃𝑃𝐶)𝑖,𝑡
2
+ 𝑢 𝑖 +
𝜀𝑖,𝑡 (5)
Instead, Judson & Owen (1999) and Bruno (2005) suggest an alternative estimator, the least
squares dummy variable corrected (LSDVC) estimator. The fixed effects estimator of 𝜎𝜀
2
is
inconsistent and the variance of the error term can only be consistently estimated when the
fixed effects estimators for 𝛾 and 𝛽 have been biased-corrected. The procedure of finding
bias-corrected estimates is achieved via an iterative procedure; to obtain the first-step
estimates of 𝛾 and 𝛽, the fixed effects estimate of 𝜎𝜀
2
is used. The estimates of 𝛾 and 𝛽 are
then used to compute the 1-step estimate of 𝜎𝜀
2
. The 1-step estimate is used to obtain the
2-step estimates of 𝛾 and 𝛽. These iterations are continued until convergence is reached,
giving the bias-corrected estimates of equation (5) (Bruno, 2005).
This procedure does not produce analytical standard errors and the estimated asymptotic
standard errors may provide unreliable t-statistics. The statistical significance of the LSDVC
coefficients are tested using bootstrapped standard errors with 200 iterations. The
1 Estimation results from this regression areshown in the Appendix – Section 8.2.
26. 26
advantage of this is that the inferences made do not rely on any restrictive assumptions
about the error terms, such as normality.
In small samples the LSDVC estimator outperforms the IV-GMM estimators. Using Monte
Carlo simulations, Bun and Carree (2002) find that the invariance of the LSDVC estimator
seems to be an important advantage over the system-GMM estimator. Simulation results
based on various designs showed that based on a root mean square error criterion the
LSDVC estimators performed well against system-GMM estimators. The LSDVC estimator
has desirable asymptotic properties for data with finite T and large N, but is derived under
restrictive assumptions; homoscedasticity of the disturbances, strict exogeneity of the
regressors and balanced panel data sets. Bruno (2005) extends the estimator to unbalanced
panels and this is the estimator used in this study.
3.2 Hypotheses
Hypothesis 1: 𝛽1 > 0, 𝛽2 < 0
Kuznets hypothesis; income inequality first increases as national income per capita grows
then decreases over the course of development. The reverse of this is the augment Kuznets
hypothesis, where inequality decreases then slightly increases at high levels of income.
Hypothesis 2: 𝛽5 < 0
Human capital decreases inequality by increasing the supply of skilled workers and thereby
reducing the skilled-unskilled wage gap. The coefficient should be negative, as increases in
human capital will reduce inequality.
Hypothesis 3: 𝛽6 > 0 for developing countries, 𝛽6 < 0 for developed countries
The HOS theorem implies that higher tariff rates increase income inequality in developed
economies but decreases income inequality in developing countries, so we should expect a
positive coefficient for developing countries and a negative one for developed countries.
Hypothesis 4: 𝛽3 > 0
An increase in government debt relative to GDP increases inequality in both developed and
developing economies, so the coefficient is expected to be positive.
27. 27
4. Data and descriptive statistics
Table 1 – Variables and Definitions
Variable Definition Source
EHII
Estimated household income
inequality, index ranging from 0 to
100. Standardizedon gross household
income. Based on Gini and UTIP-
UNIDO industrial pay inequality.
University of Texas Inequality Project,
2008
GDPPC
Gross domestic product per capita.
Measured in current international
dollars and adjusted for Purchasing
Power Parity. A measure of
development and long-run growth
World Bank - World Development
Indicators database, 2012
Hcapital
Gross enrolment rate for secondary
school (%), a proxy for human capital
World Bank - World Development
Indicators database, 2012
Inflation GDP deflator (%)
World Bank - World Development
Indicators database, 2012
openness
A proxy for trade liberalization,
definedasthe applied,weighted tariff
(%)
World Bank - World Development
Indicators database, 2012
govdebtGDP
The ratio of gross central government
debt to GDP (external and domestic,
%)
Reinhart & Rogoff, "This Time is
Different",
http://www.reinhartandrogoff.com/data/
browse-by-topic/topics/9/, 2010
Table 1 presents the variables, their definitions and their sources and Table 2 shows some
summary statistics. The minimum value of the inequality measure is around 20, the value
for some Scandinavian countries, whereas the maximum value is just below 60, reflecting
inequality in low-income countries, such as Angola for example. The mean value is roughly
28. 28
in the middle, at around 42 for the whole sample period. GDP per capita also varies widely,
from $49 to over $100,000. Data is available for around 130 countries for all variables,
excluding the government debt to GDP ratio. All variables have a wide variation as shown by
the minimum and maximum values. There could be some influential observations, as hyper-
inflation is contained within the sample, as shown by the maximum inflation value of
13,611%. Similarly, there could be influential observations for government debt to GDP, the
maximum government debt, 1209.3% of GDP, is due to the experience of Nicaragua in the
debt crisis of the 1980’s. The human capital measure also exceeds 100% for developed
countries, as the rate of enrolment is a gross measure, which provides more observations
than the net measure. Pupils repeating or skipping ahead a year means that some
observations have more than 100% recorded for enrolment rates.
Table 2
Descriptive Statistics
Mean Std. Dev Min Max
Observations
NT N 𝐓̅
EHII 42.10842 7.101112 20.5783 59.99571 3732 136 27.4412
GDPPC 6469.255 9427.672 49.0756 121189.6 5481 135 40.6
Hcapital 61.73231 33.83302 0.18163 162.3487 3877 134 28.9328
Inflation 36.66549 347.9358 -30.1833 13611.63 4903 129 38.0078
govdebtGDP 53.81016 59.59731 2.3 1209.3 2303 63 36.5556
Openness 7.549694 9.867625 0.47 254.58 1440 130 11.0769
NT - total observations; N – number of countries; T̅ – mean time period
29. 29
Driscoll-Kray estimators of the standard errors are used to account for cross-sectional
dependence, as the standard or cluster-adjusted standard errors are inconsistent if there is
cross-sectional dependence. This problem is more acute in panels with long time series, i.e.
over 20-30 years. Since all the variables are observed for a mean time period of more than
20 years, excluding the measure of openness, cross-sectional dependence will produce
significant bias in test results. This occurs when, for example, the GDP per capita series of
several countries are correlated with each other.
There are two main tests for cross sectional dependence; the Breusch-Pagan LM test of
independence and the Pesaran cross-sectional dependence test. However, due to the
unbalancedness of the panel, these tests cannot be reported by STATA. Ignoring possible
correlation of the regression disturbances over time and between countries can lead to
biased statistical inferences. Monte Carlo experiments reveal that ignoring spatial
correlation in panel regressions typically leads to over optimistic estimates of the standard
errors. Therefore, the standard errors are under-estimated in the presence of cross-
sectional dependence. Since tests of cross-sectional dependence cannot be undertaken, the
results in section 5 will reports fixed effects estimation with Driscoll-Kray standard errors.
The small sample properties of this estimator are better than the properties of alternative
covariance estimators when cross-sectional dependence is present (Hoechle, 2007).
Some graphs of the explanatory variables on the dependent variable are shown in Figures 1-
5 below. Some influential observations can be seen in the plots for all of the independent
variables, possibly except human capital. The line showing the fitted values show the
expected relationship for all variables.
31. 31
Figure 3
Figure 4
20406080
100
EHII
0 50 100 150 200 250
Applied, weighted tariff rate (%)
Fitted values Income inequality
2030405060
EHII
2.3 1209.3
gross central government debt/GDP (%)
Fitted values Income inequality
32. 32
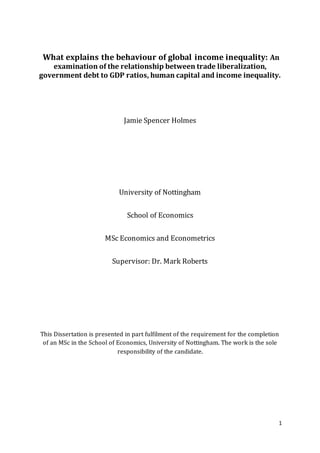
Figure 5
Figure 6 displays the behaviour of the mean of the EHII over the sample period for all
countries. It is very similar to the behaviour of the time effects from Galbraith & Kum’s
paper (2003), with a sustained, global rise in inequality from the 1980’s onwards. This
increase continues until the late 1990’s, where it trend sideways, then starts decreasing in
the 2000’s. Inequality has not fallen to the levels seen previous to 1980 and started to
increase in 2008, most likely due to the global economic slowdown that followed the
financial crisis of 2007.
2030405060
EHII
0 5000 10000 15000
inflation (GDP deflator, %)
Fitted values Income inequality
33. 33
Figure 6 - The behaviour of the mean of EHII over 1963-2008
EHII is an improved income inequality measure over the Gini index, since the Gini uses
different reference units, measures income in some places whereas in other countries it is
measured as expenditure. Some measures are net while others are gross. There is a clear
divergence of inequality measures by source. The simple mean differences between
expenditure based and income based inequality, and between household and per capita
income inequality, are significant and substantial. The distribution of sources across regions
is also notably unbalanced. So the D&S data set tries to measure income inequality, but
does so imperfectly, due to inconsistencies in the underlying measurement and other
problems. The UTIP-UNIDO statistics measure the dispersion of manufacturing pay across
industrial sectors, a narrower concept, but does so with precision. Assuming the
measurement errors in the D&S data set are random, Galbraith (2007) regresses the
manufacturing pay inequality variables, three dummy variables to represent the different
types of Gini data sources, the share of manufacturing employment to the population, share
of the population urbanized and population growth on the Gini index. Galbraith finds that
the UTIP-UNIDO is strongly associated with the Gini measure, accounting for almost 25% of
the variation in the Gini index. The residuals from the OLS regressions can help to identify
41424344
(mean)EHII
1960 1970 1980 1990 2000 2010
year
34. 34
those countries in the D&S data set where Gini coefficients may be either too high or too
low.
In an ideal situation, we would have a random sample and balanced panel of observations
so that all countries are observed for all variables and time periods. Measuring human
capital is always difficult and researchers must turn to proxies. Enrolment rates to secondary
schools can capture the skills of some workers, but is an imperfect measure of human
capital, as the quality of schooling varies from country to country. Also, some skills are not
learned at school and using school enrolment rates only measures an input not an output of
human capital. GDP per capita can also understate or overstate average income levels, as
the informal economy is not accounted for.
To capture the effect of trade liberalization and openness, a measure of tariff rates is used.
More precisely, the applied weighted mean tariff for all products is used, measured in
percentages. This is the average of effectively applied rates weighted by the product import
shares corresponding to each partner country. Tariff line data were matched to Standard
International Trade Classification (STIC) revision 3 codes to define commodity groups and
import weights.
Looking at the between- and within-variation of the independent variables2, the between
variation is higher than the within variation for three of the independent variables (GDPPC,
GDPPC2 and Hcapital). For the other three variables, the within-variation is larger. This has
an important bearing on the estimation technique used. Fixed effects may suffer from a loss
of efficiency if the independent variables have a larger between information, as the fixed
effects estimator essentially discards this information.
The fixed effects estimator will be biased and consistency will depend upon T being large.
For macro panels some researchers may still favour within estimator arguing that its bias
may not be large. The fixed effects and dynamic panel data estimators will be consistent and
asymptotically unbiased only when the underlying data is not co-integrated. In an ideal
situation, testing for unit roots in the panel data set would be done given a balanced panel
data set. The unbalancedness of the panel data used means that most unit root tests do not
produce any results. One unit root test that handles unbalanced panel data well is the Fisher
2 The within- and between-variation is shown in the appendix – Section 8.2.
35. 35
unit root test. Since all variables, excluding openness, have a significant time component,
only these variables will be tested for unit roots. The results are shown in the appendix3. For
the EHII variable, the Phillips-Perron and Dickey-Fuller based unit root test come to differing
conclusions, with the former implying at least one panel is stationary whereas the latter
implies all panels contain unit roots. For the other variables, the tests are unambiguous; a
strong failure to reject the null result is found for Hcapital, govdebt/GDP and GDPPC,
providing some empirical evidence that these series are integrated of order 1 and possibly
co-integrated with EHII. However, for inflation, all tests indicate a strong rejection of the null
hypothesis and imply that at least one of the panels is stationary at all conventional
significance levels. The lag length used is 2 since annual data is used and uncertainty with
respect to lag length is not investigated here. Individual effects models and dynamic panel
data estimators are only consistent and asymptotically unbiased when the underlying data
is not co-integrated.
With panel data there are a larger number of observations, which increases the degrees of
freedom and reduces collinearity among independent variables, improving the efficiency of
estimates consequently. The dynamics of changes and dynamic coefficients are one
advantage of panel estimation over time series or cross sectional estimation (Baltagi, 2008).
Also, reduces omitted variables bias, since individual effects are accounted for. General to
specific methodology is adopted for this same purpose and produces reliable estimates, but
panel data estimation allows the investigation of relationships without other variables
getting into the picture. Limitations of panel data are possible heterogeneity bias. Even
though panel data can cope with heterogeneity of data better than the cross-sectional or
time series data, ignoring the individual or time-specific effects that exist among cross-
sectional or time series units can still lead to parameter heterogeneity in the panel model
specification (Baltagi, 2008).
3 Unit Root Test results areshown in the Appendix – Section 8.3.
36. 36
5. Results and Analysis
5.1 Static Panel Data results
Table 3 shows the results for OLS, fixed effects (FE) and random effects (RE). The individual
effects are computed with the cluster-adjusted standard errors which are robust to
autocorrelation and heteroskedasticity. The augmented Kuznets hypothesis is strongly
supported in both individual effects specifications. The effect of growth on inequality is
stronger in the fixed and random effects models than in OLS.
Table 3
All Sample, Dependent Variable: EHII
OLS FE RE
Variable (1) (2) (3)
GDPPC
-0.0319515 -0.097013*** -0.1016578***
(0.0564948) (0.0355241) (0.0356591)
GDPPC2
-0.0018082 0.0071764*** 0.0072957***
(0.003577) (0.0022554) (0.0022628)
Constant
4.106337*** 4.030263*** 4.085416***
(0.213269) (0.1420794) (0.1387354)
R-squared 0.2451 0.1787 0.1569
Observations 3561 3561 3561
Countries 136 134 136
Rho 0.87157204 0.78614457
***- significant at 1% level
The individual effects models both indicate an ordinary U-shaped curve relationship
between income inequality and development with high significance, whereas the OLS model
has negative coefficients for both variables. The OLS estimates are likely to be biased due to
possible endogeneity in the explanatory variables. Rho represents the fraction of the
37. 37
variance of the composite error term due to the individual country-specific effects on
inequality. The FE and RE estimates are very close together. The F-test of the null hypothesis
that the variance of the individual effects equals zero gives a test statistic of 110.04 and a
corresponding p-value of 0.0000. This indicates a strong rejection of the null and provides
some evidence that individual effects models are more reliable than OLS and that OLS is
inconsistent.
The Breusch-Pagan LM test4 for random effects tests the OLS specification against the
random effects specification. The null of this test is that the variance of the individual effects
is equal to zero. The resulting test statistic is 18231.02, with the p-value being 0.0000.
Therefore, the test strongly rejects the null and fails to reject the alternative, providing
evidence that individual effects model should be used, since OLS will be biased and
inconsistent.
Using the robust version of the Hausman test5 of the null hypothesis that the random
effects specification is consistent; the Sargan-Hansen statistic is given as 52.535 with an
associated p-value of 0.0000, indicating a strong rejection of the null. This test therefore
indicates that we should prefer the fixed effects model over the random effects model.
The fixed effects model suffers from first order autocorrelation. The F-test6 indicates a
strong rejection of the null that there is no first order autocorrelation. The standard errors
of the estimates are biased since the assumption of zero serial correlation is violated, which
also means the test statistics from this model are also biased. To account for
heteroskedasticity and possible cross section dependence, we estimate with Driscoll-Kray
standard errors for more reliable inferences7, shown in Table 4. They are robust to
heteroskedasticty, autocorrelation of order q (MA(q)) and to general forms of cross-section
dependence. These standard errors have better small sample properties than commonly
used techniques for estimating standard errors in the presence of cross-sectional
dependence; this results holds regardless of whether a panel is balanced or not.
4 This is shown in the Appendix – Section 8.4.1.
5 5 This is shown in the Appendix – Section 8.4.1.
6 The resultof the autocorrelation test is shown in the Appendix – Section 8.4.1.
7 The output for this estimation is shown in the Appendix – Section 8.4.1.
38. 38
Regression (4) provides empirical support for the augmented Kuznets hypothesis as well,
with high significance and the coefficient on GDPPC is substantially larger than the
coefficient on GDPPC2. A one standard deviation increase in GDP per capita reduces the EHII
index by 4.436%.
Table 4 – Fixed effects with Driscoll-Kray standard errors
All Sample, Dependent Variable: EHII
FE with DK std. Errors
Variable (4)
GDPPC
-0.097013***
(0.0166265)
GDPPC2
0.0071764***
(0.0011143)
Constant
4.030263***
(0.0601194)
Observations 3561
Countries 134
***-denotes significance at the 1% level
Standard errors are shown in parentheses
The estimates from regression (4) are the same as in regression (2), however, the standard
errors are smaller. The information provided by the non-parametric Driscoll-Kray standard
errors is extremely robust, as non-parametric estimation discards all assumptions about
functional form and distribution. Estimation results using the fixed effects model with
Driscoll-Kray standard errors for developed and developing countries separately are shown
below in the Table 5.
39. 39
Table 5
Dependent Variable: EHII
DEVELOPED DEVELOPING
Variable (5) (6)
GDPPC
-0.397761*** -0.0150811
(0.0666673) (0.0209797)
GDPPC2
0.023838*** 0.0016205
(0.0035974) (0.0014557)
Constant
5.219752*** 3.838***
(0.3055025) (0.0734182)
Observations 1427 2134
Countries 45 89
F-statistic 136.39 2.17
p-value 0.0000 0.1262
***-denotes significance at the 1% level
Regression (5) shows that the augmented Kuznets hypothesis is strongly supported for
developed countries but not for developing countries. The coefficients are insignificant for
developing countries, but still show the expected coefficient signs for the augmented
Kuznets hypothesis. While the F-statistic and its corresponding p-value indicate at least on
the variables is statistically different form zero in regression (5), the F-statistic for regression
(6) implies that some important variables have been left out of the model.
Table 6 shows the regressions for the whole sample including year effects and the
independent variables discussed in the literature review and data overview. Regression (7)
shows that the augmented Kuznets curve is verified with high significance. Regressions (8)
and (9) also confirm this. All variables in regression (8) have the expected sign and are
significant. Regression (9) supports neither the standard or augmented Kuznets hypothesis,
but does have the expected signs for the government debt and human capital variable.
40. 40
Inflation has a negative coefficient, which would imply that higher inflation reduces
inequality, which is doubtful.
Table 6
Dependent Variable: EHII, all sample
Variable (7) (8) (9) (10)
GDPPC
-0.1347249*** -0.0995776*** -0.0942147*** 0.1285581
(0.012785) (0.0204812) (0.024803) (0.1022938)
GDPPC2
0.0047034*** 0.0022389** -0.0003526 -0.0155039***
(0.0006962) (0.0011855) (0.0014815) (0.0054491)
Hcapital(-1)
-0.0526092*** -0.0756311*** -0.2401279***
(0.0080955) (0.0118628) (0.0291465)
Inflation
0.0024576** -0.0025848* -0.0107486***
(0.0013635) (0.0017894) (0.0031496)
Govdebt/GDP
0.0177492*** 0.0080687
(0.0039369) (0.0080195)
Openness
0.0200481**
(0.0088667)
Year
dummies
YES YES YES YES
***-significance at 5% level, **-significance at 10%, *-significance at 15% level
Regression (10) supports the standard Kuznets hypothesis and all variables except inflation
have the expected sign. A 1% increase in the applied weighted tariff increase the EHII by
0.0200481%. The coefficient on human capital increases dramatically to -0.2401279,
implying a 1% increase in the schooling enrolment rate in the previous year will reduce the
estimated household income inequality by 0.24%. The coefficient on the government debt
to GDP ratio is very small and insignificant.
Parameter heterogeneity could be producing misleading results. Table 7 shows regression
(10) estimated separately for developed and developing countries. The results suggest that
inflation and openness are more important to income inequality in developed countries.
Whereas government debt to GDP and human capital are more important to inequality in
developing countries. Regression (11) shows that the Kuznets specification has strong
empirical support for developed countries, whereas the augmented Kuznets hypothesis has
41. 41
strong support for developing countries, shown in regression (12). Inflation is negative but
very close to zero for both sets of countries. The effect of human capital is much more
pronounced in developing countries, where a 1% increase in school enrolment rates reduces
the EHII index by 0.526%. Government debt has a counter-intuitive sign for developed
countries and is insignificant. Whereas, the coefficient has the expected sign and is
significant for developing countries. These results echo similar findings by Meschi & Vivarelli
(2009) that trade variables appear to have no relationship with income inequality for
developing countries.
Table 7
Dependent Variable: EHII
DEVELOPED DEVELOPING
Variable (11) (12)
GDPPC
-0.8871443***
0.7612197***
(0.1789299)
(0.3296478)
GDPPC2
-0.0447219*** 0.040356**
(0.0092811) (0.0188592)
Inflation
-0.0067439** -0.0017118
(0.0030671) (0.0068807)
Hcapital(-1)
-0.0408265 -0.5258128***
(0.0276859) (0.0575737)
govdebt/GDP
-0.0148414 0.0572725***
(0.0096547) (0.0131149)
openness
0.0178873** 0.0069821
(0.0091407) (0.0158957)
Year
Dummies
YES YES
Overall
model
significance
5.49 7.06
R-squared
0.4528 0.3734
Observations
291 170
***-significant at 5% level, **-significant at 10% level
42. 42
Table 8 shows regressions for high-income countries only, as defined by the World Bank
(GDP per capita>$12,476). Using the estimates of the coefficients on the year dummies for
regression (13) and (14), we can determine the degree that the explanatory variables
explain income inequality by comparing with the year effects from the simple Kuznets
model for high income countries8.
Table 8
Dependent Variable: EHII, High-income countries only
Variable (13) (14)
GDPPC
-0.4773205** -1.799062***
(0.2083846) (0.4545345)
GDPPC2
0.0194205* 0.0860032***
(0.0099706) (0.0228726)
Hcapital(-1)
-0.0481043
(0.1221219)
Inflation
-0.0021543
(0.0028919)
Govdebt/GDP
0.0060886
(0.0093603)
Openness
0.0012265
(0.0087687)
constant
6.318064*** 12.96192***
(1.08104) (2.260006)
Observations 673 258
Year effects YES YES
***-significant at 1%
level, **-significant at
5% level, *-significant
at 10% level
Both regressions (13) and (14) provide further evidence for the augmented Kuznets
hypothesis for high income countries. The coefficients in regression (14) are mostly
insignificant, which could be due to the reduction in the number of observations. The
8 The output of these estimations areshown in the Appendix – Section 8.4.1.
43. 43
additional explanatory variables in regression (14) all have the expected signs, apart from
inflation and openness. Figure 8 below shows the time effects of the two regressions. This
represents the changes in income inequality independent of the variables included in the
regressions and country-specific characteristics.
Figure 8 – The time effects for high-income countries, regressions (13) and (14)
The additional variables in regression (14) seem to explain a significant portion of the
increase in income inequality independent of the level or changes in GDP per capita. As
observed by Galbraith & Kum, but for high income countries only, there is a rise over time
independent of growth but independent of the additional explanatory variables in (14). This
suggests that other macroeconomic factors have contributed to the rise in income
inequality in high-income countries.
0
0.05
0.1
0.15
0.2
0.25
1989
1990
1991
1992
1993
1994
1995
1996
1997
1998
1999
2000
2001
2002
2003
2004
2005
2006
2007
2008
time effects
from (14)
time effects
from (13)
44. 44
5.2 Dynamic Panel Data results
Table 9
DEVELOPED DEVELOPING
(15) (16)
Variable
GDPPC
-0.0075128 0.0191213
(0.1646333) (0.0652959
GDPPC2
0.0006571 -0.0011985
(0.0092984) (0.0051874)
EHII(-1)
0.9235365*** 0.806169***
(0.3511713) (0.0825473)
Standard errors are in parentheses, standard errors are
obtained using bootstrap methods with 200 iterations - ***
significant at the 1% level
Table 9 shows the estimates using the LSDVC technique with the bias correction initialized
by the Anderson Hsiao estimator and using the most comprehensive and accurate
approximation of the LSDV/fixed effect bias. Since many studies suggest that the level of
development should be taken into account, developed and developing countries are
estimated separately. Only the lagged income inequality measure is significant in both
regressions. The results show that inequality is more persistent in developed countries, with
the coefficient being higher relative to developed countries. The bootstrap procedure is
suggested by Kiviet and Bun (2001) to estimate the asymptotic variance-covariance matrix
using 200 iterations. This method has the advantage that no assumption about the
normality or distribution of the disturbances is required for the inferences to be valid.
Regression (16) shows the inverse-U relationship between income inequality and GDP per
capita for developing countries, however, it is not statistically significant. Regression (15)
shows the opposite relationship for developed economies, a U-shaped relationship. The
LSDVC estimator has desirable properties for finite T and large N given homoskedastic
45. 45
disturbances and strict exogeneity of the regressors. If some of the regressors are pre-
determined then inconsistencies arising from this source are not accounted for in the bias
corrections. These inconsistencies will affect the estimators in practice. Simulation results
show that cross-sectional heteroskedasticity has hardly any affect on the coefficient
estimators, but makes the variance estimators biased. The estimated coefficient on the
lagged EHII variable for developing countries is very similar to the coefficient reported in
Meschi & Vivarelli (2008). For their regression results, the estimate ranges from 0.810-
0.890.
46. 46
5.3 Sensitivity Analysis
Table 11
Dependent Variable: EHII, top and bottom 1% of distribution excluded
Variable (17) (18)
GDPPC
-0.1041518*** 0.234287
(0.0389666) (0.2701019)
GDPPC2
0.0076078*** -0.0096908
(0.0024674) (0.0136819)
Hcapital(-1)
-0.6522025
(0.501999)
Inflation
-0.0195383***
(0.0046736)
Govdebt/GDP
0.0302026*
(0.0185847)
Openness
-0.0135424
(0.0143505)
constant
4.059965*** 3.25182***
(0.1554351) (0.9738969)
Observations 3518 411
Within R-squared 0.0666 0.1921
*** - denotes
significance at the 5%
level; ** - denotes
significance at the 10%
level; * - denotes
significance at the 15%
level
Regression (17) shows the estimates of the simple Kuznets model with influential
observations excluded. The coefficients support the augmented Kuznets hypothesis with
high significance for the 136 countries in the sample. The coefficient on GDPPC, which
implies a 1% rise in GDPPC decreases the EHII index by 0.104%, is larger than GDPPC2,
confirming the results of other studies that growth has a tendency to reduce income
inequality. However, regression (18) supports the Kuznets hypothesis. The coefficient on
human capital is still large and increases in magnitude slightly to -0.6522025. However, the
47. 47
significance of the coefficient has diminished. The coefficient on inflation is highly significant
and negative and the coefficient on government debt is significant at the 15% level and has
the expected sign. The coefficient on openness has the opposite sign to what is anticipated
and is statistically insignificant.
In general, more support is found for the augmented Kuznets hypothesis, where growth
decrease income inequality but increases it slightly at high per capita incomes. The
conclusion on hypothesis 1 is that the Kuznets relationship only seems to hold in developing
countries. The augmented Kuznets relationship is more prevalent in the developed
countries in the sample. The inferences made are conditional on the 136 countries in the
sample and this implies that increases in school enrolment at the secondary level can have
large positive effects on global income inequality. The elasticity with respect to human
capital for income inequality is found to be around -0.50 for developing economies. The
effect is not as pronounced in developed countries. So hypothesis 2 has strong support for
developing countries, but less support for developed countries. The effect of trade
liberalization on inequality has the same signs regardless of a country’s stage of
development. However, its effect appears to be stronger in developed countries. It is found
that reductions in the weighted, applied tariff rate will reduce income inequality. So for
hypothesis 3 there is partial support. Similarly, for hypothesis 4, there is only partial
support, as the coefficient is in general positive for the whole sample and developing
countries, even when accounting for influential observations. However, for developed
countries, it has a negative coefficient.
48. 48
6. Conclusion
This paper has discussed the relationships between income inequality and various
macroeconomic factors. The data issues and econometric methodology has been looked at
closely to provide reliable inferences. The effect of growth in income inequality has been
investigated and the results are robust to cross sectional dependence, heteroskedasticity
and serial correlation. The large number of countries in the sample provides reliable
inferences for the effects on global income inequality. However, one limitation is that the
estimates of the individual effects are not consistent since the number of parameters
increases as the number of countries increases (Baltagi, 2008).
The downward sloping income-inequality relationship holds, but with an upward shift over
time. The yearly effects from regression (10) shows that this upward shift over time is not
eliminated when macroeconomic variables are added to the equation for high-income
countries, implying further research is necessary in the search for the underlying
macroeconomic variables that have sustained the rise in inequality.
One strength of the analysis is that the inferences made are conditional on the particular
136 countries that are observed. The sample is very representative of the global economy,
so that the relationships between inequality and other variables are a good approximation
to the population relationships. Empirical evidence in favour of individual effects but also
the statistical significance of the yearly effects tells us two things; although national policy is
important for the determination of income inequality, the global macroeconomic conditions
are imperative.
An unbiased and consistent procedure is used to account for the persistence of inequality to
estimate the inequality-growth relationship. Using the LSDVC estimator provides more
efficient estimates. They show that developing countries seemto follow the process as
described by Kuznets, whereas developed countries show support for the augmented
Kuznets hypothesis. Bootstrapped standard errors are used to evaluate the coefficients and
have the advantage of making no assumptions about the error terms for reliable inferences.
49. 49
Developing countries that are slow to increase school enrolment may create difficulties in
reducing income inequality. Human capital has a large effect on income inequality and
suggests that there is scope for active intervention, such as targeted education and training
policies addressed at raising the supply of skilled workers. Also, the significance of the
government debt to GDP ratio for the whole sample, with and without influential
observation suggests that policy could be targeted at this measure also, aiming to reducing
the proportion of government debt to positively affect within-country income inequality.
A possible extension is to explore whether the variables used in the regressions are
cointegrated, as the panel unit root tests show that at least 3 of the series are non-
stationary. The results presented in this analysis are consistent and asymptotically unbiased
only when the underlying data is not cointegrated. The unbalanced nature of the panel did
not allow for panel unit root tests that account for cross sectional dependence, however,
the standard errors used did account for this. If further research finds the underlying data to
be cointegrated, dynamic OLS or panel VAR estimators could be used to provide consistent
estimates.
Moreover, the EHII measure of inequality is a gross measure, so the full effect of the
government debt variable on income inequality may have not been reflected in these
results. Higher debt can translate into higher taxes, as seen recently in Cyprus, where banks
performed a bail-in on depositors. Since higher taxes fall on the entire population and will
be regressive taxes on incomes or consumer products, this will increase income inequality.
Comparing the EHII index to other measures of income inequality that account for
government taxes, only for Canada, Czech Republic, Mexico, Hungary and Poland does the
EHII follow the same trend as net income inequality measures. For all other countries in the
sample (and where data is available for net income inequality measures), the EHII and net
measures diverge and follow different trends over time.
This study has attempted to avoid heterogeneity bias by estimating panel models for
developed and developing countries separately and adjusting standard errors to make
inference reliable under cross sectional dependence. One limitation is that the estimates
are assumed to be constant elasticities, when in fact the elasiticities may vary depending on
the values of the explanatory variables.
50. 50
7. Bibliography
Atkinson, Anthony B., & Brandolini, Andrea, Promise and pitfalls in the use of secondary
data set: Income Inequality in OECD countries as a case study, 2001, Journal of Economic
Literature, 39(3), pp. 771-799, available at: http://www.jstor.org/stable/2698313
[accessed: 10/07/2014]
Azzimonti, M., Quadrini, V. & Francisco, E., Financial globalization, inequality and the raising
of public debt, 2012, Federal Reserve Bank of Philadelphia Research Papers, available at:
www.philadelphiafed.org/research-anddata/publications/working-papers [accessed:
20/07/2014]
Baltagi, B., 2008, Econometric Analysis of Panel Data, John Wiley & Sons Ltd., UK
Barro, R. J., Inequality and growth in a panel of countries, 2000, Journal of Economic Growth,
5, pp. 5-32
Bleaney, M. & Nishiyama, A., 2002, Economic Growth and Income Inequality, CREDIT
research paper, No. 02/28, University of Nottingham
Bruno, Giovanni S. F., Estimation and inference in dynamic unbalanced panel-data models
with a small number of individuals, 2005, Stata Journal, 5(4), pp.473-500, Available at:
http://www.stata-journal.com/sjpdf.html?articlenum=st0091 [accessed: 29/07/2014]
Bun, Maurice J. G. & Carree, Martin A., Bias-corrected estimation in dynamic panel data
models, Journal of Business and Economic Statistics, 2005, 23(2), pp.200-210, Available at:
http://www.jstor.org/stable/pdfplus/27638812.pdf?acceptTC=true&jpdConfirm=true
[accessed:10/08/2014]
Bun, M. J. G. & Kiviet, J. F., On the diminishing returns of higher order terms in asymptotic
expansions of bias, 2003, Economic Letters, 79, pp. 145-142
Castello-Climent, Amparo, Inequality and growth in advanced economies; an empirical
investigation, 2010, Journal of Economic Inequality, 8, pp. 293-321,
http://download.springer.com/static/pdf/161/art%253A10.1007%252Fs10888-010-9133-
4.pdf?auth66=1405117260_310e7aa3a13cc9f1e7cfef6cdf0cfc72&ext=.pdf
51. 51
Deininger, K. & Squire, L, New ways of looking at old issues: Inequality and growth, 1998,
Journal of Development Economics, 57, pp. 259-287
Forbes, K. J., A Reassessment of the relationship between Inequality and Growth, 2000,
American Economic Review, 90(4), pp. 869-887
Frazer, G., Inequality and development across and within countries, 2006, World
Development, 34(9), pp. 1459-1481
Galbraith, J. K., Global inequality and global macroeconomics, 2007, Journal of Policy
Modeling, 29, pp. 587-607
Galbraith & Kum, Inequality and Economic Growth: A Global view based on measures of
pay, 2003, CESifo Economic Studies, 49(4), pp. 527-556
Galbraith, J. K. & Kum, H., Estimating the Inequality of Household Incomes: A Statistical
approach to the creation of a dense and consistent global data set, 2005, Review of Income
and Wealth, 51(1), pp. 115-143
Galor, O. & Tsiddon, D., Technological progress, mobility and economic growth, 1997,
American Economic Review, 87(3), pp. 363-382
Gourdon, J., Maystre, M., & de Melo, J., Openness, Inequality and Poverty; Endowments
matter, 2008, Journal of International Trade and Economic Development, 17, pp. 343-378
Herzer, D. & Vollmer, S., Inequality and growth: evidence from Panel cointegration, 2012,
Journal of Economic Inequality, 10, pp. 489-503
Hoechle, Daniel, Robust standard errors for panel regressions with cross sectional
dependence, 2007, Stata Journal, 7(3), pp. 281-312, available at: http://www.stata-
journal.com/sjpdf.html?articlenum=st0128 [accessed: 25/07/2014]
Hoover, Kevin D., 2005, The methodology of econometrics, In: Handbook of Econometrics
Vol.1; Theoretical Econometrics, Palgrave, New York
Huang, H-R, A flexible non-linear inference to the Kuznets hypothesis, 2004, Economics
Letters, 84(2), pp. 289-296
52. 52
Jaumotte, F., Lall, S. & Papageorgiou, C., Rising Income Inequality: Technology, or Trade and
Financial Globalization?, 2013, IMF Economic Review, 61(2), pp. 271-309
Judson & Owen, Estimating dynamic panel data models: A guide for macroeconomists,
1999, Economic Letters, 65, pp. 9-15
Kuznets, S., Economic Growth and Income Inequality, 1955, American Economic Review,
45(1), pp. 1-28
Li, H., Squire, L. & Zou, H., Explaining international and inter-temporal variations in income
inequality, 1998, The Economic Journal, 108, pp. 26-43
Lin, Huang & Weng, A semi-parametric partially linear investigation of the Kuznets
hypothesis, 2006, Journal of Comparative Economics
Meschi, E. & Vivarelli, M., Trade and Income Inequality in developing countries, 2009, World
Development, 37(2), pp. 287-302
Milanovic, Branko, Global Income Inequality: What It Is and Why It Matters?, 2006, DESA
Working Paper No. 26, Available at:
http://www.un.org/esa/desa/papers/2006/wp26_2006.pdf [accessed: 01/08/2014]
Milanovic, Branko & Squire, Lyn, Does Tariff Liberalization increase wage inequality? Some
empirical evidence, 2005, NBER Working Paper Series, Working Paper 11046, Available at:
http://www.nber.org/papers/w11046.pdf [accessed: 29/07/2014]
Osborne, E., The Sources of Growth at different stages of development, 2006, Contemporary
Economic Policy, 24(4), pp. 536-547
Personn, T. & Tabelinni, G., Is inequality harmful for growth?, 1994, American Economic
Review, 84(3), pp. 600-621
Piketty, Thomas, 2014, Capital in the 21st century, Harvard University Press, US
Ravallion, M., Growth, inequality and poverty: looking beyond averages, 2001, World
development, 29(11), pp. 1803-1815.
53. 53
Reinhart & Rogoff, Government debt to GDP ratio’s 1963-2008, 2010 available at:
http://www.reinhartandrogoff.com/data/browse-by-topic/topics/9/ , [accessed:
01/07/2014]
Salti, N., Income inequality and the composition of public debt, 2010, Politics and Economics
Conference 2011, Economics Research Forum, available at:
http://www.erf.org.eg/CMS/uploads/pdf/1300112008_Nisreen_Salti.pdf [accessed:
14/07/2014]
Solnick, Sara J. & Hemenway, David, Is more always better?: A survey on positional
concerns, 1998, Journal of Economic Behaviour & Organization, Vol. 37, pp. 373-383
UTIP, EstimatedHouseholdIncome Inequalityindex,2008, available from:
http://utip.gov.utexas.edu/data/EHII-UPDATED-10-30-2013.xlsx,[accessed:01/07/2014]
World Bank, World Development Indicators database, 2014, available from:
http://databank.worldbank.org/data/download/WDI_csv.zip, [accessed: 02/07/2014]