1. NORTHEASTERN NATURALIST2003 10(1):67–76
TELEVISION TOWER MORTALITY OF
MIGRANT BIRDS IN WESTERN NEW YORK
AND YOUNGSTOWN, OHIO
SARA R. MORRIS
1,2,3
, ARTHUR R. CLARK
2
, LAURA H. BHATTI
1
,
AND JAMIN L. GLASGOW
1
ABSTRACT - Nocturnally migrating birds often collide with man-made struc-
tures, particularly during inclement weather conditions. This study examines
television tower kill data from 1970 to 1999 in western New York and from
1974 to 1992 in Youngstown, Ohio. Television towers were visited regularly
during the fall months and any dead birds found around the tower were sal-
vaged. The number of dead birds salvaged varied annually, ranging from a
high in 1982 of 4,787 to a low of 6 in 1992 in New York and from 1,130 in
1975 to 18 in 1992 in Ohio. At both locations, the number of salvaged birds
significantly decreased during the course of the study, and this decline was
documented for each of the three television towers in New York. Several
explanations may account for the variation in the rate of mortality in recent
years, including an overall decrease in migratory bird populations, a potential
change in patterns of wind direction and cloud cover, an increase in predation
around the tower sites, and/or a change in migration patterns.
INTRODUCTION
Migration is an intrinsic behavior of birds that winter in one location
and breed in another. Migrating birds face significant survival chal-
lenges due to climatic variability, competition, predation, and habitat
loss due to human activity. Additional threats for bird survival during
migration include collisions with communications towers (Crawford
1981), lighted buildings (Bjorge 1987), and windows (Dunn 1993).
Most passerines are nocturnal migrants. Collisions with towers, support
wires, and lighted buildings are a frequent source of mortality for these
migrants. Another source of mortality results from the apparent attrac-
tion of many birds toward light. Television and radio towers with red
beacons, white strobe lights, and floodlights have a tendency to attract
nocturnal migrants, although there is some evidence that towers with
white strobe lights attract fewer migrants (Baldwin 1965, Gauthreaux
2000). Birds may fly toward the light, become disoriented, and collide
with the tower itself or the wires stabilizing the tower.
1
Biology Department, Canisius College, Buffalo, New York, 14208. 2
The
Buffalo Museum of Science, Buffalo, New York, 14211. 3
Corresponding author
- morriss@canisius.edu.
2. Northeastern Naturalist Vol. 10, No. 168
Man-made structures are responsible for numerous avian deaths, and
thus may be decreasing migratory bird populations substantially. Re-
cently, many communities have experienced an increase in the number
of towers for cellular phones to support this growing market. The
increase in towers and associated support wires may result in an increase
in the number of birds killed each year by man-made towers. The extent
of this problem has yet to be determined. There have been relatively few
published long-term tower-kill studies (but see Crawford and Engstrom
2001 and Kemper 1996).
The goal of this study was to investigate annual variation in the
number of birds killed at towers. Using data collected in western New
York and in Ohio, we compared the number of birds salvaged from
television towers over three decades in an effort to document the poten-
tial problem of towers on migratory bird populations.
METHODS
Birds were salvaged during the fall months from 1970 to 1999 at
three television towers (WKBW, WGRZ, and WIVB) in southern Erie
County, NY. See Table 1 for additional information about the location
and size of the towers in this study. In 1971 visits were made on a daily
basis (29 August to 1 November). In all other years of the study, visits
were made only after nights with overcast conditions, which were more
likely to result in mortality than clear nights (Table 2). Generally, visits
spanned from the end of August until the beginning of November.
Specimens salvaged at these towers were transported to the Buffalo
Museum of Science, where they were identified to species, when pos-
sible; tabulated; and frozen for future use. Occasionally identification
only occurred to group (e.g., thrush or sparrow).
The three New York television towers in this study had paved
driveways and small parking lots, medium-sized transmitter build-
ings, and grass lawns immediately surrounding the facilities, which
were lower-cut than surrounding areas. Upon arrival at the towers,
ARC or trained volunteers would first check the paved areas for
birds. Grassy areas were then checked by walking in loops (ranging
out to approximately 50 m at WGRZ and 60 m at WKBW) through
the lower-cut grass lawns and by walking straight lines under the guy
cables to about 65 m from the base of the tower and returning about 2
m south of the set of cables. Additionally, loops out into taller grass
to approximately 30 m from the tower were made in the two south-
erly facing angles of the guy cables. Every attempt was made to use
the same pattern at each visit to the towers. At the tower that had an
associated building with an angled roof, the roof of the transmitter
3. S.R. Morris, et al.2003 69
building was checked for birds with binoculars. If the procedure out-
lined above resulted in finding any specimens, additional searching
occurred. The observers would walk a series of parallel paths a few
feet apart on the lower-cut grass lawns. Walking similar patterns in
the taller grass may have required making the parallel paths closer
together. These paths were extended well beyond the last specimen
Table 1. Description of towers where birds were salvaged.
Tower Ground Tower Antenna Number of Lighting Total
Location Elevation Height Height Support Birds
At Base (ft) (ft)1
(ft) Wires Retrieved
WGRZ 2
Wales, NY 1352 855 106 15 red beacon 8,011
WKBW Colden, NY 1735 1000 76 18 red beacon 11,092
WIVB 3
Colden, NY 1640 947 112 6 red beacon 1,043
WFMJ Youngstown, OH 1033 958 126 9 red beacon 4,310 4
1
Tower height excludes the antenna. For total height, tower height and antenna height need to be added
together.
2
formerly WGR
3
formerly WBEN
4
We only have data for 19 years from the Ohio tower
Table 2. Number of nights towers were visited annually in New York.
Year Number of visits Number of dates on which birds were collected
1970 N/A * 19
1971 67 33
1972 N/A * 9
1973 N/A * 11
1974 N/A * 16
1975 N/A * 12
1976 19 16
1977 23 14
1978 27 12
1979 27 21
1980 31 13
1981 13 6
1982 23 20
1983 21 7
1984 16 12
1985 20 11
1986 19 9
1987 13 5
1988 10 4
1989 12 5
1990 16 10
1991 13 5
1992 11 5
1993 8 5
1994 12 6
1995 10 7
1996 12 9
1997 12 7
1998 15 8
1999 23 12
* Number of days visited without finding birds was not recorded in the early 1970s.
4. Northeastern Naturalist Vol. 10, No. 170
collected and several additional paths farther afield were also walked.
The number of search days varied per year (Table 2).
Volunteers also salvaged migrants beneath the WFMJ-TV tower
in Youngstown, OH, from 1974 to 1992. First searchers walked in
several rings around the tower to determine the wind direction and,
therefore, the pattern of distribution of birds beneath the tower. Each
field was walked in a back-and-forth pattern with approximately 2 m
lines (all depending on the visibility and how recently the grass had
been mowed). When there was substantial kill, searchers also com-
pleted a pattern of searching perpendicular to the original search
pattern. The number of search days each year was variable depending
on the persons working and the number of weather systems producing
kills. Initially, Bill Bartolo checked the tower almost every day from
late August until the search became unproductive in October. In sub-
sequent years, when searchers had an idea of the patterns, searchers
were able to get help from the tower staff, who contacted searchers
when they spotted birds on the driveway as they came to work in the
dark. In the later years, the tower was checked when the tower staff
called, after storm systems passed, on foggy nights, and every week-
Table 3. Comparison of the composition of birds salvaged between the two sites.
Family New York Ohio
Species Individuals (%) Species Individuals (%)
Podicipedidae 1 3 (0.01)
Ardeidae 3 6 (0.03)
Rallidae 5 25 (0.12) 1 1 (0.02)
Scolopacidae 2 2 (0.01)
Columbidae 1 2 (0.01) 1 2 (0.05)
Cuculidae 2 15 (0.07)
Strigidae 1 2 (0.01)
Caprimulgidae 1 1 (0.00) 1 1 (0.02)
Alcedinidae 1 1 (0.00)
Picidae 2 53 (0.26) 2 10 (0.23)
Tyrannidae 7 125 (0.62) 5 10 (0.23)
Vireonidae 5 1,692 (8.40) 6 725 (16.82)
Sittidae 1 26 (0.13) 1 7 (0.16)
Certhiidae 1 102 (0.51) 1 16 (0.37)
Troglodytidae 4 102 (0.51) 2 8 (0.19)
Regulidae 2 1,008 (5.00) 2 303 (7.03)
Turdidae 7 2,837 (14.08) 6 148 (3.43)
Mimidae 2 229 (1.14) 1 134 (3.11)
Sturnidae 1 8 (0.04)
Bombycillidae 1 3 (0.01) 1 1 (0.02)
Parulidae 32 12,825 (63.65) 30 2,670 (61.95)
Thraupidae 1 79 (0.39) 1 6 (0.14)
Emberizidae 14 520 (2.58) 11 80 (1.86)
Cardinalidae 3 286 (1.42) 3 168 (3.90)
Icteridae 4 40 (0.20) 3 12 (0.28)
Fringillidae 2 3 (0.01) 1 6 (0.14)
Passeridae 1 2 (0.05)
Unknown 153 (0.76)
5. S.R. Morris, et al.2003 71
end regardless, as a control sample. Specimens retrieved from this
tower were transported to the Carnegie Museum of Natural History in
Pittsburgh, PA, for identification.
All analyses were performed in SYSTAT 9. To investigate changes
in the number of birds salvaged over time, we performed a regression of
the number of birds salvaged by year. Prior to regression analysis, data
were log transformed (after adding 1 to the number of birds collected) to
meet the assumptions of normality. Reported regression equations are
based on the log transformed data. P-values reflect sequential
Bonferroni correction for multiple tests.
RESULTS
Between 1970 and 1999, there were 20,148 birds representing
106 species from 26 families that were retrieved from the WKBW,
WGRZ, and WIVB television towers in western New York (Tables 2
Table 4. Comparison of the number of birds collected at each location between 1970 and
1999.
Year New York Ohio
WGRZ WKBW WIVB Total
1970 1826 240 101 2167
1971 852 434 194 1480
1972 174 9 26 209
1973 156 71 3 230
1974 236 830 52 1118 270
1975 1066 1312 93 2471 1130
1976 304 170 13 487 258
1977 388 1026 34 1448 336
1978 209 171 2 382 418
1979 178 346 16 542* 303
1980 331 984 135 1450 190
1981 116 117 16 249 64
1982 1189 3305 293 4787 327
1983 97 37 7 141 106
1984 120 174 3 297 337
1985 173 251 4 428 37
1986 63 130 18 211 94
1987 1 46 0 47 20
1988 115 298 8 421 74
1989 73 393 5 471 102
1990 83 140 11 234 58
1991 19 10 0 29 168
1992 5 1 0 6 18
1993 75 24 3 102
1994 24 74 1 99
1995 20 6 0 26
1996 35 427 3 465
1997 26 13 0 39
1998 12 2 0 14
1999 45 51 2 98
* in 1979, two birds were collected in New York that were not attributed to any specific tower.
6. Northeastern Naturalist Vol. 10, No. 172
and 3). Wood warblers (Family Paulidae) accounted for more than
60% of the individuals salvaged (Table 3). The number of birds
retrieved varied annually, with a high in 1982 of 4,787 to a low of 6
in 1992 (Fig. 1, Table 4). A regression of the number of birds sal-
vaged by year confirmed a significant decline over time (F1,28 =
25.8, p < 0.001, r2
= 0.48). Furthermore, significant declines were
noted at each of the three individual towers (WGRZ: F1,28 = 35.8, p
< 0.001, r2
= 0.56; WKBW: F1,28 = 9.6, p < 0.01, r2
= 0.26; WIVB:
F1,28 = 31.1 p < 0.001, r2
= 0.53). Although the same protocol was
followed each year since 1972, the number of days visited and the
number of days on which birds were collected significantly de-
creased over time (visits: F1,22 = 13.7, p < 0.01; collections:
F1,28 = 16.9, p < 0.001; Table 2).
In Youngstown, Ohio, 4,310 individuals representing 80 species
from 20 families were retrieved between 1974 and 1992 (Tables 2
and 3). Similar to the New York results, parulids accounted for more
than 60% of the individuals salvaged in Ohio (Table 3). Variations
among years ranged from 1,130 birds salvaged in 1975 to 18 in 1992
(Table 4). A similar pattern of decreasing bird retrievals was ob-
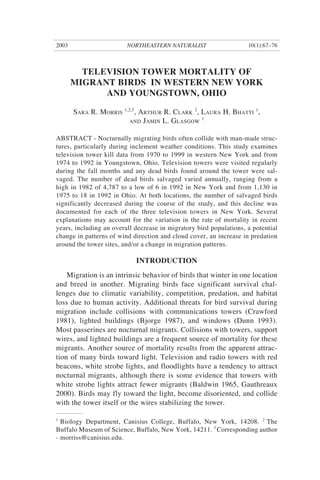
served between 1974 and 1992 at this location (Fig. 2, Table 4). A
regression of the number of birds salvaged in Ohio by year also
indicated a significant decrease over time (F1,17 = 19.1, p < 0.001,
r2
= 0.53; Fig. 2).
Figure 1. Total number of birds retrieved annually at television towers in
Western New York from 1970 through 1999. The regression equation using the
log of the number of birds collected was y = -0.05x + 109.0.
7. S.R. Morris, et al.2003 73
DISCUSSION
The data from this study indicate that there was variation in the
number of fall migrants killed annually by television towers. In par-
ticular, we documented a substantial decrease in the number of birds
salvaged from collisions with television towers in two locations dur-
ing the last thirty years. The significant decline in salvaged birds
suggests that there has been a decline in the numbers of birds that
collide with the towers during this period. The reason for this decline
in collisions could be attributed to a number of different causes.
Goodpasture (1984) suggests that a decrease in the number of birds
salvaged at tower-kills may be due to a general decline in bird popu-
lations, a change in the timing and duration of wind direction and
cloud or fog cover, or an increase in nocturnal predation below tow-
ers resulting in a decrease in the percentage of killed birds salvaged.
Crawford and Engstrom (2001) indicate that predators and scaven-
gers may be a substantial problem in studies of mortality by televi-
sion towers. Other factors that may also contribute to a decrease in
the number of birds salvaged include a change in migration patterns,
an increase in light pollution to the north of, or in the vicinity of the
towers, or even an evolutionary decrease in the attraction of tower
lights to birds. The similar timing of the decrease in birds collected in
New York and in Ohio suggest that the factors affecting changes in
migrant mortality are likely to be large-scale factors, such as weather
Figure 2. Total number of birds retrieved annually at a television tower in
Youngstown, Ohio, from 1974 through 1992. The regression equation using the
log of the number of birds collected was y = -0.06x + 121.5.
8. Northeastern Naturalist Vol. 10, No. 174
patterns and population size, rather than local factors such as in-
creases in number of predators and scavengers. The number of days
on which towers were visited and the number of days on which birds
were collected significantly decreased in New York during the study
period, which also suggests a decrease in the number of cloudy nights
during this study.
Many factors, including weather conditions and the overall popula-
tion of nocturnal migrants, affect the collision rate on any given night.
Low, dense clouds appear to limit many nocturnal migrants and sand-
wich them between the overcast and ground (Avery et al. 1977, Clark
1973), thus increasing the number of migrants colliding with man-made
objects. If cloudy conditions occur on nights with high rates of migra-
tion, mortality at television towers should be high. Weather conditions
that are associated with high rates of migration in the fall are the passage
of cold fronts and tailwinds. Thus, if overcast or foggy conditions occur
after the passage of a cold front, or with north winds, collision rates with
towers would be expected to be high.
Another explanation for the overall decrease in bird mortality at
towers may be a decrease in the number of foggy nights or fog density,
although we do not have data on either of these parameters during this
study. Dense fog may cause the tower lights to reflect, forming an
illuminated space, and this illuminated space may initiate diurnal navi-
gational modes in birds (Kane 1999). Furthermore, when the cloud
ceiling is low, birds lose their stellar cues for nocturnal navigation
(Kane 1999), which may reduce the amount of migration on these
nights. Because clouds and fog appear to increase the number of mi-
grants colliding with towers (Clark 1973, Crawford 1981), a decrease in
foggy or cloudy nights could be responsible for the observed decrease in
the number of birds salvaged.
There is much support for the proposal that populations of Neotropi-
cal migrants are declining (e.g., Askins et al. 1990, Hussell et al. 1992).
Collisions with television towers and their support wires may have
contributed to an overall decline in songbird populations. Estimates of
tower-kill mortalities indicate that two to five million birds are killed
annually (Kemper 1996, Lavendal 1999). Numerous studies have dem-
onstrated that tower kill data is useful for understanding migration
patterns, population changes, and impacts of human activities on bird
populations (Goodpasture 1984, Kemper 1996, Sealy 1986). Future
studies may potentially elucidate ways in which humans can alleviate
the toll of communications towers on migrating birds.
9. S.R. Morris, et al.2003 75
ACKNOWLEDGEMENTS
Although unable to list them individually, we would like to thank the many
people who assisted over the years; they include the friends and fellow birders
who helped in the retrieval of bird specimens; the WKBW, WGRZ, and WIVB
television broadcasting companies for allowing access to their transmitter sites;
and various transmitter personnel for access to the sites, including fenced-in
areas and roofs, along with occasional notifications of bird kills. We greatly
appreciate the use of the WFMJ-TV tower data of birds that were salvaged by
W. A. Bartolo, Randy Jones, and a variety of other volunteers, in conjunction
with the Section of Birds of the Carnegie Museum of Natural History, Pitts-
burgh, PA. John Grdic and Gary Shade graciously provided the physical at-
tributes of the WFMJ-TV tower. This research was generously supported by the
Buffalo Museum of Science (support of ARC) and Canisius College (support for
SRM). Canisius College also provided funding for the analysis in the form of
Canisius Earning Excellence Program grants to LHB and JLG and an Howard
Hughes Medical Institute fellowship to LHB. This manuscript was improved by
the constructive comments of Mary Clemens Clark, Robert J. Morris, and two
anonymous reviewers.
LITERATURE CITED
Askins, R.A., J.F. Lynch, and R. Greenberg. 1990. Population declines in
migratory birds in Eastern North America. Pp. 1–57, In D.M. Power
(Ed.). Current Ornithology, Volume 7. Plenum Press, New York, NY.
370 pp.
Avery, M., P.F. Springer, and J.F. Cassel. 1977. Weather influences on noc-
turnal bird mortality at a North Dakota Tower. Wilson Bulletin 89:291–
299.
Baldwin, D.H. 1965. Enquiry into the mass mortality of nocturnal migrants in
Ontario, Final Report. Ontario Naturalist 3:3–11.
Bjorge, R.R. 1987. Bird kill at an oil industry flare stack in northwest Alberta.
Canadian Field Naturalist 101:346–350.
Clark, A.R. 1973. Avian Mortality at Three Western New York Television
Towers. Master’s Thesis, Buffalo State College, Buffalo, NY.
Crawford, R.L. 1981. Weather, migration and autumn bird kills at a north
Florida TV tower. Wilson Bulletin 93:189–195.
Crawford, R.L., and R.T. Engstrom. 2001. Characteristics of avian mortality at
a North Florida television tower: A 29-year study. Journal of Field Ornithol-
ogy 72:380–388.
Dunn, E.H. 1993. Bird mortality from striking residential windows in winter.
Journal of Field Ornithology 64:302–309.
Gauthreaux, S.A. 2000. The behavioral responses of migrating birds to different
lighting systems on tall towers. Transcripts of Proceedings of the Workshop
on Avian Mortality at Communication Towers, August 11, 1999, Cornell
University, Ithaca, NY.
Goodpasture, K.A. 1984. Television Tower Casualties, Nashville, Tennessee
1976–1983. The Migrant 55(3):53–57.
10. Northeastern Naturalist Vol. 10, No. 176
Hussell, D.J.T., M.H. Mather, and P.H. Sinclair. 1992. Trends in numbers of
tropical- and temperate-wintering migrant landbirds in migration at Long
Point, Ontario, 1961–1988. Pp. 101–114, In J.M. Hagan III and D.W.
Johnston (Eds.). Ecology and Conservation of Neotropical Migrant
Landbirds. Smithsonian Institution Press, Washington, DC. 609 pp.
Kane, R. 1999. Birds and Tower Kills. New Jersey Audubon 24(4):26–27.
Kemper, C. 1996. A study of bird mortality at a west central Wisconsin TV
tower from 1957–1995. Passenger Pigeon 58:219–235.
Lavendal, B. 1999. Menace in the Sky. Animals 132:12–15.
Sealy, S.G. 1986. Fall migration of Northern Orioles: an analysis of tower-
killed individuals. North American Bird Bander 11:43–45.