LCA Methodology Development and Framework for Marine PV Systems
1. Life cycle assessment (LCA) – from analysing methodology
development to introducing an LCA framework for marine
photovoltaic (PV) systems
J. Ling-Chin n
, O. Heidrich, A.P. Roskilly
Sir Joseph Swan Centre for Energy Research, Newcastle University, Newcastle upon Tyne NE1 7RU, UK
a r t i c l e i n f o
Article history:
Received 8 December 2014
Received in revised form
5 November 2015
Accepted 15 December 2015
Keywords:
Life cycle assessment
Methodology development
LCA framework
Marine PV systems
ISO 14040
ISO 14044
a b s t r a c t
Previously, life cycle assessment (LCA) focussing on principles or applications has been considerably
reviewed. Still, an up-to-date review on LCA methodology development (rather than application) in a
chronological order which embraces all life-cycle phases is lacking. The objectives of this article include
scrutinising methodology development of conventional LCA phase by phase, providing clarification on
goal and scope definition and life cycle inventory (LCI) analysis, discussing recent substantial develop-
ment on life cycle impact assessment (LCIA) methodology and interpretation, and introducing an LCA
framework for marine photovoltaic (PV) systems. For the study presented here, literature on LCA
methodology development was categorised into Sample Groups A, B and C, comprising 15 review articles
published in the last decade, 95 pieces of other literature types (with 83% journal articles), and 38
additional materials necessary for complementing an in-depth discussion respectively. A threefold
analysis was performed to scrutinise and compare the literature in these sample groups. The analysis
shows that for Sample Group A, the focus has steered from overarching LCA of all-embracing life cycle
phases to single phase and then sole engagement with a specific topic; and for Sample Group B, 44% has
reported the scientific endeavour on LCIA compared to other life cycle phases. Following clarification on
system boundary, cut-off and existing LCI approaches including attributional, consequential, process
based, input–output (IO) based etc., the methodology development of impact categories (covering
impacts of water use, noise and working environment), uncertainty and sensitivity analyses are dis-
cussed. In addition, classification involving series and parallel mechanisms, LCIA development for space
use, odour, non-ionising radiation and thermal pollution, rebound effects, renewability of resources,
dynamic of environment and future scenario modelling in LCA context are identified as research needs
and areas for future development. In compliance with ISO Standards and based on the findings, an LCA
framework for marine PV systems (which exemplify the state-of-the-art development of renewable and
sustainable energy in marine industry) is introduced to enhance the practical applicability and usefulness
of the findings to LCA researchers.
& 2015 The Authors. Published by Elsevier Ltd. This is an open access article under the CC BY license
(http://creativecommons.org/licenses/by/4.0/).
Contents
1. Introduction . . . . . . . . . . . . . . . . . . . . . . . . . . . . . . . . . . . . . . . . . . . . . . . . . . . . . . . . . . . . . . . . . . . . . . . . . . . . . . . . . . . . . . . . . . . . . . . . . . . . . . . . 353
2. Focus and methodology . . . . . . . . . . . . . . . . . . . . . . . . . . . . . . . . . . . . . . . . . . . . . . . . . . . . . . . . . . . . . . . . . . . . . . . . . . . . . . . . . . . . . . . . . . . . . . 354
3. Findings of literature analysis – the current research trend . . . . . . . . . . . . . . . . . . . . . . . . . . . . . . . . . . . . . . . . . . . . . . . . . . . . . . . . . . . . . . . . . . 354
3.1. Analysis of review articles (Sample Group A) . . . . . . . . . . . . . . . . . . . . . . . . . . . . . . . . . . . . . . . . . . . . . . . . . . . . . . . . . . . . . . . . . . . . . . . 354
3.2. Analysis of other literature types (Sample Group B) . . . . . . . . . . . . . . . . . . . . . . . . . . . . . . . . . . . . . . . . . . . . . . . . . . . . . . . . . . . . . . . . . . 355
4. Discussion on LCA methodology development . . . . . . . . . . . . . . . . . . . . . . . . . . . . . . . . . . . . . . . . . . . . . . . . . . . . . . . . . . . . . . . . . . . . . . . . . . . . 356
4.1. Goal and scope definition – ISO requirements, cut-off and system boundary . . . . . . . . . . . . . . . . . . . . . . . . . . . . . . . . . . . . . . . . . . . . . . 357
4.2. LCI . . . . . . . . . . . . . . . . . . . . . . . . . . . . . . . . . . . . . . . . . . . . . . . . . . . . . . . . . . . . . . . . . . . . . . . . . . . . . . . . . . . . . . . . . . . . . . . . . . . . . . . . . 358
Contents lists available at ScienceDirect
journal homepage: www.elsevier.com/locate/rser
Renewable and Sustainable Energy Reviews
http://dx.doi.org/10.1016/j.rser.2015.12.058
1364-0321/& 2015 The Authors. Published by Elsevier Ltd. This is an open access article under the CC BY license (http://creativecommons.org/licenses/by/4.0/).
n
Corresponding author. Tel.: þ44 191 208 4945; fax: þ44 191 208 6920.
E-mail address: j.l.chin@ncl.ac.uk (J. Ling-Chin).
Renewable and Sustainable Energy Reviews 59 (2016) 352–378
2. 4.2.1. Attributional and consequential approaches – clarification on what processes to include . . . . . . . . . . . . . . . . . . . . . . . . . . . . . 358
4.2.2. LCI approaches – clarification on what data sources and principles to use for quantity computation . . . . . . . . . . . . . . . . . . . . 359
4.3. LCIA – recent methodological development. . . . . . . . . . . . . . . . . . . . . . . . . . . . . . . . . . . . . . . . . . . . . . . . . . . . . . . . . . . . . . . . . . . . . . . . . 360
4.3.1. The impact of water use . . . . . . . . . . . . . . . . . . . . . . . . . . . . . . . . . . . . . . . . . . . . . . . . . . . . . . . . . . . . . . . . . . . . . . . . . . . . . . . . . 360
4.3.2. The impact of noise . . . . . . . . . . . . . . . . . . . . . . . . . . . . . . . . . . . . . . . . . . . . . . . . . . . . . . . . . . . . . . . . . . . . . . . . . . . . . . . . . . . . . 361
4.3.3. The impact of working environment/impact related to work environment . . . . . . . . . . . . . . . . . . . . . . . . . . . . . . . . . . . . . . . . . 366
4.4. Interpretation – uncertainty and sensitivity analyses . . . . . . . . . . . . . . . . . . . . . . . . . . . . . . . . . . . . . . . . . . . . . . . . . . . . . . . . . . . . . . . . . 367
4.5. Research needs and areas for future development . . . . . . . . . . . . . . . . . . . . . . . . . . . . . . . . . . . . . . . . . . . . . . . . . . . . . . . . . . . . . . . . . . . 371
5. An LCA framework for marine PV systems. . . . . . . . . . . . . . . . . . . . . . . . . . . . . . . . . . . . . . . . . . . . . . . . . . . . . . . . . . . . . . . . . . . . . . . . . . . . . . . . 372
5.1. Goal and scope definition . . . . . . . . . . . . . . . . . . . . . . . . . . . . . . . . . . . . . . . . . . . . . . . . . . . . . . . . . . . . . . . . . . . . . . . . . . . . . . . . . . . . . . . 373
5.2. LCI analysis . . . . . . . . . . . . . . . . . . . . . . . . . . . . . . . . . . . . . . . . . . . . . . . . . . . . . . . . . . . . . . . . . . . . . . . . . . . . . . . . . . . . . . . . . . . . . . . . . . 374
5.3. LCIA . . . . . . . . . . . . . . . . . . . . . . . . . . . . . . . . . . . . . . . . . . . . . . . . . . . . . . . . . . . . . . . . . . . . . . . . . . . . . . . . . . . . . . . . . . . . . . . . . . . . . . . . 375
5.4. Life cycle interpretation. . . . . . . . . . . . . . . . . . . . . . . . . . . . . . . . . . . . . . . . . . . . . . . . . . . . . . . . . . . . . . . . . . . . . . . . . . . . . . . . . . . . . . . . . 375
6. Conclusions . . . . . . . . . . . . . . . . . . . . . . . . . . . . . . . . . . . . . . . . . . . . . . . . . . . . . . . . . . . . . . . . . . . . . . . . . . . . . . . . . . . . . . . . . . . . . . . . . . . . . . . . 375
Acknowledgement. . . . . . . . . . . . . . . . . . . . . . . . . . . . . . . . . . . . . . . . . . . . . . . . . . . . . . . . . . . . . . . . . . . . . . . . . . . . . . . . . . . . . . . . . . . . . . . . . . . . . . . 375
Appendix A. Supplementary material. . . . . . . . . . . . . . . . . . . . . . . . . . . . . . . . . . . . . . . . . . . . . . . . . . . . . . . . . . . . . . . . . . . . . . . . . . . . . . . . . . . . . 375
References . . . . . . . . . . . . . . . . . . . . . . . . . . . . . . . . . . . . . . . . . . . . . . . . . . . . . . . . . . . . . . . . . . . . . . . . . . . . . . . . . . . . . . . . . . . . . . . . . . . . . . . . . . . . . 375
1. Introduction
Previously referred to as ‘cradle-to-grave assessment’ i.e. from
acquiring raw materials, manufacturing and using to returning
back to the earth, life cycle assessment (LCA) has been practised
since the early 1970s to assess the environmental impact of a
product, either goods or service, throughout its life cycle [1].
Aiming to introduce a universal technique which could be widely
used to address the potential environmental impacts associated
with a product, the International Organisation for Standardisation
(ISO) introduced the principles, framework and basic requirements
of handling each LCA phase in 1997 [2]. This was extended in the
late 90s and beyond for the four LCA phases, including goal and
scope definition and life cycle inventory (LCI) analysis [3], life cycle
impact assessment (LCIA) [4] and interpretation [5], which were
then revised and replaced by two shorter but more succinct
documents, ISO 14040 and ISO 14044 [6,7]. An elaboration of the
historical development of the Standards can be seen in [8,9], in
addition to a summary of changes reported by [10].
The following conclusion made by [9] deserves further
investigation:
…critiques of the ISO 14040 series has markedly dropped off since
its redrafting and consolidation in 2006. Indeed, some recom-
mendations are merely repetitions of similar arguments made
previously or remain unsuitable…
The nonexistence of persistent critique, even if it was the case,
does not necessarily indicate acceptance or satisfaction. A possible
explanation is that neither new ideas nor solutions have been
proposed while the research community has become tired of the
persistent problems. Indeed, some issues associated with the ISO
14040 series have been reported by [11–14] after the revision,
including its overly flexible nature, the absence of step-by-step
guidelines, the unequal level of detail, the legitimacy of the results
as well as the lack of consistency and quality assurance, to name
but a few. If recommendations are repeated, do they not imply a
possibility of unresolved issues? Also, it is unclear which recom-
mendations are ‘unsuitable’ in this context as no elaboration has
been provided. If the claim (that the critiques have dropped off
after revision) holds true – which it does not – it will be intriguing
to find out if LCA, which is the focus of the Standards, has also
become mature and free of critiques too.
A number and variety of LCA reviews have been published,
either focussing on principles, challenges and opportunities
[8,12,15–26] or covering LCA applications for materials [27,28],
buildings and construction [29–34], food [35], transport [36,37],
energy sources (such as bioenergy [38–45], solar [46–49], wind
[50–53] and geothermal [54]) and electricity generation [55–57].
This does not repudiate but intensify the need of this article
because an up-to-date analysis on LCA methodology development
(rather than application) embracing all life-cycle phases is still
lacking while it is intriguing to find out if LCA has become mature.
To date, no one has ever attempted to review existing review
articles. Also, integrating concepts/approaches proposed for a
particular topic and clearly showing research development trend
in a chronological order are missing. Therefore, this article aims to
provide an up-to-date analysis on LCA methodology development
covering 4 life-cycle phases. The following objectives are set:
scrutinise LCA methodology development phase by phase to
compare and integrate the proposed concepts or approaches;
clarify goal and scope definition and LCI analysis;
discuss LCIA methodologies for impact categories that have
recently shown substantial development;
detail methodology development with respect to life cycle
interpretation; and
introduce an LCA framework for marine PV systems based on
the analysis.
The focus of this article lies on methodology development of
conventional LCA embracing the four life cycle phases. In this article,
a threefold analysis was developed (Section 2) as opposed to a
commonly used one-off approach, followed by a presentation of
analysis outcome (Section 3). From the analysis, areas are identified
for discussion. Section 4 clarifies additional dimensions proposed for
cut-off and system boundary selection in relation to goal and scope
definition. Clarification on LCI is also provided to cover (i) the choice
of attributional and consequential approaches dependent on what
processes to include; and (ii) the integration and comparison of
process based, fuzzy matrix based, input–output (IO) based, tiered
hybrid, IO based hybrid and integrated hybrid approaches in accor-
dance with data sources and fundamental principles. Methodology
development of the identified impact categories (namely the impacts
of water use, noise and working environment) with respect to LCIA
as well as uncertainty and sensitivity analyses for life cycle inter-
pretation are discussed extensively. Based on the analysis, research
needs are highlighted. To enhance the practical applicability and
usefulness of the findings to LCA researchers, an LCA framework for
marine photovoltaic (PV) systems is introduced in Section 5 prior to
drawing conclusions in Section 6. PV systems are chosen as they
exemplify the state-of-the-art development of renewable and sus-
tainable energy in marine industry. This article demonstrates that
J. Ling-Chin et al. / Renewable and Sustainable Energy Reviews 59 (2016) 352–378 353
3. literature analysis can be applied in a comparative, interesting and
practical way. It is believed that the new threefold analysis presented
in this article can enhance the research quality of a wider research
community as well as stimulate the understanding and practice of
the readers focussing on LCA studies in marine industry.
2. Focus and methodology
In the form of a mind map, Fig. 1 illustrates not only the LCA
phases – the core of the LCA framework as recommended by ISO
14040 [6], extending to the associated components and/or ele-
ments – but also the focus of this article (recognition, clarification
or extensive discussion respectively presented in an off-white,
grey or dark grey box). Other types of LCA study based on exergy,
emergy, embodied energy or sustainability concept (see [33,58–
61]) have been emerging. Although interesting, neither ISO 14040
nor ISO 14044 has included any of these concepts. Therefore, they
are excluded from the analysis presented here, which will direct
attention towards conventional LCA only.
Literature on LCA methodology development available on Scien-
ceDirect and Google Scholar was identified for the analysis presented
in this article. To uncover research trends shown by review articles
and other literature types, including research articles, technical
reports, guidelines, conference papers etc., a threefold analysis
(instead of a one-off approach) was developed in 3 stages. In the first
stage, 15 review articles published in the last decade (inclusive) were
categorised into Sample Group A and analysed to determine their
literature coverage in terms of topics and level of detail. In the second
stage, 95 pieces of other literature types on conventional LCA study
(with 83% journal publications) were selected to form Sample Group
B and analysed to reveal the research trend. Upon completion of this
stage, topics requiring clarification or recently being substantially
developed were determined. In the third stage, literature in Sample
Groups A and B was checked – additional literature materials, 38 in
total which were necessary for complementing an in-depth discus-
sion, were categorised into Sample Group C and analysed. Sample
Group C was deliberately not added to Sample Group B to avoid any
bias in the research trend. Separate disclosure and a comparison of
the topics being covered by both review and other literature types
were made possible through this threefold analysis to determine if
they are in agreement. Based on the findings, research needs in the
area of LCA are identified, followed by an LCA framework proposed
for marine PV systems in compliance with ISO Standards.
3. Findings of literature analysis – the current research trend
3.1. Analysis of review articles (Sample Group A)
The outcome of analysing 15 review articles [8,9,12,15–26] is
summarised in Table 1 where a scale of I–VI is adopted to describe
Fig. 1. A mind map illustrating LCA phases, elements and components in accordance with ISO 14040 and the focus of this article.
J. Ling-Chin et al. / Renewable and Sustainable Energy Reviews 59 (2016) 352–378354
4. the level of discussion (from I which is for recognition to VI which
is for extensive and integrated discussion). It was found that the
articles have shown a research trend in accordance with life cycle
phases. With the identification of research needs and challenges
[8,25], the focus has steered from an overarching LCA concept of
all-embracing life cycle phases [15,16,18–20], and then single
phase of LCI [17] and that of LCIA [12] to sole engagement with a
specific topic, e.g. consequential LCI [21], weighting [23], ISO
Standards [9] and recently under-developing impact categories
[22,24,26]. In relation to LCIA methodology development, the
scope has become more specific in a similar manner, shifting from
a wide range of common impact categories [15] and character-
isation models [12] to a coverage of a few underdeveloped impact
categories [20], followed by concentration on individual impact
categories [22,24,26].
Among all, [20] presents the most comprehensive coverage,
although transparency, documentation, temporal differentiation
and sensitivity analysis are barely recognised while ISO standards,
double counting, cut-off, serial and parallel mechanisms and
dynamic of environment have been missed out. Conversely, [17,22]
show the most limited scope with an emphasis on LCI and LCIA
respectively. While data availability, source or database and
uncertainty are most frequently recognised, characterisation and
its methodology are most intensively discussed. A continuous
coverage has been observed for most topics with the exception of
process-based and hybrid LCI approaches, selection of impact
categories, characterisation models and factors, and dynamic of
environment, which have been exclusively unattended to since
2010. Meanwhile, some topics which are briefly mentioned in ISO
14040 and/or ISO 14044 are not at all or sporadically discussed e.g.
serial and/or parallel mechanisms, recycling, future scenario
modelling and grouping; other topics which are not included in
ISO standards have been brought up e.g. rebound effect, renew-
ability of resources, dynamic of the environment and consensus
building or harmonisation. In addition, some topics, e.g. trans-
parency and consensus building or harmonisation, are broadly
recognised but not intensively discussed. Altogether, these find-
ings reveal potential topics for further investigation.
3.2. Analysis of other literature types (Sample Group B)
In addition to ISO standards, overview, comparison and con-
sensus building, those 95 pieces of other literature types in Sample
Group B [1,6,7,10,62–152] are organised into 23 topics (representing
the main focus of each) in accordance with life cycle phases from
goal and scope definition to interpretation, as illustrated in Fig. 2.
The country of the institution with which the leading contributor is
affiliated and the year of publication are both disclosed. The main
focus, publication type, objective and highlights are summarised in
Tables S1–S6 of the Supplementary material. For literature which
covers 2–3 main focuses, they are included under the relevant
tables. A slightly different approach is adopted for those presenting
Table 1
Topics presented in review articles (Sample Group A) and the level of discussion.
J. Ling-Chin et al. / Renewable and Sustainable Energy Reviews 59 (2016) 352–378 355
5. an overview – instead of breaking down into subtopics, they are
categorised under the umbrella of ‘overview’. Among all, 10 pieces
of literature are published before 2000; 12 between 2000 and 2004
and the rest follow afterwards. Irrespective of literature presenting
an overview, the majority have devoted to one main focus where
approximately 16% covered 2–3 main focuses.
In brief, there are a number of interesting points to note:
Netherlands, US and Switzerland, are the top 3 countries produ-
cing approximately half of the literature in this sample group. In
contrary, LCA appears to be a comparatively new research topic in
Asia where only 1 publication is from China, Japan, Philippine and
Singapore each. Taking all into account, overview is the most
common focus, followed by LCI approaches and LCIA methodology
development for characterisation factors. The least attended sub-
topic in this part is not identified as those providing an overview
are not broken down into subtopics. Research advance on LCI has
been expanding gradually where new ideas such as water cate-
gorisation, consideration of capital goods, dealing with traffic
noise, handling double-counting in tiered hybrid approach, and
the use of fuzzy numbers, physical Input–Output Tables (IOT) and
non-local data for LCI development are reported. Among all life
cycle phases, the scientific endeavour on LCIA is relatively more
prominent in which 44% of literature have respectively reported
the development of framework, impact categories, indicators,
characterisation factors, characterisation models and methods,
classification, spatial and temporal dimensions, normalisation and
weighting. The development of some characterisation models i.e.
ReCiPe, IMPACT 2002þ, TRACI, USES-LCA, USEtox and USES-LCA
are reported, which is crucial not only to guarantee transparency
but also to enable full understanding and appropriate practice
among the users. Examples of recently addressed indicators and
impact categories included soil quality, land as a resource, traffic
noise, impact of work environment, impact of water use (fresh-
water ecotoxicity) and impact of resource scarcity. Research on
some subtopics, such as sensitivity and uncertainty analyses,
normalisation and weighting for LCA studies are slowly but stea-
dily developed particularly in recent years. In relation to rebound
effect, consensus building, serial and parallel mechanisms relevant
to classification, recycling, future scenario modelling and grouping,
the findings are in agreement with that of Sample Group A.
4. Discussion on LCA methodology development
From the results, one can interpret that methodology develop-
ment of each LCA phase is not evenly balanced. From goal and scope
definition to life cycle interpretation, there is an increase in com-
plexity which comes along with diminishment in methodological
advance. As the most straight-forward phase, goal and scope defi-
nition has received criticism to the minimal extent compared with
the other LCA phases. Methodology for LCI has been more estab-
lished than LCIA and life cycle interpretation. Extensive discussion
on goal and scope definition as well as LCI is therefore not the focus
of this article but only a few points requiring clarification to
enhance the understanding of existing LCA knowledge. In relation
to LCIA, attention is given on the methodology development of
impact categories being substantially developed recently, includ-
ing the impacts of water use, noise and working environment.
Table 1 (continued )
J. Ling-Chin et al. / Renewable and Sustainable Energy Reviews 59 (2016) 352–378356
6. Other impact categories are not discussed in this article not only
because of the word constraints, more importantly, they are either
hitherto more developed (e.g. climate change, ozone depletion,
particulate matter formation, acidification, photochemical oxidant
formation, human toxicity, ecotoxicity and resource depletion) or
have not been substantially investigated (e.g. space use, odour, light,
non-ionising radiation and thermal pollution). Regardless of how
important and interesting normalisation, grouping and weighting
(i.e. the optional LCIA elements) are, they are excluded from dis-
cussion due to the same reasons. In respect of life cycle inter-
pretation, uncertainty analysis is extensively covered in line with its
steady development in recent years, together with a discussion on
sensitivity analysis for potential methodology development in the
context of LCA due to its increasingly important role.
4.1. Goal and scope definition – ISO requirements, cut-off and system
boundary
Goal and scope definition is of unquestionable importance as
the primary phase of an LCA study. In defining the goal of an LCA
study, it is required to clearly report the reason(s) for carrying out
the study, the intended application and audience, the intention to
use the results in comparative assertions and to disclose them to
the public [6,7] (see Fig. 1). With respect to scope definition, it is
required to clearly detail the study, including the product system
to be studied, function, functional unit, reference flow, system
boundary, allocation, assumptions, requirements on data and its
quality, impact categories, LCIA methodologies, value choice,
optional elements, limitations, interpretation, use of critical review
and report requirements. In principle, deciding which stages (gate-
to-gate, cradle-to-gate or cradle-to-grave), processes and ele-
mentary flows to include in an LCA study is known as system
boundary definition where mass, energy and environmental rele-
vance have been established by [6,7] as the cut-off criteria used to
exclude any insignificant inputs, outputs or unit processes from a
study. As summarised in Table 2, these topics have been broadly
covered from recognition, discussion to application. As it is unli-
kely to know in advance which data is insignificant and can be
excluded, additional dimensions have been distinguished by
[18,20,62–64,68], as shown in Fig. 3. Particularly for boundary
selection between different systems, a few methods have been
reported as follows:
Fig. 2. The distribution of literature materials in Sample Group B.
J. Ling-Chin et al. / Renewable and Sustainable Energy Reviews 59 (2016) 352–378 357
7. Define the contents of the system either by process tree system
[64], technological or social-economic whole system [62] – the
process tree system only considers processes and transports
which are directly involved in the life cycle of the system under
study; the technological whole system accounts everything
affected by the choice between comparative systems except
economic and social forces which are included by the socio-
economic whole system.
Consider only the ‘main’ life-cycle stream – this method does
not allow boundaries to be repeatedly selected, nor does the
selection of similar boundaries for different systems [63].
Set a percentage of the total mass, generally 5–10%, of unit
processes in the system under study as the cut-off ratio to
eliminate any input below the ratio – this method does not
consider the impact of an input on its system from an entire life
cycle perspective.
Include only inputs which are readily available – this method can
result in a false sense of completeness and bias analysis [63].
Use alternative cut-off criteria by taking weight, energy, toxicity
and price into accounts in defining the contribution of an input
to the system as negligible, small or large issues regarding
unrepeatable boundaries remain unsolved [63].
Consider the relative contribution of mass, energy and eco-
nomics to the functional unit which allows similar boundaries
to be selected for different analyses – any non-energy-non-
combustion related air emission is beyond the scope of this
method [17,63].
It is important to point out that selecting appropriate system
boundaries generally requires a large amount of data which results
in additional cost and time [18]. Due to its considerable impact on
“the depth and the breath of LCA” [6,7], goal and scope definition
(including system boundary and cut-off) is a decisive factor to
determine the credibility of LCA results. Without due care, any
omission or flaw at this fundamental phase will result in an
absolute divergence due to a sort of snowball effect, leading to
misinterpretation and inappropriate decision.
4.2. LCI
4.2.1. Attributional and consequential approaches – clarification on
what processes to include
Without much detail, ISO 14040 [6] has added the following
remark in its annex:
Two possible different approaches to LCA have developed during
the recent years. These are
(a) One which assigns elementary flows and potential environmental
impacts to a specific product system typically as an account of the
history of the product, and
(b) One which studies the environmental consequences of possible
(future) changes between alternative product systems.
A few terminologies have been adopted for these approaches:
the former is referred to as attributional (most common),
descriptive, accounting or retrospective LCA while the latter is
known as consequential (most common), prospective, change-
oriented, decision- or market-based LCA [11,20,72]. Similar to goal
and scope definition, attributional and consequential LCA have
also been broadly studied, from recognition [18,24,64,81,144] to
brief [80,141,143] and noticeable discussions [16,20,21,67,70–
72,138,139]. The core subjects of discussion in this regard are
presented as the following:
Table 2
Literature coverage on goal and scope definition, system boundary and cut-off.
Topic Coverage level
Goal and
scope
definition
I [8–10,12,17,23,65,68,69,72,73,95,97,100–
102,109,110,113,118,126,131,132,140,146]
II [15,19,25,64,75,79,96,128]
III [6,7,16,18,20,70,134,135,137–139,143]
IV [98,149]
System
boundary
I [24,68,79,80,82,83,89,98,111,113,124,126,140,141,144,146]
II [9,10,12,21,22,25,74,75,78,110]
III [1,6,7,16–20,62–64,70–73,129,134–139]
IV [94,121]
Cut-off I [9,16,19,21,76,81,82,104,132,139]
II [6,68,134,140]
III [7,17,18,63,64,70]
I Recognition where the topic is brought up once or twice.
II Brief discussion where the topic is mentioned 3–5 times, discussed slightly
without much detail.
III Noticeable discussion where the discussion of the topic is either in a dedicated
section or integrated with other topics throughout the literature.
IV Case study.
Fig. 3. Additional dimensions for cut-off and system boundary selection.
J. Ling-Chin et al. / Renewable and Sustainable Energy Reviews 59 (2016) 352–378358
8. (i) The use of average or marginal data. A distinction is presented
in accordance with attributional and consequential approa-
ches, see [16,21,70,71,137]: attributional LCA uses average data
(which are measured, historic or fact-based) to account for
inputs and outputs that are directly involved in production,
consumption and disposal of the product system under study
at a specific time and particular production level which deliver
a certain amount of functional unit without considering
market and non-market effects in which the inputs and out-
puts are generally allocated based on mass, energy content or
economic value. In contrast, consequential LCA uses marginal
data (which involves a generic supply–demand chain built
upon a decision) to account for all inputs and outputs that
significantly, directly and indirectly affected by a change in the
production of the product system due to the substitution or
use of constrained resources etc. by taking into account both
market and non-market effects (e.g. policies and impact of
research and development) in which allocation is avoided via
system expansion.
(ii) Deciding between attributional and consequential approaches.
According to [72], the choice can be made by answering some
questions, as listed in the following:
How is system boundary of the study defined?
What are the processes to be included?
What are the causal chains to be used?
How are questions framed to identify the exact problem to be
tackled?
What are the derived questions?
What are the technological options?
What is the scale of the expected change(s)?
What is the time frame of the question?
Can a ceteris paribus assumption be held?
Is the system under study replacing another system on a
small scale?
Is the technology used in the new system expected to extend
to other applications on a larger scale?
Considering the equivocal and wearisome nature of this
method which indeed presents an evident shortcoming, one
may alternatively consider a three-question provisional
scheme proposed by [138] as illustrated in Fig. 4. However, it
is important to point out that, as according to [138], the
scheme is immature and a further in-depth testing is required
as it is merely the first step towards building a consensus
among LCA community. In this matter, [20,21,139] report that
no consensus has been reached among LCA community on the
appropriateness of one approach compared to the other,
relevance of the knowledge generated by both approaches
and their practicability.
(iii) Whether to combine attributional and consequential approa-
ches – while [72] notes that consequential LCA has always
been inconsistently performed and misinterpreted as ‘the
state-of-the-art methodology’, [71] strongly claims that both
approaches must stand alone where a combination is not
allowed. Dissimilar recommendations are given by [16,20,72],
leading to a confusing situation. An emphasis shall be made on
the fact that both approaches serve different purposes, as
implied by [6] (as mentioned earlier). To reiterate, attribu-
tional LCA aims to identify environmental burdens throughout
the life cycle of a product system while consequential LCA
estimates the change in environmental burdens incurred by a
decision made in line with a marginal change in the produc-
tion of that system. A clear-cut solution is therefore incon-
trovertible to the question of whether to combine attributional
and consequential approaches if one refers to this very
fundamental concept in practice based on the reason(s) of
carrying out the LCA study. Such a simple but decisive
approach is appropriate from a pragmatic point of view in
line with the purpose of LCI (i.e. to collect and quantify data).
As clearly pointed out by [72], the difference between both
approaches is the type of processes to be taken into account
(i.e. attributional approach considers processes which signifi-
cantly contribute to environmental burdens; consequential
approach accounts for processes which are affected by deci-
sions) while their (LCIA) modelling principles remain
unchanged. In addition, both approaches can be applied one
after the other separately if an LCA study aims to serve more
than one purpose, for example to compare the environmental
impacts of a product system with an alternative system before
and after implementing some technical improvements.
4.2.2. LCI approaches – clarification on what data sources and
principles to use for quantity computation
The purpose of developing LCI is to calculate the quantities of
inputs and outputs involved in delivering a specific functional unit
of the product system under study [16], which typically produces
a list of substances with identified quantity as the outcome.
Based on data sources and fundamental principles used for com-
putation involved in LCI compilation, a number of methods have
Fig. 4. The 3-question scheme provisionally used for choosing between attributional and consequential LCA, as proposed by [138].
J. Ling-Chin et al. / Renewable and Sustainable Energy Reviews 59 (2016) 352–378 359
9. been developed including process (using process flow diagram
and matrix), fuzzy matrix, IO, tiered hybrid, IO based hybrid and
integrated hybrid approaches. These methods have been respec-
tively recognised [63,79,92,121,129,141,143,144], briefly [81] or
noticeably discussed [16–18,20,64,67,70,74–85,134,135,137–139]
or applied [78,82,133]. Fig. 5 presents an overall idea how these
methods can be integrated among one another in line with fun-
damental principles, data sources and life cycle phases from
energy and material acquisition to the end of life. [75] compares
these methods (except fuzzy matrix-based approach) in terms of
data requirements, uncertainty of data source, system boundaries,
software tools and requirements of computation tool, simplicity,
and the intensity of time and labour. Based on [16–18,20,64,73–
82,85,133,137–139], Table 3 briefly describes the methods and
extends the comparison to cover strengths and limitations of each
method. The use of structural path analysis in hybrid LCA [74],
although interesting, is excluded from this comparison because
the analysis does not compile LCI but rather preliminarily identify
the most important input paths. Along with the criteria proposed
by [16,75] such as goal and scope, requirements on accuracy and
level of completeness, time, budget and data availability, the
strengths and limitations of each approach shall also be taken into
consideration in choosing an LCI method in practice.
4.3. LCIA – recent methodological development
4.3.1. The impact of water use
Water has been considered as an abiotic resource since the
early stages of LCA development. Somehow, the perspective has
evolved to recognise water as an impact category due to its use
and depletion. [12,15,19,20,24,26,87,95,142] are the articles in
Sample Groups A and B which, at different levels of detail, consider
water use as an impact category. In brief, [12,15,19,26] do not give
much focus while [20] leaves out some important development. As
a review focussing on freshwater use at LCI and LCIA levels, which
presents a number of existing approaches, [24] is fully dedicated to
the topic at the expense of other LCA elements. Research articles
are limited to [87,95] and a case study is reported by [142].
The investigation reveals that additional resources, i.e. [153–
161] (in which some are respectively built based on [162–170]) are
necessary to present a more comprehensive scope, as illustrated in
Fig. 6. Definitions of some terms, e.g. water source, flow, use,
return and depletion, have been partially proposed by [87,153–
155,157,158] and these have been integrated for water classifica-
tions as illustrated in Fig. 7. The general comments made by
[12,15,19,20,24,26,87,95,142] and the methodological concept of
the approach reported by [153–161] are briefly summarised in
Table S7 of the Supplementary material. A few additional points
are worth noting:
In respect of water quality, 3 proposals are reported, respec-
tively based on un-usable to excellent quality levels [87],
distinction approach (i.e. distance-to-target method or water
functionality) [157] and quality indicators [153]. As complexity
increases from quality level, distinction approach to quality
indicators, the incorporation of any quality indicator proposed
by [153] into impact assessment methodology has not yet been
achieved, except thermal factor being assessed by [159].
Although approaches recommended by [155,156,170] have been
applied by [142] in a case study to assess the impacts of water
use, [142] does not point out that the indicator results from
these approaches are not in agreement. Despite dissimilar result
patterns and magnitude orders (as evidenced by the results
reported by [142]), existing methods have not received any
Fig. 5. Outline of existing LCI approaches in line with fundamental principles, data sources and life cycle phases.
J. Ling-Chin et al. / Renewable and Sustainable Energy Reviews 59 (2016) 352–378360
10. criticism – which is uncommon compared to the cases of other
impact categories (e.g. acidification, eutrophication and eco-
toxicity) generally assessed by different LCIA methods e.g. CML,
ReCiPe, ILCD etc.. What is more, it remains a challenge to decide
which concept to apply among existing methods.
Although not elaborated here, research developed for other
relevant subject areas (but not directly within LCA context), e.g.
virtual water by [162,166], surplus energy concept by [168],
water indices as recognised by [24] (e.g. water resource per
capita, basic water needs, withdrawal- and consumption-to-
availability, water poverty and groundwater sensitivity indices)
and those for natural resources in LCA context, e.g. eco-factors
applied in ecological scarcity by [170] and exergy by [169], have
been or can be applied for LCA methodological development.
Refer the supporting information presented by [24] to see the
findings of scientific comparison among existing methods,
covering completeness, robustness, relevance to environment,
transparency, documentation and reproducibility, applicability
and stakeholder acceptance.
Data regarding quality requirements, use, availability, demand,
vulnerability, scarcity, conflict, poverty index and future of
water, if available, probably will be useful for developing and
performing LCIA for this impact category.
Research is required to further develop LCIA methods which can
fully address water quality, temporal and spatial factors – a
challenge to the LCA community.
4.3.2. The impact of noise
From cradle to grave, the life cycle of a product system involves
an extensive number of processes. As pointed out by [134], “a
process produces a certain amount of noise”. The impact of noise
in LCA context has been conveyed in literature over the past
Table 3
Brief description, strengths and limitations of LCI approaches.
Approach Brief description Strengths Limitations
Process flow diagram approach
[17,20,64,73–75,80,82,133]
Apply bottom-up process analysis based
on process and product balance models
Inventory is calculated with algebra;
when required, infinite geometric pro-
gression can be applied to simplify the
calculation
Case-specific and more accurate
Most common form of LCI approach
Time-consuming and expensive to collect
empirical data or from other sources
Underestimation and truncation error
occur when capital goods and upstream
processes are cut off
Calculation can be complicated when the
system involves multi-functionality or
interconnecting inputs between processes
Subject to use outdated data
Matrix based approach (simplified
model) [17,76,80]
Similar to process flow diagram approach
where simultaneous equations are cre-
ated based on bottom-up process analysis
using product balance or process balance.
The equations are then solved by matrix
Powerful
Able to solve endless regression
problems associated with system
and support advanced analyses,
such as connections with IOT
Restrict to single-output processes
Not clear if process balance can deal with
multi-functionality issue
The number of processes to be included is
still limited and capital goods are gen-
erally excluded
Fuzzy matrix based approach [79,81] Fuzzy number is integrated into matrix-
based LCI at different possibility levels
Derive material composition matrix based
on resources, materials and products; and
make use of data from IOT
Data uncertainty due to vagueness
can be modelled at different
possibility levels
Computational time is considerably
short compared to Monte-Carlo model
Cannot model correlated uncertainties
Determining fuzzy distributions of the
inputs is complicated
Limit to inverse-positive matrices only
IO based approach [16–18,20,73,
80,137,139]
Matrixes are formed based on top-down
monetary transactions among industry
sectors as published in IOT, which are
national data on the supply and con-
sumption of goods and services
Easier to perform.
Eliminate the need to estimate data
for each process
Take account of capital goods
Transparent because only publicly
available data and standard calcu-
lations are used
Resolution is too coarse for detailed stu-
dies involving raw material selection,
process redesign and any comparison at
regional or international levels
Data are old, inconsistent (due to com-
pilation variation) and with high aggre-
gation level, leading to aggregation error
Cannot provide LCIs for the use and end
of life stages
Cannot correctly reflect the environ-
mental burdens as process data are not
used for modelling
Tiered hybrid approach
[17,20,73,75,77,78,85,138]
Direct inputs to main processes are cal-
culated with detailed process analysis
while upstream flows that are indirectly
connected to the main processes are
estimated via IO based approach
Combine the strengths of process
and IO based approaches
LCI compilation is quick
Capital goods are included
Results are more comprehensive
Suffer from double-counting unless
material flow analysis is incorporated
Process and IO based approaches cannot
be assessed together systematically
IO based hybrid approach [17,75,78] Also known as hybrid LCI method based
on IO data
To improve process specificity, IO data on
industry sectors are disaggregated and
solved by tiered hybrid approach; process
based approach is applied for main pro-
cesses during use and end of life phrase
Consistent
Higher resolution for detailed
applications
Avoid double-counting
Issues with process data and IOT remain
the same
Difficult to model the relationship
between life cycle phases of a product
Integrated hybrid analysis
[17,75,138,139]
Detailed information at unit process level
is fully incorporated into IO model by
linking process-based system (repre-
sented in a technology matrix by physical
units) and the IO system (in monetary
units) through flows crossing the border
of both systems
Process and IO based approaches are
integrated consistently into one matrix
Double-counting is avoided as
tiered hybrid approach is not
applied
Consistent and complete for upstream
processes
Interactions between processes and
industries are fully modelled
Complex
Time-consuming
Require intensive data
J. Ling-Chin et al. / Renewable and Sustainable Energy Reviews 59 (2016) 352–378 361
11. 2 decades, and possibly earlier, from simply recognising it
[15,16,20,90,101,102,109,128] and commenting on its standing
[12,19,25,101,104,131,144,151] to briefly discussing it [92,134,139]
and fully developing a methodology for its impact assessment
[86,89,93,120,171–176] (where [171–176] are literature included in
Sample Group C to complement the discussion), as illustrated in
Fig. 8. It is apparent that methodologies to assess the impact of
noise have been rapidly developed [144] and become available
[25]; still, it is neither included in LCI database [92] nor applied in
most LCA studies [104,151]. By the means of additional tools (e.g.
noise emission models, national databases, surveys, questionnaires
and experiments), various concepts covering physics (e.g. sound
energy), mathematics (fuzzy numbers/intervals and variation in
noise level), social science (e.g. disturbance, nuisance and health
damage), demographics (e.g. population density) etc. have been
selectively applied in developing these methodologies. The con-
cept of each methodology is summarised as follows and a com-
parison is presented in Table 4.
(1) Sound energy concept [134] which is also referred to as CML
guide [176] – the method claims that noise is linearly
generated with the process of manufacturing a product
system. Therefore, noise production (in the square of sound
pressure second, Pa2
s) can be determined by taking account of
sound energy (in Pa2
, derived from sound pressure level in
decibel, dB) and the duration in which noise is generated,
together with hearing threshold and the quantity of required
materials or products produced in a year.
(2) Disturbance and equivalent traffic concept [171], also referred
to as Ecobilan method [176] – the method determines the
noise thresholds for day- and night-time in accordance with
legislation and measures disturbance which is expressed as
the total number of people disturbed. Data on population
density, existing mapping and noise propagation model (based
on equivalent traffic concept which assumes that the potential
noise impact of the traffic mode under study and that of a
reference mode on the environment are the same) are used to
measure the disturbance as per specific transport means.
Fig. 6. LCIA research development in relation to the impact of water use.
J. Ling-Chin et al. / Renewable and Sustainable Energy Reviews 59 (2016) 352–378362
12. (3) Environmental scarcity factors or Swiss FEDRO method [176],
also referred to as Doka methodology [175] – although
[175,176] both claim that the method is adapted from the
earlier work of Muller–Wenk (which is inaccessible), a variant
of methodological concepts has been reported. According to
[176], the Swiss FEDRO method determines the environmental
scarcity factors by defining actual and critical flows based on
people who are highly annoyed by the noise emission. The
former is the number of highly annoyed people (derived from
Swiss EPA method and the effect curves from Swiss survey)
while the latter is set as 20% of Swiss population. According to
[175], Doka claims that non-linear relationship exists between
noise emission and its effects on human health; and therefore,
to calculate the damage caused by noise emission in disability-
adjusted life year (DALY) per vehicle-kilometre, noise emission
that is measured in dB can be substituted into a simplified
formula which incorporates regression parameters.
(4) Total nuisance caused by a specific process, also known as
Nielsen and Laursen methodology [175] or Danish LCA guide
[176] – in this method, information such as background noise
and noise level (both in dB; the former is set via interviews
and the latter is simulation results from noise emission and
propagation models), process duration and the number of
people (based on average population density) exposed to the
noise produced in a process (in which transport is selected for
the study) are required to determine the total noise nuisance
caused by the process (in person-second).
(5) Fate-exposure-effect-damage model [172], also known as Swiss
EPA [176] or Muller–Wenk methodology [175] – the method
involves the following analyses via different approaches:
Fate analysis – by taking account of vehicle types, speeds and
gradient of a road and the use of the existing noise emission
model i.e. SAEFL, the average noise level per year, Leq and the
increase in noise level, ΔLeq resulting from increased vehicle
numbers per year are determined.
Exposure analysis – number of people exposed to the increased
noise level can be extrapolated from the figures estimated by
Kanton’s road noise emission model.
Effect analysis – relationship between communication dis-
turbance at day-time (or sleep disturbance at night-time) and the
noise level is determined based on the outcome of social surveys.
Damage analysis – disability weight (DW) for communication
and sleeping disturbances (which are determined based on
responses collected from 41 physicians via questionnaire) are
used to determine the health damage due to traffic noise, in
DALY per 1000 vehicle-kilometre.
(6) Fuzzy-set approach [173] – after defining the quality of the
sound environment i.e. types of land use (urban, residential or
rural), population densities and noise level intervals in the
form of fuzzy numbers, the overall noise level of a process can
be calculated, which is necessary for the (dimensionless)
impact assessment of noise based on nuisance felt by the
population under study. In addition, the fuzzy-set approach
can be incorporated with semantic distance concept to per-
form pairwise comparison upon the LCIA results of different
impact categories across a range of scenarios, as demonstrated
by [174] in assessing electricity generation processes.
(7) New framework to extend Swiss EPA method to specific
vehicles, tires and situations [86] – the method is built on the
Fig. 7. Water classification as sources, elementary flows, use and return.
J. Ling-Chin et al. / Renewable and Sustainable Energy Reviews 59 (2016) 352–378 363
13. earlier work of Muller–Wenk to calculate the additional noise
level resulted from an increased number of vehicles, where
vehicle and tire types (using a noise emission model, i.e.
SonRoad and TUV measurements respectively) as well as time
and space are distinguished. The approach also takes into
account population densities and differentiates road classes
based on noise effects upon the population.
(8) Self-reported annoyance [93] – the method uses existing noise
emission model i.e. IMAGINE to model traffic flows at 2 situa-
tions so that the variation in noise level (known as noise-
relevant life cycle variations, NRLVs) can be determined. The
number of highly annoyed persons is estimated by applying
polynomial approximation to the dose-response functions.
Based on the increased percentage of annoyance due to NRLVs,
the impact can be estimated as the product of difference in the
percentage of annoyance and the total number of people
exposed to noise.
(9) Fate-effect model [89] – after pointing out the common
deficiency of previous methodologies (i.e. fail to focus on the
process that producing noise emissions rather than the situa-
tion in which noise takes place), [89] proposes a new meth-
odology which defines the characterisation factors for noise
impact category in LCA context as the product of fate and
effect factors measured in person-Pascal per Watt. Fate factor,
Fig. 8. Literature development on the impact of noise.
J. Ling-Chin et al. / Renewable and Sustainable Energy Reviews 59 (2016) 352–378364
14. Table 4
Comparison of existing methodologies for the impact of noise.
Concept (unit) Source of noise Spatial
differentiation
Temporal
differentiation
Use of specific parameter,
tool or approach
Type of data required for
calculation
Strengths Limitations
Sound energy concept (the
square of Pascal) [134]
Process [134] No [176] No [176] (although
‘the time during
which noise is gen-
erated is relevant’
[134])
Threshold of hearing Quantity required to meet
the functional unit and
annual production [134]
Comply with ISO 14040 and is
applicable to all situations
[176]; simple and straight-for-
ward calculation
Only consider the aggregation
of sound at midpoint level
[12]; less useful and not sui-
table for comparison [176]
Disturbance and equivalent
traffic concept (Number-of-
people-hour/passenger-
kilometre or number-of-
people-hour/goods-kilo-
metre) [171]
All transport modes or
production plant [171]
Yes [176] Yes [176] Noise thresholds for day
and night time; experi-
ments to determine
equivalent traffic coeffi-
cients [171]
Areas affected by noise above
thresholds; distance of the
source of noise from the
ground and the presence of
any obstacle between the
source and the observer [171]
The results may be used as
models to assess traffic noise
in European countries with
similar population density
along the road under study
[171]
Do not comply with ISO 14040
and the indicator is very rough
[176]; cannot differentiate the
sources of noise in the
assessment as all are treated
as 1 single source
Environmental scarcity factors
[176] (DALY/vehicle-kilo-
metre) [175]
Road traffic [176] Yes [176] Yes [176] Regression parameters dif-
ferentiated by the time of
journey, i.e. day or night
[175]
Noise measured in decibel
[175]
Quite practical [175]; allow for
intermodal comparison; com-
ply with ISO 14040 [176]
Only address traffic noise
Total nuisance caused by a
specific process (person-
second) [175]
Process when goods are
being transported [175]
Yes [176] No [176] Background noise relative
to 20 μPa [175]
Number of persons and noise
level within/at a distance
from the source; duration
and noise level [175]
Simple [175]; allow for inter-
modal comparison [176]
Do not comply with ISO
14040; not suitable for inclu-
sion in LCI databases, and
overestimate the noise effects
[176]
Fate-exposure-effect-damage
model (DALY/1000-vehicle-
kilometre) [172]
Traffic [176] Yes [176] Yes [176] Noise emission model for
fate analysis; computer
model for exposure analy-
sis; survey for effect ana-
lysis, and questionnaire for
damage analysis [172]
Traffic (i.e. average number of
vehicles per type, speed and
road gradient etc.) and
demographics (i.e. popula-
tion being exposed to the
noise) [172]
Applicable to different coun-
tries [175]; comply with ISO
14040 and comparison to
other impacts measured in
DALY can be made easily [176]
The noise emission model is
obsolete [175]; may over-
estimate noise effects [176];
inaccurate due to simplifica-
tions; only address traffic
noise
Fuzzy sets approach (dimen-
sionless) [173]
Any process (unit pro-
cess and traffic noise are
referred for conceptual
discussion; example is
given on coal mining
and combustion pro-
cesses) [173]
Yes No Noise level range, fuzzy
numbers and intervals
Quality of site, (i.e. existing
noise level; types of land use
—rural, urban and residen-
tial; population density);
nuisance felt by individuals
and time exposed to the
noise [173]
Uncertainty is accounted for
by the fuzzy numbers [174];
can be applied to any process
Sophisticated and require
expert judgement for deter-
mining variables of the
assessment [173]
Guidelines for incorporating
the effects of noise into LCA
(DALY) [175]
Road traffic [175] No No Model to stimulate virtual
network of roads and
vehicle fleet (e.g. IMA-
GINE); survey [175]
Noise maps, demographics
data [175]
Potential reference for metho-
dology development in the
future
Methodology has not been
developed for the impact
assessment; limited focus on
traffic noise
Requirements for methods
used to incorporate noise
into LCA [176]
Traffic [176] Yes Yes – – Potential reference for metho-
dology development
Methodology is not developed
for the impact assessment;
limited focus on traffic noise
New framework to extend
Swiss EPA method (dB(A))
[86]
Traffic [86] Yes Yes Vehicle-specific noise
emission models (i.e. Son-
Road and TUV) and cor-
rection factors [86]
Measurements of real traffic
situations [86]
The results can be imple-
mented in LCI databases for
other LCA study [86]
Noise from mixed sources is
not considered yet [86]; lim-
ited focus on traffic noise
Self-reported annoyance
(number of annoyed per-
sons) [93]
Traffic [93] Yes Yes Traffic noise emission
model (i.e. IMAGINE),
health damage model, and
incremental approach (to
determine noise relevant
life cycle variations, NRLVs)
[93]
Traffic data (e.g. vehicle
speed and flow etc.) and
receiver data (e.g. demo-
graphics, frequency distribu-
tion of noise exposure, and
background noise) [93]
Results are more accurate due
to the state-of-the-art noise
emission model; more intelli-
gible for decision making [93]
Require intensive data, is lim-
ited to variation assessment
where environmental impact
of noise is not assessed [93]
Fate-effect model (person-
Pascal/Watt) [89]
Processes [89] Yes Yes Scale of sound frequencies
(i.e. octave bands); sound
power (in Watts); sound
Sound emission, weighting
factors and number of people
Noise effects are related to
functional unit and the meth-
odology focusses on the
Despite the proposed metho-
dology, characterisation fac-
tors are not presented and
J.Ling-Chinetal./RenewableandSustainableEnergyReviews59(2016)352–378365
15. in Pascal per Watt, is determined at the background level as
the small increase of sound pressure due to a marginal change
of sound power at a compartment where directivity and
attenuation (in line with a frequency scale defined by 8 octave
bands) are taken into account. Similarly, effect factor, mea-
sured in person, is defined as the small increase in person-
pressure due to a marginal change in sound pressure of an
octave band at a compartment based on the number of people
living in that compartment, the day-night weighting and the
A-scale weighting (for the octave band). [120] complements
the fate-effect model by not only presenting characterisation
factors but also distinguishing the fate model for noise impact
upon the internal occupational and external environments.
4.3.3. The impact of working environment/impact related to work
environment
The impact(s) of working environment on human health has
also been recognised since 2 decades ago as an impact category in
LCA context. For instance, in the early 1990s, [134] already
affirmed that there was no quantitative method developed to
address such impact(s). Some similar and relevant aspects have
been briefly set forth by [8,19,20,90,96,102,121,139,144,151] where
different terminologies are adopted, including “accidents”,
“working condition”, “working environment”, “indoor air”, “indoor
air pollution”, “indoor and occupational exposure” etc. In brief,
accidents are recognised as an impact category which is poorly
developed with neither inventory nor characterisation factors
being available [151]; related to work environment (caused by
accidents or non-toxic substances) and shall be taken into account
comparatively to human toxicity category [90]; indecisive whether
the impacts of casualties attributable to accidents shall be seen as
an individual impact category because of the absence of standards,
and consequently, impacts attributional to work environment are
generally out of consideration [19]; and therefore being omitted
due to the difficulty in making prediction and the negligible effect
as perceived [102]. In this matter, [8] indicates that indoor air
pollution has already been included as a special application of LCIA
where [20] claims that human exposures to indoor chemicals can
be significant and LCIA is already available to assess such impacts
on internal environment in line with the report of 2 relevant case
studies. In terms of indoor and occupational exposure, [139] pro-
jects that it is to be considered as a part of human toxicity impact
category despite the fact that it has been developed as a new
impact category. The latter is in agreement with [144] who high-
lights the expeditious LCIA development for indoor and occupa-
tional exposure as a new impact category, which can be exem-
plified by [96,121].
Despite the recognition of the impact(s) related to work environ-
ment, none of the above mentioned literature has defined this impact
category, as do [177–179] – which may explain the use of a variety of
terminologies. However, it is commonly accepted that emissions are
generally released at both internal and external environments, and
any measure to reduce the impact of a product on the external
environment may result in negative effects on the working environ-
ment at the expense of human health [96,177,179]. To define, the
relevant phrases as presented in the literature are referred. Compared
to short and simple phrases adopted by other literature, [121] pre-
sents a more detailed remark, which can be adopted – the impacts of
working environment can be defined as the effects on human health
as a result of occupational exposures to biological, physical and/or
chemical hazards at working environment during the life cycle of a
product system. A comparison of literature is presented in Table 5,
distinguished by sample groups in chronological order. The concept of
existing methodologies is summarised as follows, also in chron-
ological order:
Table4(continued)
Concept(unit)SourceofnoiseSpatial
differentiation
Temporal
differentiation
Useofspecificparameter,
toolorapproach
Typeofdatarequiredfor
calculation
StrengthsLimitations
powerlevel(indecibel),
usingfateandeffectmod-
els[89]
livinginthecompartment;
directivityofsound[89]
processcausingthenoise
ratherthanthesituation
wherenoisetakesplace[89]
thereforecannotbeincluded
intoexistingLCIAmodels
straight-away
Fate-effectmodel[120]Processes[120]YesYesRastermaps(i.e.ArcGIS
10);fateandeffectmodels
[120]
Directivityofsound;sound
powerandsoundpowerlevel
[120]
Complement[89],provide
characterisationfactorsfor
futureLCAstudy;distinguish
fatefactorsfornoiseemissions
ininternal(occupational)and
externalenvironments[120]
À
J. Ling-Chin et al. / Renewable and Sustainable Energy Reviews 59 (2016) 352–378366
16. (1) Direct-quantitative-and-qualitative approach by [177] where
(i) death due to work related accidents; (ii) workdays lost due
to wok related accidents and diseases; (iii) workdays lost due
to illness; (iv) hearing loss; and (v) allergies, eczemas and
similar diseases are identified as quantitative impact cate-
gories estimated based on organisational statistics data,
together with (i) carcinogenic impact; and (ii) impact on
reproduction being identified as qualitative impact categories
and estimated based on semi-quantitative approach.
(2) A method to assess occupational health impacts is proposed
by [180] based on DALYs, which takes account of number of
morbidity, disability and mortality cases as well as the severity
and duration of the incidents in terms of years of life lost (YLL)
and years of life lived with disability (YLD). How to calculate
DALYs per industry sector is outlined as a 5-step approach:
(i) find out how many morbidity, disability and mortality cases
there are; (ii) quantify how long each morbidity/disability case
has been since the incidence; (iii) determine how severe each
case is; (iv) determine what the upstream impacts associated
with the sector are based on IO model; and (v) match the data
on morbidity, disability and mortality with IO data.
(3) Built on EDIP methodology, a sector-based working environ-
ment assessment is proposed by [178] where a number of
impact categories are identified, including total number of
accidents, fatal accidents, central nervous system function
disorder, musculoskeletal disorders, cancer, hearing damage,
skin diseases, airway diseases (allergic and non-allergic) and
psycho-social diseases. A five-step approach is suggested to
calculate the number of injuries and accidents per unit weight
of production: (i) identify sectors which show substantial rate
of injuries and accidents; (ii) identify the corresponding
products produced in these sectors; (iii) aggregate the number
of all products; (iv) account for the work-related damages and
injuries for the production activities based on statistics; and
(v) determine the impact of working environment per func-
tional unit, i.e. by dividing the outcome of (iv) by that of (iii).
(4) An impact assessment method for external and working
environments is proposed by [179]. In relation to working
environment, 2 impact categories i.e. occupational health (OH)
and occupational safety (OS) are recommended where lost
work days (LWD) is introduced as the category indicator for
both categories. Data regarding the number of workers
(i) affected by a particular hazardous item (WHI) and (ii)
diagnosed suffering certain magnitude of disability (WMD) are
required to estimate LWD for OH and OS impact categories,
taking account of exposure, effect and damage factors when-
ever applicable. Meanwhile, DALY and potentially affected
fraction (PAF) are adopted to assess the damage caused by
the external environment to human health and ecosystem
quality.
(5) The methodological framework developed by [181] aims to
assess human health effects due to indoor and outdoor
exposure to pollutants. The one-box model based on mass
conservation and concentration homogeneity is selected as
the default approach compared to the other 4 existing indoor
air exposure models i.e. one-box model with mixing factor,
multi-box model, two-zone model and eddy-diffusion model
which are all compatible to USEtox model. The latter is used
for assessing outdoor exposure assessment. In this case,
characterisation factors for human toxic effects are calculated
by determining the product of intake and effect factors.
(6) Two methods, i.e. Methods 1 and 2, are proposed by [182] to
rank and identify chemicals to be included in LCA study. Based
on USEtox model, Method 1 takes into account the concentra-
tion and severity of exposure, effect factors (EF) and the
exposed population where the number of exposed personnel
is applied as a weighting factor. Acting as a quality control tool,
Method 2 is based on the risk quotient (RQ) as applied in
occupational risk assessment, i.e. ratio of exposure concentra-
tion to occupational exposure limit. Data required for the
assessment is collated from literature, toxicity report and
databases. Characterisation factors in terms of DALY are then
calculated by determining the sum of cancer and non-cancer
effects.
(7) Work environment disability-adjusted life year (WE-DALY) is
introduced by [96] which can be used to calculate the
characterisation factors for the impacts on human health
attributable to hazardous exposure in working environment.
Using published statistics data for each industry, WE-DALY
estimates the sum of the number of years of life lost (YLLn,
representing the difference between the average lifespan of
the workers and the actual age at death of the deceased
worker) and the number of years of life lived with disability
(YLDn, representing the duration of suffering certain injury or
illness due to working environment).
(8) Work environment characterisation factors (WE_CF) by [121]
is a continuation of the WE-DALY method developed by [96]
to complement LCIA for the impact on human health attribu-
table to work environment. WE_CF is determined as the ratio
of WE-DALY to the physical output (e.g. mass and volume)
produced by the industry.
An additional remark is that [179,121] have respectively clas-
sified existing approaches in line with chemical use/screening,
work process and sector/compartment model; however, most of
the literature is inaccessible (and therefore not further discussed
here), which presents a possible reason why the impact(s) of
working environment has been rarely included in LCA studies.
4.4. Interpretation – uncertainty and sensitivity analyses
In estimating potential environmental impacts, LCA, by its very
nature, associates with uncertainties. Uncertainty is defined as the
quantity discrepancy between the real values and the data used in
the study [20] generally obtained from experiments, calculations,
assumptions or estimations. Also, uncertainty can be defined
quantitatively and qualitatively: the former is a measure which
determines the spread of values attributed to a parameter while
the latter refers to the lack of precision in data and methodologies
due to incomplete data, lack of transparency, unrepresentative
methods and the choice made [70]. According to [19], uncertainty
is the ‘lack of knowledge’ with respect to true quantity value and
model form, appropriateness of modelling and methodological
decision, and therefore, its effects can be addressed by uncertainty
analysis (UA) and sensitivity analysis (SA). This is in agreement
with [7,70] in which UA and SA appear to be coupled to each other.
Accordingly, UA is defined as a systematic technique which
quantifies the uncertainty in LCI results due to variability and
inaccuracy of data and model while SA is defined as a systematic
technique which assesses the effects of methodological choice and
data on the results [6,7].
To get a grasp of the state-of-the-art methodological development
in this context, literature in Sample Groups A and B is analysed and
the findings are presented in Table 6. In contrast to the vast number
of literature recognising the inherent uncertainties in LCA (and the
need to address them by performing UA and SA), the methodological
concept in LCA context has not been widely covered. A few pub-
lications have attempted to explicitly classify the types of uncer-
tainty; however, a common drawback is found as each list is limited
to a few uncertainty types among many. Built on [6,7,9,12,19,20,
70,73,80,83,124,130,139,147,148], all uncertainty types are integrated
as illustrated in Fig. 9 to present an overarching scope.
J. Ling-Chin et al. / Renewable and Sustainable Energy Reviews 59 (2016) 352–378 367
17. Table 5
Comparison of literature on the impacts of work environment.
Phrase used Proximity to impact of/
from/in/to the work
environmenta
Level of
detailb
Highlight of the literature [Resource]
Accidents; workplace exposure; working conditions C II, III Working conditions is recognised as an environmental pro-
blem; accidents and working conditions are respectively
discussed as process data and an impact category [134].
Accidents; work environment; impacts from the work
environment
A, B I Toxic impacts of the work environment shall be assessed as a
part of human toxicity impact category while non-toxic
impacts of the work environment and those caused by acci-
dents shall be further considered as separate impact cate-
gories [90].
Accidents D I The impact category of accidents is usually not covered due to
perceived marginal threat and difficulty in making any pre-
diction [102].
Casualties due to accidents; impacts in work environment;
chemical exposure at the workplace
A I The lack of standards leads to (i) indecisive situation if
“casualties due to accidents” shall be considered as an inde-
pendent category; and (ii) exclusion of “impacts in work
environment” from further assessment [19].
Indoor and occupational exposure; injuries related to working
environment accidents
B II Indoor and occupational exposure, including injuries
(casualties) related to working environment accidents, is
recognised as a new impact category undergoing character-
isation model development—currently as a separate impact
category but will become a part of human toxicity in future
[139].
Indoor air; indoor chemical exposure; impacts to the working
environment
A III A short summary is presented in relation to a few selected
literature published between 1998 and 2009 in this context. It
is noted that LCIA is available to assess human exposures to
indoor chemicals as 2 relevant case studies have been
reported [20].
Indoor air pollution D I As an area of concern to many building occupiers, indoor air
has become a special application of LCIA [8].
Indoor and occupational exposure D I Rapid development of indoor and occupational exposure is
noted [144].
Accidents D I The development of some impact categories like accidents is
poor as neither inventory data nor characterisation factors are
available [151].
Work-related impacts; impacts to human health attributable to
work-related exposures to workplace hazard; occupational
health impacts from the work environment
A IV and V The “impacts to human health attributable to work-related
exposures to workplace hazards” is expressed in terms of
work environment disability-adjusted life year (WE-DALY),
and its calculation is shown via a case study, which can be
used for characterisation factor determination [96].
Working conditions D I “Working conditions” is recognised as a social impact of a
product system [25].
Impacts to human health attributable to the work environment;
the work environment impact category; impacts from the
work environment
A IV and V The work environment disability-adjusted life year (WE-
DALY) of an industry is calculated with workplace data. Then,
WE-DALY is used to determine work environment char-
acterisation factors (WE-CF) [121].
Additional literature materials, i.e. Sample Group C:
Impacts of the work environment; work-related accidents A IV 5 quantitative and 2 qualitative work environment impact
categories are proposed. Data collection, reliability and rele-
vance of these impact categories are discussed [177].
Occupational health impacts; health impacts due to hazardous
work environments; workplace injuries; workplace-related
illnesses
B IV and V A method to assess occupational impacts is proposed based
on DALYs and an example is provided to show how the results
of the model can be applied [180].
Working environmental impact; Occupational exposure; work-
related damage; occupational accidents; occupational dis-
eases and occupational injuries
A IV and V A method to calculate impacts of working environment per
functional unit is proposed and its application is presented
[178].
Impacts on the working environment; occupational health and
safety; occupational health; occupational safety; occupational
accidents; occupational diseases; occupational disabilities
A IV and V A new methodology is developed to assess the total impacts
on the working and external environments and its applic-
ability is shown in a case study [179].
Health effects from indoor pollutant emissions and exposure;
human-health effects from indoor exposure; occupational
exposure
C IV and V In line with existing model used for assessing outdoor emis-
sions, the one-box exposure model is selected to determine
the characterisation factors for human toxic effects due to
indoor exposure [181].
Indoor occupational exposure; occupational health effects;
occupational diseases; human-health impacts from indoor
exposure
C IV and V In line with USEtox model, the indoor occupational priority list
for LCA (OCPL-LCA, referred to as Method 1) is developed,
which can be used for assessing human-health impacts attri-
butable to indoor occupational exposures to solvents [182].
a
Proximity to “impact(s) of work environment”.
A Explicitly, if “impact(s) of/from/in/to the work(ing) environment” is mentioned.
B Implicitly, if “work(ing) environment” is mentioned.
C Loosely, if “workplace” is mentioned but not directly connected with the impact(s).
D Indistinctly, if neither work environment nor workplace is mentioned.
b
Level of detail.
I Recognition only without discussion at LCI or LCIA level.
II Brief discussion at LCI level.
III Brief discussion on LCIA methodology.
IV In-depth discussion on LCIA methodology.
V Application/case study.
J. Ling-Chin et al. / Renewable and Sustainable Energy Reviews 59 (2016) 352–378368
18. As reported by [19,20,101], a range of approaches have been
proposed for UA. [174,183–188] are included in Sample Group C to
complement the analysis. The fundamental concept and applica-
tion of the statistical, scientific, social/constructive and graphical
approaches of UA in the context of LCA are discussed as follows:
(1) Statistical approach
(i) Stochastic modelling – to propagate uncertainty due to inac-
curate data [188], input and output parameter uncertainty
[184] and model uncertainty [101]. Stochastic modelling
involves the use of
a. a probability distribution for different conditions [185]:
uniform for less studied and/or more debated parameters
normal if the input data are the average values of the data
collected
lognormal for skewed data limited to positive values only
triangular for less studied and/or more debated parameters
beta generally for several shapes of distribution bounded on
both positive and negative sides where no prior knowledge is
required
gamma for model developed from real world samples
b. a sampling technique. The parametric sampling technique, e.g.
bootstrapping as recognised by [20], is not included in this
article as its methodological concept in LCA context for UA
application is not found. Random and non-parametric sam-
pling includes
Monte Carlo [101,187,188]. Within a defined range, all para-
meters are varied and selected randomly by employing a
computer. To deal with inaccurate data, all key input parameters
are specified and applied one by one in the calculation. To deal
with model uncertainty, characterisation factors are repeatedly
calculated with all possible uncertainties. After an extensive
number of repetitions, the results form a probability distribu-
tion where the statistic properties of the distribution are
investigated. Monte Carlo is technically valid and widely
recognised.
Latin Hypercube [184,187]. This is a special type of Monte Carlo
simulation which segments the uncertainty distribution into
non-overlapping intervals (with equal probabilities). From each
interval, a value is randomly chosen and substituted into an
equation to obtain an output variable. The output variables
generate a distribution with a representative frequency chart.
The complex mathematic model of this sampling method
presents a drawback and hinders its application.
(ii) Non-parametric good-of-fit test, e.g. Kolmogorov–Smirnov
(K–S) test and Chi-Square test [124] – to choose the best
hypothesised distribution. The frequency distribution of
inventory data (with multiple parameters collected from
industries or via simulation) and the probability density
function of a hypothesised distribution (normal, lognormal,
gamma, beta etc. generated by Maximum Likelihood Estima-
tion based on the characteristics of parameters, i.e. mean,
standard deviation etc.) are assessed by K–S and Chi-Square
tests. A null hypothesis is set, i.e. both distributions are in
consistency. A critical value is assigned to K–S and Chi-Square
tests to decide if the null hypothesis is true at the significance
level of 0.05. When the results of K–S and Chi-Square tests are
in conflict (very uncommonly), apply K–S test for a small
sample (with 30 data or less) and Chi-Square test for a
relatively bigger sample. The lowest values of results from
both tests indicate the best distribution of the inventory data.
(iii) Analytical method [185–187] – to propagate uncertainties due
to input data on the model outputs. The relationship between
input and output variables is evaluated by estimating the
moments, i.e. variance or standard deviation of the distribution
based on Taylor series. Although the analytical method requires
less information regarding the distribution and is computation-
ally efficient compared to sampling method, its application is
practically hindered by the complexity of Taylor series.
(iv) Fuzzy number [79,81] – to propagate epistemic uncertainty
inherent in matrix-based inventories by applying upper and
lower limits to emission and resource flow inventory vectors
to create a number of matrices. For the defined degrees of
belief, i.e. α-cuts¼0,…,1, the matrices are solved. The inven-
tory results at all α-cuts are combined to form a fuzzy
distribution. The approach is advantageous as it is more
informative and computationally efficient. It is claimed that a
comparison between alternatives of epistemic uncertainties
can be made by ranking the fuzzy numbers; however, no
methodological concept is provided.
(v) Bayesian [183] – to estimate model uncertainties which
propagate parameter uncertainties. A probability distribution
is generated by applying stochastic modelling, i.e. select a
Table 6
The coverage of uncertainty, uncertainty and sensitivity analyses in literature.
Subtopic Resources
1. Uncertainty
Recognition of uncer-
tainty inherent in
LCAa
[6–9,12,15–20,22–25,63,66,69–
74,79,80,82,86,87,89,90,92,93,97,100–
104,106,114,118,119,128–131,137–
140,144,147,148,150,152]
Definitionb
[19,20,70]
Typesc
Explicitly: [12,19,20,70,80,124,139,147]
Implicitly: [6,7,9,73,83,130,148]
Sourcesb
[17,20,73]
Problemsb
[19]
2. Uncertainty analysis
Recognition of (the
need for) uncertainty
analysisa
[6–9,12,15,17,19,20,23–25,63,64,69,70,72,74,79,80,88–
90,96,100–102,104,113,114,119,128–
131,138,139,141,144,145]
Definitionb
[6,7,70]
Methodologiesd
[19,20,101]
Methodologies speci-
fically for LCId
[7,70,73,79–81,124]
Methodologies speci-
fically for LCIAd
[115,118,124,150]
Methodological
concepte
[81,115,124]
Applicationf
[115,124]
3. Sensitivity analysis
Recognitiona
[6,15–20,23,72,73,76,79,80,89,101,102,128,138–
140,147,148]
Methodological
concepte
[7,70,122,134,135]
Applicationf
[1,6,7,70,122,134,135]
a
Uncertainty (as is the need for uncertainty and sensitivity analyses) is
recognised if it is only cursorily mentioned.
b
Definition, sources or problems commonly associated with uncertainty is
reported when discussion on the corresponding topic is unambiguously pre-
sented.
c
The types of uncertainty is explicitly included if they are appropriately
organised; or implicitly presented if one or more uncertainty types are unsyste-
matically mentioned.
d
Methodologies for UA and SA are covered if a suggestion(s) is made (without
detail)—in the case of UA, the suggestion can be general or specific for addressing
uncertainties at LCI or LCIA level.
e
Methodological concept is proposed if the fundamental principle is dis-
cussed.
f
Application is performed if the methodology is implemented and/or the
results are shown.
J. Ling-Chin et al. / Renewable and Sustainable Energy Reviews 59 (2016) 352–378 369
19. prior distribution type of uncertainties and employ Monte
Carlo to calculate the indicator results of an impact category
repeatedly. To measure the importance of each parameter
uncertainty, the correlation coefficient between the input
parameter and its outputs is calculated. A posterior probability
is then formed by applying Bayesian update procedure. For
each parameter, the ratio of standard deviation to means
(known as the coefficient of variation) can be calculated to
determine how much uncertainty is reduced.
(vi) Interval calculation [187]. A 95% confidence interval is gen-
erally calculated by using standard deviation in the analytical
method and non-parametric good-of-fit test.
(2) Scientific approach
(i) More research [101] – to reduce model uncertainty. Carry out
more scientific research for better measurements and more
accurate data.
(ii) The scale of uncertainties [80] – to manage uncertainties at LCI
level. After performing a hybrid LCI, uncertainties due to data,
cut-off, aggregation, temporal and spatial factors are estimated
so that ways for improvement can be identified by comparing
the scale of uncertainties. Then, data of low relevance are
replaced by data of higher quality, followed by estimation and
comparison of the uncertainty scales, iteratively until the results
are sufficiently certain. A critical issue with this approach exists
as detail on estimating uncertainties is not provided.
(iii) Scenario comparison [101,186,187] – to investigate the effect
of data and model uncertainties on the results via parameter
variation (also known as scenario analysis). All parameters
remain unchanged while one specific parameter (or a number
of consistent scenarios of parameter e.g. best, worst and
average cases) is varied. In addition, model uncertainty can
also be dealt with by comparing the characterisation factors
calculated from a few strategically manipulated uncertainty
parameter values.
Fig. 9. Types of uncertainty inherent in LCA.
J. Ling-Chin et al. / Renewable and Sustainable Energy Reviews 59 (2016) 352–378370
20. (iv) Uncertainty factors (UFs) to deal with
unrepresentative input data due to future technology, tem-
poral and geographical factors [188]. Based on empirical
analysis of technological development, time series and cross-
sectional data on process inputs and environmental releases,
the UFs are estimated and applied to the unrepresentative
input data.
uncertainties due to parameters and choice [115,184]. UFs are
used to characterise the parameter uncertainty of input data
while stochastic modelling (i.e. Monte Carlo or Latin Hypercube
simulation) is applied to quantify and propagate parameter
uncertainty of the output variables into a particular distribution
type. A comparison indicator can be used to compare the choice
between 2 products.
pairwise comparison of alternatives [174]. Based on the LCIA
results for 2 scenarios for an impact category (in the form of
crisp number, probability distribution function or fuzzy mem-
bership function), the preference relationships between scenar-
ios (i.e. one scenario is preferred, strongly preferred, not
preferred or strongly not preferred to the other) are evaluated
and aggregated. The aggregated results of the preference rela-
tions for each couple of scenarios are used for the calculation of
the classical entropy measure and an index; and accordingly, all
scenarios under study can be ranked from the worst to the best
or vice versa.
(3) Social/constructive approach [186,188]. Pedigree matrix is
applied to qualitatively deal with uncertainties due to unre-
presentative or unavailable data. This is done by identifying
relevant data quality indicators, e.g. temporal, spatial and
future technology correlations, at different levels. Accordingly,
a score is assigned to each level, e.g. for temporal indicator,
levels 1, 2 and 3 represent data age groups 0–3, 4–10 and 11–
15 years respectively etc.. Expert judgment and/or inputs from
stakeholders are required in defining the pedigree matrix and
furthermore assigning the scores to indicate the level of each
indicator applicable to the case under study.
(4) Graphical approach [185]. Some graphic tools including error
bars, histograms, box-and-whisker plots (Tukey box), cumu-
lative distribution functions and the graphs of mean outcome
versus the number of iteration for modelling are used to
visually show how certain/uncertain the results are.
In short, scientific approach by more research directly reduces
uncertainties; scenario comparison and graphical approaches
show the effects of inputs (e.g. parameters and choice) on the
results; stochastic modelling, scale of uncertainties and UFs deal
with uncertainties while analytical method, fuzzy number, Baye-
sian and hybrid LCI by nature propagate uncertainties.
SA also applies mathematics concepts (in addition to scenario
analysis) to investigate the influence of methodological choice
such as input data and assumptions on the result(s). Compared to
ISO 14040 [6] which suggests SA as one of the reasons for the
differences in LCIA results for alternative products, ISO 14044 [7]
has put more emphasis on the use of SA to (i) check input and
output data during LCI for significant environmental burdens and/
or further system boundary refinement; (ii) obtain additional
information for the reference choice during normalisation; (iii)
assess the consequences of value choice during weighting; (iv)
check for sensitivity and limitations of the study during inter-
pretation; and (v) include mass, energy and environmental sig-
nificance criteria in SA for a comparative study. Among review
articles of Sample Group A as presented in Table 1, [9,16,18–20,24]
have embraced the role of SA in LCA studies. Meanwhile,
a constantly gradual (but not sufficiently detailed) development
can be observed in the literature of Sample Group B from a very
brief recognition [6,15–20,23,72,73,76,79,80,89,101,102,128,138–
140,147,148] to a short discussion on the basic concept covering
the use of reliability and validity analyses [134,135], percentage of
change or the absolute deviation [7], and temporal sensitivity
[122] as a measure for SA, possibly supported by the application of
qualitative method (i.e. expert judgement) or quantitative meth-
ods including the use of spreadsheets, linear and non-linear pro-
gramming [70]. In addition, SA has been performed in some LCA
studies [1,6,7,70,122,134,135] but the applied methodologies have
not been detailed. As a matter of fact, SA is not new and has been
commonly applied in other fields, e.g. weather forecast, decision
making and risk assessment, to name but a few. A number of
common methodologies are preliminarily but not exclusively
identified partially in accordance with [189,190] and categorised
with a brief description as illustrated in Fig. 10, which can be seen
as a connecting point for stimulating research development of SA
in the context of LCA.
4.5. Research needs and areas for future development
Probably in response to a particular remark presented in ISO
14040 [6], ‘there are no generally accepted methodologies for
consistently and accurately associating inventory data with specific
potential environmental impacts’ (page 16), selecting the best
practice or recommended approach via comparison, harmonisa-
tion or consensus building has become common recently, as
shown in Table S6 of the Supplementary material. In respect of
this, [152] points out that consensus building is not practical due
to the fact that existing methods under evaluation may have less
scientific ground while new methodologies are constantly being
developed, which would be excluded from such evaluation. As
advocated by [152], LCA research shall focus on meeting the major
challenges e.g. integrating global scale and spatial differentiation.
Other unremittent challenges for future LCA development are
identified via this analysis, as follows:
LCI data – while LCI approaches are well developed, unavailable,
missing, out-of-date and unrepresentative data have remained a
major obstacle to deliver reliable LCA results. Research into
developing robust and representative inventory is required.
Classification involving series and parallel mechanisms – some
elementary flows are attributable to more than one impact
categories which are likely to be assessed in an LCA study.
Relevant examples include, first, SO2 which generally results in
acidification, human toxicity and aquatic ecotoxicity [109]; and
second, water which results in water deprivation [156] due to
consumption and furthermore the depletion of water as a
natural resource [26]. How to appropriately classify such ele-
mentary flows in series and parallel mechanisms shall be
explored and developed.
LCIA methodology – research on the impacts of water use, noise
and working environment is still ongoing and shall be further
expanded to cover comprehensive scope and take into account
spatial and temporal dimensions. Other impact categories includ-
ing space use, odour, non-ionising radiation (i.e. electromagnetic
waves) and thermal pollution [134,144] have been noted but their
characterisation model has not yet developed. At present, there is
no environmental mechanism, indicator, characterisation factor
and model available for these impact categories.
Uncertainty and sensitivity analyses – in relation to UA, meth-
odology that can be applied to address uncertainties due to
incompleteness and inconsistency has not been explored. Also,
how to incorporate existing methodologies for SA, for example
advance statistics, into LCA study shall be further studied.
J. Ling-Chin et al. / Renewable and Sustainable Energy Reviews 59 (2016) 352–378 371
21. Any other relevant topics – other elements which are not
explicitly included in ISO Standards, for example rebound
effects, renewability of resources, dynamic of environment and
future scenario modelling, are of increasing importance from
pragmatic perspective. Indeed, dealing with rebound effects or
renewability as well as modelling dynamic environment or
future scenario are challenging and require extensive research
engagement to overcome its complex nature.
5. An LCA framework for marine PV systems
In this section, the focus is on proposing an LCA framework for
marine PV systems based on literature analysis presented in earlier
sections, existing reviews [46–48] and ISO Standards [6,7]. Hence,
LCA framework and studies discussed in this section are pertinent
to marine PV systems and for brevity, they are respectively refer-
red to as LCA framework and LCA study or the study.
Fig. 10. The basic concept and difficulty level of some common SA methods.
J. Ling-Chin et al. / Renewable and Sustainable Energy Reviews 59 (2016) 352–378372
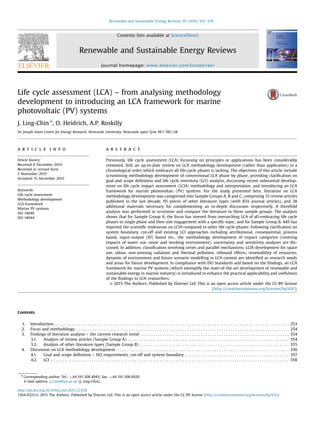
![4.2.1. Attributional and consequential approaches – clarification on what processes to include . . . . . . . . . . . . . . . . . . . . . . . . . . . . . 358
4.2.2. LCI approaches – clarification on what data sources and principles to use for quantity computation . . . . . . . . . . . . . . . . . . . . 359
4.3. LCIA – recent methodological development. . . . . . . . . . . . . . . . . . . . . . . . . . . . . . . . . . . . . . . . . . . . . . . . . . . . . . . . . . . . . . . . . . . . . . . . . 360
4.3.1. The impact of water use . . . . . . . . . . . . . . . . . . . . . . . . . . . . . . . . . . . . . . . . . . . . . . . . . . . . . . . . . . . . . . . . . . . . . . . . . . . . . . . . . 360
4.3.2. The impact of noise . . . . . . . . . . . . . . . . . . . . . . . . . . . . . . . . . . . . . . . . . . . . . . . . . . . . . . . . . . . . . . . . . . . . . . . . . . . . . . . . . . . . . 361
4.3.3. The impact of working environment/impact related to work environment . . . . . . . . . . . . . . . . . . . . . . . . . . . . . . . . . . . . . . . . . 366
4.4. Interpretation – uncertainty and sensitivity analyses . . . . . . . . . . . . . . . . . . . . . . . . . . . . . . . . . . . . . . . . . . . . . . . . . . . . . . . . . . . . . . . . . 367
4.5. Research needs and areas for future development . . . . . . . . . . . . . . . . . . . . . . . . . . . . . . . . . . . . . . . . . . . . . . . . . . . . . . . . . . . . . . . . . . . 371
5. An LCA framework for marine PV systems. . . . . . . . . . . . . . . . . . . . . . . . . . . . . . . . . . . . . . . . . . . . . . . . . . . . . . . . . . . . . . . . . . . . . . . . . . . . . . . . 372
5.1. Goal and scope definition . . . . . . . . . . . . . . . . . . . . . . . . . . . . . . . . . . . . . . . . . . . . . . . . . . . . . . . . . . . . . . . . . . . . . . . . . . . . . . . . . . . . . . . 373
5.2. LCI analysis . . . . . . . . . . . . . . . . . . . . . . . . . . . . . . . . . . . . . . . . . . . . . . . . . . . . . . . . . . . . . . . . . . . . . . . . . . . . . . . . . . . . . . . . . . . . . . . . . . 374
5.3. LCIA . . . . . . . . . . . . . . . . . . . . . . . . . . . . . . . . . . . . . . . . . . . . . . . . . . . . . . . . . . . . . . . . . . . . . . . . . . . . . . . . . . . . . . . . . . . . . . . . . . . . . . . . 375
5.4. Life cycle interpretation. . . . . . . . . . . . . . . . . . . . . . . . . . . . . . . . . . . . . . . . . . . . . . . . . . . . . . . . . . . . . . . . . . . . . . . . . . . . . . . . . . . . . . . . . 375
6. Conclusions . . . . . . . . . . . . . . . . . . . . . . . . . . . . . . . . . . . . . . . . . . . . . . . . . . . . . . . . . . . . . . . . . . . . . . . . . . . . . . . . . . . . . . . . . . . . . . . . . . . . . . . . 375
Acknowledgement. . . . . . . . . . . . . . . . . . . . . . . . . . . . . . . . . . . . . . . . . . . . . . . . . . . . . . . . . . . . . . . . . . . . . . . . . . . . . . . . . . . . . . . . . . . . . . . . . . . . . . . 375
Appendix A. Supplementary material. . . . . . . . . . . . . . . . . . . . . . . . . . . . . . . . . . . . . . . . . . . . . . . . . . . . . . . . . . . . . . . . . . . . . . . . . . . . . . . . . . . . . 375
References . . . . . . . . . . . . . . . . . . . . . . . . . . . . . . . . . . . . . . . . . . . . . . . . . . . . . . . . . . . . . . . . . . . . . . . . . . . . . . . . . . . . . . . . . . . . . . . . . . . . . . . . . . . . . 375
1. Introduction
Previously referred to as ‘cradle-to-grave assessment’ i.e. from
acquiring raw materials, manufacturing and using to returning
back to the earth, life cycle assessment (LCA) has been practised
since the early 1970s to assess the environmental impact of a
product, either goods or service, throughout its life cycle [1].
Aiming to introduce a universal technique which could be widely
used to address the potential environmental impacts associated
with a product, the International Organisation for Standardisation
(ISO) introduced the principles, framework and basic requirements
of handling each LCA phase in 1997 [2]. This was extended in the
late 90s and beyond for the four LCA phases, including goal and
scope definition and life cycle inventory (LCI) analysis [3], life cycle
impact assessment (LCIA) [4] and interpretation [5], which were
then revised and replaced by two shorter but more succinct
documents, ISO 14040 and ISO 14044 [6,7]. An elaboration of the
historical development of the Standards can be seen in [8,9], in
addition to a summary of changes reported by [10].
The following conclusion made by [9] deserves further
investigation:
…critiques of the ISO 14040 series has markedly dropped off since
its redrafting and consolidation in 2006. Indeed, some recom-
mendations are merely repetitions of similar arguments made
previously or remain unsuitable…
The nonexistence of persistent critique, even if it was the case,
does not necessarily indicate acceptance or satisfaction. A possible
explanation is that neither new ideas nor solutions have been
proposed while the research community has become tired of the
persistent problems. Indeed, some issues associated with the ISO
14040 series have been reported by [11–14] after the revision,
including its overly flexible nature, the absence of step-by-step
guidelines, the unequal level of detail, the legitimacy of the results
as well as the lack of consistency and quality assurance, to name
but a few. If recommendations are repeated, do they not imply a
possibility of unresolved issues? Also, it is unclear which recom-
mendations are ‘unsuitable’ in this context as no elaboration has
been provided. If the claim (that the critiques have dropped off
after revision) holds true – which it does not – it will be intriguing
to find out if LCA, which is the focus of the Standards, has also
become mature and free of critiques too.
A number and variety of LCA reviews have been published,
either focussing on principles, challenges and opportunities
[8,12,15–26] or covering LCA applications for materials [27,28],
buildings and construction [29–34], food [35], transport [36,37],
energy sources (such as bioenergy [38–45], solar [46–49], wind
[50–53] and geothermal [54]) and electricity generation [55–57].
This does not repudiate but intensify the need of this article
because an up-to-date analysis on LCA methodology development
(rather than application) embracing all life-cycle phases is still
lacking while it is intriguing to find out if LCA has become mature.
To date, no one has ever attempted to review existing review
articles. Also, integrating concepts/approaches proposed for a
particular topic and clearly showing research development trend
in a chronological order are missing. Therefore, this article aims to
provide an up-to-date analysis on LCA methodology development
covering 4 life-cycle phases. The following objectives are set:
scrutinise LCA methodology development phase by phase to
compare and integrate the proposed concepts or approaches;
clarify goal and scope definition and LCI analysis;
discuss LCIA methodologies for impact categories that have
recently shown substantial development;
detail methodology development with respect to life cycle
interpretation; and
introduce an LCA framework for marine PV systems based on
the analysis.
The focus of this article lies on methodology development of
conventional LCA embracing the four life cycle phases. In this article,
a threefold analysis was developed (Section 2) as opposed to a
commonly used one-off approach, followed by a presentation of
analysis outcome (Section 3). From the analysis, areas are identified
for discussion. Section 4 clarifies additional dimensions proposed for
cut-off and system boundary selection in relation to goal and scope
definition. Clarification on LCI is also provided to cover (i) the choice
of attributional and consequential approaches dependent on what
processes to include; and (ii) the integration and comparison of
process based, fuzzy matrix based, input–output (IO) based, tiered
hybrid, IO based hybrid and integrated hybrid approaches in accor-
dance with data sources and fundamental principles. Methodology
development of the identified impact categories (namely the impacts
of water use, noise and working environment) with respect to LCIA
as well as uncertainty and sensitivity analyses for life cycle inter-
pretation are discussed extensively. Based on the analysis, research
needs are highlighted. To enhance the practical applicability and
usefulness of the findings to LCA researchers, an LCA framework for
marine photovoltaic (PV) systems is introduced in Section 5 prior to
drawing conclusions in Section 6. PV systems are chosen as they
exemplify the state-of-the-art development of renewable and sus-
tainable energy in marine industry. This article demonstrates that
J. Ling-Chin et al. / Renewable and Sustainable Energy Reviews 59 (2016) 352–378 353](data:image/gif;base64,R0lGODlhAQABAIAAAAAAAP///yH5BAEAAAAALAAAAAABAAEAAAIBRAA7)