1918 Flu Pandemic Cities Curve
•Télécharger en tant que PPTX, PDF•
0 j'aime•4 vues

Epidemic investigation lecture

Recommandé
Recommandé
Contenu connexe
Similaire à 1918 Flu Pandemic Cities Curve
Similaire à 1918 Flu Pandemic Cities Curve (20)
Dernier
Dernier (20)
1918 Flu Pandemic Cities Curve
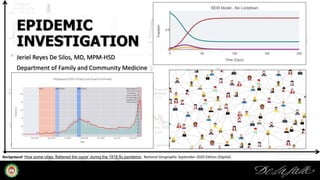
- 1. Background: How some cities ‘flattened the curve’ during the 1918 flu pandemic. National Geographic September 2020 Edition (Digital). EPIDEMIC INVESTIGATION Jeriel Reyes De Silos, MD, MPM-HSD Department of Family and Community Medicine
- 2. Background: How some cities ‘flattened the curve’ during the 1918 flu pandemic. National Geographic September 2020 Edition (Digital). Objectives: At the end of the lecture, students should be able to: Explain the different levels of disease; Explain the three objectives of epidemic investigation; Examine the different types of epidemic; Given the initial information of a possible disease outbreak, describe how to determine whether an epidemic exists; Discuss the steps in investigating epidemics.
- 3. Background: How some cities ‘flattened the curve’ during the 1918 flu pandemic. National Geographic September 2020 Edition (Digital). I. Levels of Disease
- 4. Background: How some cities ‘flattened the curve’ during the 1918 flu pandemic. National Geographic September 2020 Edition (Digital). I. Level of Disease Epidemic Outbreak Cluster Pandemic Endemic Sporadic Hyperendemic
- 5. Background: How some cities ‘flattened the curve’ during the 1918 flu pandemic. National Geographic September 2020 Edition (Digital). I. Levels of Disease Normal Range of Cases I. Levels of Disease Definition: 1. Epidemic: • The occurrence in a community or region of cases of illness, specific health-related behavior or health- related events clearly in excess of normal expectation. (Last. A Dictionary of Epidemiology, 4th ed.) • “Unusually high disease occurrence in an area.” Date Confirmed Cases
- 6. Background: How some cities ‘flattened the curve’ during the 1918 flu pandemic. National Geographic September 2020 Edition (Digital). I. Levels of Disease Normal Range of Cases I. Levels of Disease Definition: 2. Outbreak: An epidemic limited to localized increase in the incidence of a disease, e.g., in a village, town, or closed institution. (Last. A Dictionary of Epidemiology, 4th ed.) Date Confirmed Cases
- 7. Background: How some cities ‘flattened the curve’ during the 1918 flu pandemic. National Geographic September 2020 Edition (Digital). Cluster of dengue cases I. Levels of Disease I. Levels of Disease Definition: 3. Cluster: Aggregation of cases grouped in place and time that are suspected to be greater than the number expected. (www.cdc.goc/epicasestudies. Available: 2017)
- 8. Background: How some cities ‘flattened the curve’ during the 1918 flu pandemic. National Geographic September 2020 Edition (Digital). I. Levels of Disease I. Levels of Disease Definition: 4. Pandemic: An epidemic that has spread over several countries or continents, usually affecting a large number of people. (www.cdc.goc/epicasestudies. Available: 2017)
- 9. Background: How some cities ‘flattened the curve’ during the 1918 flu pandemic. National Geographic September 2020 Edition (Digital). Normal Range of Cases I. Levels of Disease I. Levels of Disease Definition: 5. Endemic: • Constant presence of disease within a geographical area (Last. A Dictionary of Epidemiology, 4th ed.) • Constant presence and/or usual prevalence of a disease or infectious agent in a population within a geographic area (www.cdc.goc/epicasestudies. Available: 2017) • Examples: Malaria (Palawan), Schistosomiasis (Samar-Leyte Islands) Date Confirmed Cases Moving Average
- 10. Background: How some cities ‘flattened the curve’ during the 1918 flu pandemic. National Geographic September 2020 Edition (Digital). I. Levels of Disease I. Levels of Disease Definition: 6. Sporadic: • Intermittent presence of disease within a geographical area. (Last. A Dictionary of Epidemiology, 4th ed.) • Disease that occurs infrequently and irregularly. • (www.cdc.goc/epicasestudies. Available: 2017) • Examples: Chikungunya, Alzheimer’s disease Date Confirmed Cases Sporadic cases
- 11. Background: How some cities ‘flattened the curve’ during the 1918 flu pandemic. National Geographic September 2020 Edition (Digital). I. Levels of Disease Normal Range of Cases I. Levels of Disease Definition: 7. Hyperendemic: A disease that is constantly present at a high incidence and/or prevalence and affects most or all age groups equally. (Last. A Dictionary of Epidemiology, 4th ed.) Hyperendemic – “constant” Epidemic – “sudden” Date Confirmed Cases Moving Average
- 12. Background: How some cities ‘flattened the curve’ during the 1918 flu pandemic. National Geographic September 2020 Edition (Digital). II. Objectives of Epidemic Investigation
- 13. Background: How some cities ‘flattened the curve’ during the 1918 flu pandemic. National Geographic September 2020 Edition (Digital). II. Objectives of Epidemic Investigation 1. To determine the nature of the disease and the mode of its propagation; 2. To ensure that specific control measures will be applied; 3. To prevent further transmission of the disease- causing agents.
- 14. Background: How some cities ‘flattened the curve’ during the 1918 flu pandemic. National Geographic September 2020 Edition (Digital). III. Types of Epidemic Pattern
- 15. Background: How some cities ‘flattened the curve’ during the 1918 flu pandemic. National Geographic September 2020 Edition (Digital). III. Types of Epidemic Pattern 1. Common- source Epidemic Intermittent Continuous Point-source 2. Propagated Epidemic 3. Mixed Epidemic
- 16. Background: How some cities ‘flattened the curve’ during the 1918 flu pandemic. National Geographic September 2020 Edition (Digital). III. Types of Epidemic Pattern 1. Common-source epidemics: Caused by exposure to a COMMON NOXIOUS INFLUENCE at the same time Exposure period can be: Brief (point-source) Long (continuous) Intermittent Example: Food poisoning
- 17. Background: How some cities ‘flattened the curve’ during the 1918 flu pandemic. National Geographic September 2020 Edition (Digital). III. Types of Epidemic Pattern 1. Common-source epidemics: A. Point-source: Happens when a group is exposed to a disease source over a short period. Everyone who got the disease does so within one incubation period. DISEASE SOURCE Close contact range
- 18. Background: How some cities ‘flattened the curve’ during the 1918 flu pandemic. National Geographic September 2020 Edition (Digital). III. Types of Epidemic Pattern 1. Common-source epidemics: A. Point-source: Incubation period: The time interval between the exposure of a susceptible person to a pathogen and the appearance of signs and symptoms Time (in DAYS) Start of infection No infection Incubation Period With Symptoms Recovered Hypothetical Infectious Disease
- 19. Background: How some cities ‘flattened the curve’ during the 1918 flu pandemic. National Geographic September 2020 Edition (Digital). III. Types of Epidemic Pattern 1. Common-source epidemics: A. Point-source: Example: Leukemia after the atomic bomb blast in Hiroshima, Japan Graph follows a “Log-Normal” epidemic curve pattern (steep upslope, gradual downslope) Shape: PLATEAU Source: Dr. Shinya Matsuura Director, Research Institute for Radiation Biology and Medicine, Hiroshima University
- 20. Background: How some cities ‘flattened the curve’ during the 1918 flu pandemic. National Geographic September 2020 Edition (Digital). Date Confirmed Cases III. Types of Epidemic Pattern 1. Common-source epidemics: B. Continuous common-source: Cases do not all occur within a single incubation period. Epidemic curve downslope can be: Very sharp: if the common source is removed or; Gradual: if the epidemic is allowed to exhaust itself. Example: Cholera Shape: PLATEAU Common source is removed
- 21. Background: How some cities ‘flattened the curve’ during the 1918 flu pandemic. National Geographic September 2020 Edition (Digital). III. Types of Epidemic Pattern 1. Common-source epidemics: C. Intermittent common-source: It has a pattern reflecting the intermittent nature of the exposure. Epi curve shows an irregular pattern of cases. Date Confirmed Cases
- 22. Background: How some cities ‘flattened the curve’ during the 1918 flu pandemic. National Geographic September 2020 Edition (Digital). III. Types of Epidemic Pattern 2. Propagated epidemics: Transmission of an infectious agent from susceptible host to another. Direct person to person (ex: STIs) Vehicle-borne (ex: Hepatitis C via needles Vector-borne (malaria) Index case – first case in a community Cases occur over more than one incubation period Shape: Bell-shaped
- 23. Background: How some cities ‘flattened the curve’ during the 1918 flu pandemic. National Geographic September 2020 Edition (Digital). III. Types of Epidemic Pattern 3. Mixed pattern: Starts with a continuing common- source exposure. Followed by secondary propagated exposure (person- to-person). Cases DO NOT develop within one incubation period. Shape - PLATEAU Date Confirmed Cases
- 24. Background: How some cities ‘flattened the curve’ during the 1918 flu pandemic. National Geographic September 2020 Edition (Digital). IV. Steps in Investigating Epidemics
- 25. Background: How some cities ‘flattened the curve’ during the 1918 flu pandemic. National Geographic September 2020 Edition (Digital). IV. Steps in Investigating Epidemics 1. Verify the diagnosis 2. Confirm the existence of an epidemic 3. Characterize the epidemic as to person- place-time 4. Identify the etiologic agent and mode of transmission 5. Identify the population at risk and institute control measures
- 26. Background: How some cities ‘flattened the curve’ during the 1918 flu pandemic. National Geographic September 2020 Edition (Digital). IV. Steps in Investigating Epidemics 1. Verify the diagnosis 2. Confirm the existence of an epidemic 3. Characterize the epidemic as to person- place-time 4. Identify the etiologic agent and mode of transmission 5. Identify the population at risk and institute control measures QUESTION: What is the disease condition? TOOL: CASE DEFINITION • Standard set of criteria for deciding if a person is to be classified as having the disease or not. • Not the same as a CLINICAL DIAGNOSIS ACTIVITIES: • History, PE, Laboratory tests • Compare with case definition Step 1 is considered COMPLETED when the diagnosis has been established (reported cases = TRUE cases).
- 27. Background: How some cities ‘flattened the curve’ during the 1918 flu pandemic. National Geographic September 2020 Edition (Digital). IV. Steps in Investigating Epidemics 1. Verify the diagnosis 2. Confirm the existence of an epidemic 3. Characterize the epidemic as to person- place-time 4. Identify the etiologic agent and mode of transmission 5. Identify the population at risk and institute control measures QUESTION: Is there an epidemic? TOOL: HISTOGRAM or LINE GRAPH Used to show a TREND OVER TIME • 𝑋-axis = time • 𝑌-axis = number of cases ACTIVITIES: • Count the cases • Compare with usual occurrence (baseline) • Determine if current incidence is in excess of the usual
- 28. Background: How some cities ‘flattened the curve’ during the 1918 flu pandemic. National Geographic September 2020 Edition (Digital). IV. Steps in Investigating Epidemics 1. Verify the diagnosis 2. Confirm the existence of an epidemic 3. Characterize the epidemic as to person- place-time 4. Identify the etiologic agent and mode of transmission 5. Identify the population at risk and institute control measures Sources Of Data: 1. Morbidity reports 2. Mortality reports 3. Hospital discharge records 4. Interview of doctors/nurses 5. Electronic Health Records Determine the usual frequency of disease • In the same area • Among a specified population • At the same season of the year
- 29. Background: How some cities ‘flattened the curve’ during the 1918 flu pandemic. National Geographic September 2020 Edition (Digital). IV. Steps in Investigating Epidemics 1. Verify the diagnosis 2. Confirm the existence of an epidemic 3. Characterize the epidemic as to person- place-time 4. Identify the etiologic agent and mode of transmission 5. Identify the population at risk and institute control measures Example: • 200 Leptospirosis cases in Province X and Y • Date observed: January, 2019 0 50 100 150 200 250 Jan-15 Jan-16 Jan-17 Jan-18 Jan-19 Dengue Cases in Province X and Y, Jan 2015-2019 Province X Province Y No Epidemic Epidemic
- 30. Background: How some cities ‘flattened the curve’ during the 1918 flu pandemic. National Geographic September 2020 Edition (Digital). IV. Steps in Investigating Epidemics 1. Verify the diagnosis 2. Confirm the existence of an epidemic 3. Characterize the epidemic as to person- place-time 4. Identify the etiologic agent and mode of transmission 5. Identify the population at risk and institute control measures Other explanations for a sudden increase in the number of cases: 1. Changes in case definition 2. Improvements in diagnostics 3. Changes in the population size 4. Increased interest 5. Data error 6. Corrected data error Step 2 is considered COMPLETED when it is confirmed that the current incidence is MARKEDLY IN EXCESS OF THE USUAL.
- 31. Background: How some cities ‘flattened the curve’ during the 1918 flu pandemic. National Geographic September 2020 Edition (Digital). IV. Steps in Investigating Epidemics 1. Verify the diagnosis 2. Confirm the existence of an epidemic 3. Characterize the epidemic as to person- place-time 4. Identify the etiologic agent and mode of transmission 5. Identify the population at risk and institute control measures APPROACH: DESCRIPTIVE EPIDEMIOLOGY • Trend over time • The population affected by the disease • Geographic extent of the epidemic
- 32. Background: How some cities ‘flattened the curve’ during the 1918 flu pandemic. National Geographic September 2020 Edition (Digital). IV. Steps in Investigating Epidemics 1. Verify the diagnosis 2. Confirm the existence of an epidemic 3. Characterize the epidemic as to person- place-time 4. Identify the etiologic agent and mode of transmission 5. Identify the population at risk and institute control measures CHARACTERIZE AS TO TIME: QUESTIONS: • What is the exact period of the epidemic? • What is the type of epidemic? • When was the probable period of exposure? TOOL: EPIDEMIC TIME CURVE • A histogram-type of graph • 𝑋-axis = time of onset • 𝑌-axis = number of symptomatic cases Activities: • Determine the type of epidemic curve • Determine the probable period of exposure
- 33. Background: How some cities ‘flattened the curve’ during the 1918 flu pandemic. National Geographic September 2020 Edition (Digital). IV. Steps in Investigating Epidemics 1. Verify the diagnosis 2. Confirm the existence of an epidemic 3. Characterize the epidemic as to person- place-time 4. Identify the etiologic agent and mode of transmission 5. Identify the population at risk and institute control measures CHARACTERIZE AS TO TIME: Activities: 1. Determine the type of epidemic curve. • Explosive Curve
- 34. Background: How some cities ‘flattened the curve’ during the 1918 flu pandemic. National Geographic September 2020 Edition (Digital). IV. Steps in Investigating Epidemics 1. Verify the diagnosis 2. Confirm the existence of an epidemic 3. Characterize the epidemic as to person- place-time 4. Identify the etiologic agent and mode of transmission 5. Identify the population at risk and institute control measures CHARACTERIZE AS TO TIME: Activities: 1. Determine the type of epidemic curve. • Explosive Curve • Bell- shaped Curve
- 35. Background: How some cities ‘flattened the curve’ during the 1918 flu pandemic. National Geographic September 2020 Edition (Digital). IV. Steps in Investigating Epidemics 1. Verify the diagnosis 2. Confirm the existence of an epidemic 3. Characterize the epidemic as to person- place-time 4. Identify the etiologic agent and mode of transmission 5. Identify the population at risk and institute control measures CHARACTERIZE AS TO TIME: Activities: 1. Determine the type of epidemic curve. • Explosive Curve • Bell- shaped Curve • Plateau
- 36. Background: How some cities ‘flattened the curve’ during the 1918 flu pandemic. National Geographic September 2020 Edition (Digital). IV. Steps in Investigating Epidemics 1. Verify the diagnosis 2. Confirm the existence of an epidemic 3. Characterize the epidemic as to person- place-time 4. Identify the etiologic agent and mode of transmission 5. Identify the population at risk and institute control measures CHARACTERIZE AS TO TIME: Activities: 2. Determine the probable period of exposure: • METHOD 1: Mean incubation period • METHOD 2: Minimum-maximum incubation period
- 37. Background: How some cities ‘flattened the curve’ during the 1918 flu pandemic. National Geographic September 2020 Edition (Digital). IV. Steps in Investigating Epidemics 1. Verify the diagnosis 2. Confirm the existence of an epidemic 3. Characterize the epidemic as to person- place-time 4. Identify the etiologic agent and mode of transmission 5. Identify the population at risk and institute control measures CHARACTERIZE AS TO TIME:
- 38. Background: How some cities ‘flattened the curve’ during the 1918 flu pandemic. National Geographic September 2020 Edition (Digital). IV. Steps in Investigating Epidemics 1. Verify the diagnosis 2. Confirm the existence of an epidemic 3. Characterize the epidemic as to person- place-time 4. Identify the etiologic agent and mode of transmission 5. Identify the population at risk and institute control measures CHARACTERIZE AS TO TIME:
- 39. Background: How some cities ‘flattened the curve’ during the 1918 flu pandemic. National Geographic September 2020 Edition (Digital). IV. Steps in Investigating Epidemics 1. Verify the diagnosis 2. Confirm the existence of an epidemic 3. Characterize the epidemic as to person- place-time 4. Identify the etiologic agent and mode of transmission 5. Identify the population at risk and institute control measures CHARACTERIZE AS TO PERSON: QUESTIONS: 1. What are the age- and sex- specific attack rates? 2. What age and sex groups are at the highest and lowest risk of illness? 3. In what other ways do cases differ from the non-cases? TOOL: ATTACK RATE
- 40. Background: How some cities ‘flattened the curve’ during the 1918 flu pandemic. National Geographic September 2020 Edition (Digital). IV. Steps in Investigating Epidemics 1. Verify the diagnosis 2. Confirm the existence of an epidemic 3. Characterize the epidemic as to person- place-time 4. Identify the etiologic agent and mode of transmission 5. Identify the population at risk and institute control measures CHARACTERIZE AS TO PERSON: TOOL: ATTACK RATE ݇ܿܽݐݐܣ ܴܽ݁ݐ = ܰݎܾ݁݉ݑ ݂ ܰ݁ݓ ݏ݁ݏܽܥ ܲ݊݅ݐ݈ܽݑ ܽݐ ܴ݅݇ݏ ݎ ݀݁ݏݔܧ ݐ ܽ݊ ܱ݇ܽ݁ݎܾݐݑ Activities: 1. Determine the age- and sex- specific attack rates 2. Determine specific attack rates for other characteristics
- 41. Background: How some cities ‘flattened the curve’ during the 1918 flu pandemic. National Geographic September 2020 Edition (Digital). IV. Steps in Investigating Epidemics 1. Verify the diagnosis 2. Confirm the existence of an epidemic 3. Characterize the epidemic as to person- place-time 4. Identify the etiologic agent and mode of transmission 5. Identify the population at risk and institute control measures CHARACTERIZE AS TO PERSON:
- 42. Background: How some cities ‘flattened the curve’ during the 1918 flu pandemic. National Geographic September 2020 Edition (Digital). IV. Steps in Investigating Epidemics 1. Verify the diagnosis 2. Confirm the existence of an epidemic 3. Characterize the epidemic as to person- place-time 4. Identify the etiologic agent and mode of transmission 5. Identify the population at risk and institute control measures CHARACTERIZE AS TO PERSON:
- 43. Background: How some cities ‘flattened the curve’ during the 1918 flu pandemic. National Geographic September 2020 Edition (Digital). IV. Steps in Investigating Epidemics 1. Verify the diagnosis 2. Confirm the existence of an epidemic 3. Characterize the epidemic as to person- place-time 4. Identify the etiologic agent and mode of transmission 5. Identify the population at risk and institute control measures CHARACTERIZE AS TO PERSON: Activities: 1. Determine the age- and sex- specific attack rates 2. Determine specific attack rates for other characteristics • Race • Occupation • Behavior • Socio-economic status, etc.
- 44. Background: How some cities ‘flattened the curve’ during the 1918 flu pandemic. National Geographic September 2020 Edition (Digital). IV. Steps in Investigating Epidemics 1. Verify the diagnosis 2. Confirm the existence of an epidemic 3. Characterize the epidemic as to person- place-time 4. Identify the etiologic agent and mode of transmission 5. Identify the population at risk and institute control measures CHARACTERIZE AS TO PLACE: QUESTIONS: 1. What is the area- specific attack rate? 2. What is the most significant geographic distribution of cases? TOOLS: 1. Attack rate 2. Spot map
- 45. Background: How some cities ‘flattened the curve’ during the 1918 flu pandemic. National Geographic September 2020 Edition (Digital). IV. Steps in Investigating Epidemics 1. Verify the diagnosis 2. Confirm the existence of an epidemic 3. Characterize the epidemic as to person- place-time 4. Identify the etiologic agent and mode of transmission 5. Identify the population at risk and institute control measures CHARACTERIZE AS TO PLACE: ACTIVITIES: 1. Determine where cases live, work or may have been exposed 2. Determine area- specific attack rates 3. Observe for CLUSTERING AND PATTERNS
- 46. Background: How some cities ‘flattened the curve’ during the 1918 flu pandemic. National Geographic September 2020 Edition (Digital). IV. Steps in Investigating Epidemics 1. Verify the diagnosis 2. Confirm the existence of an epidemic 3. Characterize the epidemic as to person- place-time 4. Identify the etiologic agent and mode of transmission 5. Identify the population at risk and institute control measures CHARACTERIZE AS TO PLACE:
- 47. Background: How some cities ‘flattened the curve’ during the 1918 flu pandemic. National Geographic September 2020 Edition (Digital). IV. Steps in Investigating Epidemics 1. Verify the diagnosis 2. Confirm the existence of an epidemic 3. Characterize the epidemic as to person- place-time 4. Identify the etiologic agent and mode of transmission 5. Identify the population at risk and institute control measures CHARACTERIZE AS TO PLACE: Step 3 is considered completed when the characteristics as to person- place- time provide a basis for the formulation of hypothesis.
- 48. Background: How some cities ‘flattened the curve’ during the 1918 flu pandemic. National Geographic September 2020 Edition (Digital). IV. Steps in Investigating Epidemics 1. Verify the diagnosis 2. Confirm the existence of an epidemic 3. Characterize the epidemic as to person- place-time 4. Identify the etiologic agent and mode of transmission 5. Identify the population at risk and institute control measures ANALYTIC EPIDEMIOLOGY: 1. Etiologic agent 2. Source of the agent 3. Period of exposure 4. Mode of transmission 5. Population at risk TOOLS: 1. Analytic studies 2. Retrospective cohort 3. Case Control ACTIVITY: Compute for the measure of association
- 49. Background: How some cities ‘flattened the curve’ during the 1918 flu pandemic. National Geographic September 2020 Edition (Digital). IV. Steps in Investigating Epidemics 1. Verify the diagnosis 2. Confirm the existence of an epidemic 3. Characterize the epidemic as to person- place-time 4. Identify the etiologic agent and mode of transmission 5. Identify the population at risk and institute control measures
- 50. Background: How some cities ‘flattened the curve’ during the 1918 flu pandemic. National Geographic September 2020 Edition (Digital). IV. Steps in Investigating Epidemics 1. Verify the diagnosis 2. Confirm the existence of an epidemic 3. Characterize the epidemic as to person- place-time 4. Identify the etiologic agent and mode of transmission 5. Identify the population at risk and institute control measures Step 4 is considered COMPLETED when sources and mode of transmission are identified.
- 51. Background: How some cities ‘flattened the curve’ during the 1918 flu pandemic. National Geographic September 2020 Edition (Digital). IV. Steps in Investigating Epidemics 1. Verify the diagnosis 2. Confirm the existence of an epidemic 3. Characterize the epidemic as to person- place-time 4. Identify the etiologic agent and mode of transmission 5. Identify the population at risk and institute control measures EPIDEMIOLOGIC TRIAD Agent Host Environment
- 52. Background: How some cities ‘flattened the curve’ during the 1918 flu pandemic. National Geographic September 2020 Edition (Digital). IV. Steps in Investigating Epidemics 1. Verify the diagnosis 2. Confirm the existence of an epidemic 3. Characterize the epidemic as to person- place-time 4. Identify the etiologic agent and mode of transmission 5. Identify the population at risk and institute control measures EPIDEMIOLOGIC TRIAD Environment Agent Host
- 53. Background: How some cities ‘flattened the curve’ during the 1918 flu pandemic. National Geographic September 2020 Edition (Digital). IV. Steps in Investigating Epidemics 1. Verify the diagnosis 2. Confirm the existence of an epidemic 3. Characterize the epidemic as to person- place-time 4. Identify the etiologic agent and mode of transmission 5. Identify the population at risk and institute control measures CONTROL MEASURES 1. Control the source of the pathogen (example: improved sanitation) 2. Interrupt the transmission of the disease (example: isolation/ quarantine, contact tracing) 3. Control or modify the host response to exposure (example: vaccination) Step 5 is considered COMPLETED when control measures have been initiated.
- 54. Background: How some cities ‘flattened the curve’ during the 1918 flu pandemic. National Geographic September 2020 Edition (Digital). References: • www.cdc.gov • Last. A Dictionary of Epidemiology, 4th ed. • National Geographic Magazine, September 2020 Issue. • Katz, et al. Jekel’s Epidemiology, Biostatistics, Preventive Medicine and Public Health, 5th ed. 2020 • Ben-Shlomo, et al. Epidemiology, Evidence-Based Medicine and Public Health Lecture Notes, 6th ed. 2013 • Carnate, J.M. Epidemic Investigation Lecture. 2015
Notes de l'éditeur
- One important role of public health practitioners is in terms of ensuring that any disease will not cause significant amount of death and disruption to the general population. So in this lecture, I am going to discuss the basics on epidemic investigation.
- At the the end of this lecture, you are expected to be capable of doing the following:
- Let us first discuss the levels of disease in epidemiology
- Now, the terms being shown in the screen might look familiar to you.
- In a setting wherein the expected cases are zero, or when the health system is dealing with a new disease, a single confirmed case is already considered an epidemic, and should not be ignored. This is also the reason why the PH failed in containing the COVID-19. our government should have acted on it when we got our first imported case from china.
- And while epidemics and outbreaks are sometimes used interchangeably, the fact is, these two are not exactly the same in terms of the affected geographical area.
- Clusters of cases can be a sign that an outbreak is starting to take place in an area. Clustering of cases in an area can also indicate a possible common origin of the disease in that area, like in the case of STI, cholera or dengue clustering, or a possible uninterrupted chain of transmission like in the case of measles, flu, or COVID-19. And clusters of vaccine-preventable illnesses is indicative of a low number of immunized people (particularly kids) in the affected place.
- Aside from COVID-19, we have other disease that are currently considered as pandemics. These include HIV, TB, and
- 1.Especially in new diseases like covid-19, we really need to know the full profile of the disease and the pathogen. 2. Control measures will revolve mostly on the information gathered from the 1st objective 3. And this will require multiple strategies, like multisource surveillance, contact tracing, large scale detection of cases, provisions for medicines or vaccines, and sometimes, even drastic measures like lockdowns.
- So in this illustration, the blue bar represents the incubation period. During this period, infected people are asymptomatic, so the disease is undetected. The problem here is, some diseases can be transmitted even during the incubation period.
- Example part – It is obvious that the exposure here is a one-time-big-time event (there is a single atomic bomb explosion in Hiroshima). This also means that all affected people got exposedto the radiation simultaneously.
- This epidemic pattern is often seen in foodborne diseases like typhoid fever. In this particular example, Salmonella typhi (the organism that causes typhoid) can be transmitted through contaminated water, which occurs in a continuous common-source pattern. Propagated pattern of transmission is observed when typhoid is transmitted via direct contact to a patient with poor hygienic practices, or by eating foods tainted with the pathogen.