Advances in AI-driven Image Recognition for Early Detection of Cancer
Keratinocyte selection plan
1. R&D Initiative Review
Core Area: Cell Banking
Project: Keratinocyte Selection Plan
Team Lead: Justin Gaines
RDI Purpose
Develop a Cell Selection Plan to Identify
Robust Cells Early in the Cell Banking
Process
Cross-Functional Contribution
RA, QC, QA, CB, PD
The Stage-Gate Process for Keratinocyte
Cells Increased G100 Hit Rate to 71%
Fibroblast Characterization Identified
Keratinocyte Strain Differences for DE
Weight and Total Number of Viable
Fibroblast Cells
RDI Conclusions
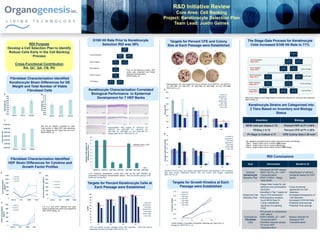
Incoming
Tissue
179
Operations
119/179 =
67%
Pass
76/119 = 64%
MCB
33/76 = 43%
WCB-A
33
G100 Pass
13/33 = 39%
G100 Fail
20/33 = 61%
Fail
43/119 = 36%
R&D/PD
60/179 = 33%
Tissue Disposition
Donor Eligibility
MCB Selection
WCB-A Creation
G100 Status
Incoming Tissue
179
Operations
119/179 = 67%
Pass
76/119 = 64%
Tier 1
9/76 = 12%
WCB-A
7/9 = 78%
G100 Pass
5/7 = 71%
G100 Fail
2/7 = 29%
Tier 2
24/76 = 32%
WCB-A
23/24 = 96%
G100 Pass
8/23 = 35%
G100 Fail
15/23 = 65%
Tier 3
43/76 = 57%
Fail
43/119 = 36%
R&D/PD
60/179 = 33%
Tissue Disposition
Stage Gate 1
Donor Eligibility
Stage Gate 2
MCB Prioritization
Stage Gate 3
WCB-A Selection
Stage Gate 4
G100 Status
Stage Gate 5
G100 Hit Rate
Tier Hit Rate
Donor Hit Rate
WCB-A Hit Rate
0
10
20
30
40
50
60
70
80
90
100
HEP071E HEP071F HEP135D HEP167C HEP146B HEP128B HEP116B
AverageG100Epidermal
DevelopmentScore
0%
10%
20%
30%
40%
50%
60%
p2 p3 p4
PercentCFE
HEP071E
HEP071F
HEP135D
HEP167C
HEP146B
HEP128B
HEP116B
0
10
20
30
40
50
60
70
p2 p3 p4
AverageColonySize(mm2)
HEP071E
HEP071F
HEP135D
HEP167C
HEP146B
HEP128B
HEP116B
0.00
1.00
2.00
3.00
4.00
5.00
6.00
7.00
8.00
HDF072 HDF167 HDF256
WetWeight(g)
0.00
0.02
0.04
0.06
0.08
0.10
0.12
0.14
0.16
0.18
HDF072 HDF167 HDF256
DryWeight(g)
0.00E+00
1.00E+06
2.00E+06
3.00E+06
4.00E+06
5.00E+06
6.00E+06
HDF072 HDF167 HDF256
ViableHDFCells
0
500
1000
1500
2000
2500
Spinner Cast mSBM Maint
VEGFConcentration
(pg/mL)
HDF072
HDF167
HDF256
0
500
1000
1500
2000
2500
3000
Spinner Cast mSBM Maint
IL6Concentration(pg/mL)
HDF072
HDF167
HDF256
0
2000
4000
6000
8000
10000
12000
Spinner Cast mSBM Maint
IL8Concentration
(pg/mL)
HDF072
HDF167
HDF256
Representative H&E images for HEP071E (A),
HEP071F (B), HEP135D (C), HEP167C (D),
HEP146B (E), HEP128B (F), and HEP116B (G).
Images taken at 20x. RDR110211A_JG
BA
D
C
G
F
E
G100 Epidermal development scores were used as the gold standard as
comparison to biological characterization assays. Red bar denotes passing G100
Epidermal Development.
FCM Cell Identity at each passage during HEP expansion. Red lines denote
established Percent HEP target. RDR110211A_JG
Representative CFE dish images from the p3 harvest of (A) HEP071E, (B) HEP071F,
(C) HEP135D, (D) HEP167C, (E) HEP116B, (F) HEP128B, and (G) HEP146B.
RDR110211A_JG
Growth kinetics (Cumulative Population Doublings per Day) from p1
through p4. RDR110211A_JG
Percent CFE and Colony Size targets were determined for each passage of HEP expansion.
Red lines denote established Percent CFE and Colony Size targets, respectively.
RDR110211A_JG
A
B
Inventory Biology
MCB vials per tissue ≥ 15 Percent HEP at P1 ≥ 60%
PD/Day ≥ 0.18 Percent CFE at P1 ≥ 20%
P1 Days in Culture ≤ 11 CFE Colony Size ≥ 20 mm2
Wet and dry weights calculated by CEM.
Total number of viable HDF cells performed
by DE digestions and Trypan blue cell count.
RDR110509A_JG
A B
C
A B
C
BA C D
GF
E
IL-6, IL-8, and VEGF detected from spent
media at specific time points and assayed by
CBA. RDR110509A_JG
Prior to Cell Selection process, HEP
banks were expanded with limited
biological characterization.
RDR111005A_JG
Metrics are applied to each Stage-Gate for a Go/No-Go Decision for continued HEP expansion.
RDR111005A_JG
Tier categories are determined by target criteria for Inventory and Biology.
•Tier 1 – Target Criteria met for Inventory AND Biology
•Tier 2 – Target Criteria met for Inventory OR Biology
•Tier 3 – Target Criteria met for neither Inventory NOR Biology
Passing G100: ≥ 70%
0
10
20
30
40
50
60
70
80
90
100
P1 P2 P3 P4
%HEP
HEP071E
HEP071F
HEP135D
HEP167C
HEP146B
HEP128B
HEP116B
Fibroblast Characterization Identified
HDF Strain Differences for Cytokine and
Growth Factor Profiles
G100 Hit Rate Prior to Keratinocyte
Selection RDI was 39%
Keratinocyte Characterization Correlated
Biological Performance to Epidermal
Development for 7 HEP Banks
Targets for Percent Keratinocyte Cells at
Each Passage were Established
Targets for Percent CFE and Colony
Size at Each Passage were Established
Targets for Growth Kinetics at Each
Passage were Established
Goal Deliverables Benefit to OI
Develop
Keratinocyte
Selection Plan
•Reviewed 28 HEP assays
•RDR110211A_JG – HEP
Characterization
•RDR111005A – Stage-
Gate Model
•Identification of relevant
biological assays for HEP
banks
Implement Cell
Selection Plan
•Stage-Gate model for cell
selection and prioritization
launched
•Identified 3 Tier 1 banks for
future FDA submission
•Retrospective analysis
found MCB Days In
Culture statistically
significant for passing
G100
•Cross-functional
agreement on Cell
Selection
•Increased transparency in
Cell Selection
•Increased G100 Hit Rate
•Potential Cost-savings
•Potential Time-savings
Characterize
Fibroblast
Cells
•RD studies to characterize
HDF strains
•RDR110509A_JG – HDF
Characterization
•Identified relevant assays
for future HDF
characterization
•Assays selected for
Biological HDF
Characterization
Keratinocyte Strains are Categorized into
3 Tiers Based on Inventory and Biology
Status
0.00
0.50
1.00
1.50
2.00
2.50
3.00
P1 P2 P3 P4
CumulativePD/Day
HEP071E
HEP071F
HEP135D
HEP167C
HEP146B
HEP128B
HEP116B