Detecting ancient admixture in humans using sequence polymorphism data (wall)
•
1 like•550 views

![1272 J. D. Wall
practice, they must be inferred from observed sequence
data. This inference is especially difficult when there is
intragenic recombination. I deal with the problem of
intragenic recombination by examining patterns that
are directly observable in sequence data. The model
assumes that there are data from many unlinked neutral
loci. Unlinked loci essentially provide independent runs
of the evolutionary process, because demographic his-
tory is expected to equally affect the whole genome.
Another advantage of considering multiple unlinked
loci is that we can minimize the confounding effect of
local selection.
I introduce ad hoc test statistics based on measures of
inferred linkage disequilibrium or inferred genealogical
tree shape, and I examine their powers to reject the
null model (of panmixia) when the actual demography
is as in Figure 1. More effective measures likely exist.
However, my goal was to construct reasonable upper
bounds for how much information (i.e., how many loci)
would be necessary to distinguish between various de-
mographic hypotheses. Full-likelihood methods were
not considered. Algorithms that include intragenic re-
combination have only been implemented for panmic-
tic models (e.g., Griffiths and Marjoram 1996), and
even these are not computationally feasible for the re-
combination rates considered here (results not shown).
An outline of the remainder of the article is as follows.
First, the model and test statistics are introduced. Then,
the test statistics are compared with each other, and
the best one is chosen for further simulations. These
simulations are parameterized to model Neanderthal-
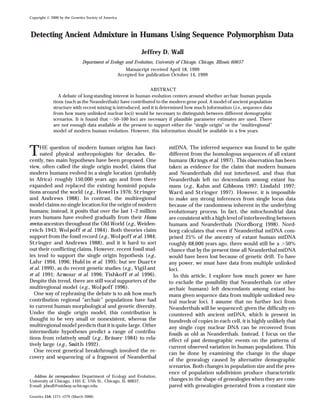
Figure 1.—A model of population subdivision. The popula- modern human admixture in Europe 30,000–45,000
tion is panmictic from time 0 to time T0 (going backward in
time). At time T0, lineages are separated into two isolated years ago (e.g., Mercier et al. 1991; Hublin et al. 1995,
subpopulations, in proportions c and 1 c. Then, at T1 and 1996) and more speculative admixture between modern
further back in time, the remaining lineages are randomly humans and H. erectus remnants in Southeast Asia (Rob-
mating. Throughout, a coalescent model with recombination erts et al. 1994; Swisher et al. 1996). Finally, shortcom-
is employed (cf. Hudson 1990). ings of the model are discussed, as are general issues
regarding demographic inference from current se-
quence data.
panmictic model (e.g., Takahata 1988; Tajima 1989a;
Slatkin and Hudson 1991; Marjoram and Donnelly
1994). For example, Nordborg (2000) proposes a MODEL AND TEST STATISTICS
model that could characterize Neanderthal admixture. To model archaic admixture, I use an infinite-sites
Consider two populations that diverged at time T1 in coalescent model with recombination (cf. Hudson
the past and remain completely isolated until time T0, 1983, 1990). I assume there is no selection and a con-
at which point they merge into a single panmictic popu- stant rate of recombination per base pair per genera-
lation in proportions c and 1 c (see Figure 1). The tion. Consider a panmictic population with diploid ef-
genealogy in Figure 1 differs from a panmictic one in fective population size N. Going backward in time,
that the amount of time when there are two ancestors suppose that at time T0 the remaining ancestors are
is much larger than its expectation under panmixia. placed randomly into one of two subpopulations with
Nordborg (2000) shows that under some extreme ad- probabilities c and 1 c. From time T0 to time T1, these
mixture scenarios, panmixia can be rejected because subpopulations are assumed to be completely isolated
this time is too long. from each other and panmictic with diploid effective
Nordborg notes that his results are not conservative population sizes of cN and N, respectively. [Replacing
(i.e., the power to reject panmixia with actual data is cN by N or N by (1 c)N did not change any of the
less than in his simulations). This is because he assumes results.] Then, at time T1, all remaining lineages are
that the genealogy and branch lengths are known. In placed into a single panmictic population with diploid](data:image/gif;base64,R0lGODlhAQABAIAAAAAAAP///yH5BAEAAAAALAAAAAABAAEAAAIBRAA7)
Recommended
More Related Content
What's hot
What's hot (20)
Viewers also liked
Viewers also liked (18)
Similar to Detecting ancient admixture in humans using sequence polymorphism data (wall)
Similar to Detecting ancient admixture in humans using sequence polymorphism data (wall) (20)
More from Kristian Pedersen
More from Kristian Pedersen (20)
Recently uploaded
Recently uploaded (20)
Detecting ancient admixture in humans using sequence polymorphism data (wall)
- 1. Copyright © 2000 by the Genetics Society of America Detecting Ancient Admixture in Humans Using Sequence Polymorphism Data Jeffrey D. Wall Department of Ecology and Evolution, University of Chicago, Chicago, Illinois 60637 Manuscript received April 18, 1999 Accepted for publication October 14, 1999 ABSTRACT A debate of long-standing interest in human evolution centers around whether archaic human popula- tions (such as the Neanderthals) have contributed to the modern gene pool. A model of ancient population structure with recent mixing is introduced, and it is determined how much information (i.e., sequence data from how many unlinked nuclear loci) would be necessary to distinguish between different demographic scenarios. It is found that 50–100 loci are necessary if plausible parameter estimates are used. There are not enough data available at the present to support either the “single origin” or the “multiregional” model of modern human evolution. However, this information should be available in a few years. T HE question of modern human origins has fasci- nated physical anthropologists for decades. Re- cently, two main hypotheses have been proposed. One mtDNA. The inferred sequence was found to be quite different from the homologous sequences of all extant humans (Krings et al. 1997). This observation has been view, often called the single origin model, claims that taken as evidence for the claim that modern humans modern humans evolved in a single location (probably and Neanderthals did not interbreed, and thus that in Africa) roughly 150,000 years ago and from there Neanderthals left no descendants among extant hu- expanded and replaced the existing hominid popula- mans (e.g., Kahn and Gibbons 1997; Lindahl 1997; tions around the world (e.g., Howells 1976; Stringer Ward and Stringer 1997). However, it is impossible and Andrews 1988). In contrast, the multiregional to make any strong inferences from single locus data model claims no single location for the origin of modern because of the randomness inherent in the underlying humans; instead, it posits that over the last 1–2 million evolutionary process. In fact, the mitochondrial data years humans have evolved gradually from their Homo are consistent with a high level of interbreeding between erectus ancestors throughout the Old World (e.g., Weiden- humans and Neanderthals (Nordborg 1998). Nord- reich 1943; Wolpoff et al. 1984). Both theories claim borg calculates that even if Neanderthal mtDNA com- support from the fossil record (e.g., Wolpoff et al. 1984; prised 25% of the ancestry of extant human mtDNA Stringer and Andrews 1988), and it is hard to sort roughly 68,000 years ago, there would still be a 50% out their conflicting claims. However, recent fossil stud- chance that by the present time all Neanderthal mtDNA ies tend to support the single origin hypothesis (e.g., would have been lost because of genetic drift. To have Lahr 1994, 1996; Hublin et al. 1995; but see Duarte any power, we must have data from multiple unlinked et al. 1999), as do recent genetic studies (e.g., Vigilant loci. et al. 1991; Armour et al. 1996; Tishkoff et al. 1996). In this article, I explore how much power we have Despite this trend, there are still vocal supporters of the to exclude the possibility that Neanderthals (or other multiregional model (e.g., Wolpoff 1996). archaic humans) left descendants among extant hu- One way of rephrasing the debate is to ask how much mans given sequence data from multiple unlinked neu- contribution regional “archaic” populations have had tral nuclear loci. I assume that no further loci from to current human morphological and genetic diversity. Neanderthals will be sequenced; given the difficulty en- Under the single origin model, this contribution is countered with ancient mtDNA, which is present in thought to be very small or nonexistent, whereas the hundreds of copies in each cell, it is highly unlikely that multiregional model predicts that it is quite large. Other any single copy nuclear DNA can be recovered from intermediate hypotheses predict a range of contribu- fossils as old as Neanderthals. Instead, I focus on the tions from relatively small (e.g., Brauer 1984) to rela- ¨ effect of past demographic events on the patterns of tively large (e.g., Smith 1992). current observed variation in human populations. This One recent genetical breakthrough involved the re- can be done by examining the change in the shape covery and sequencing of a fragment of Neanderthal of the genealogy caused by alternative demographic scenarios. Both changes in population size and the pres- ence of population subdivision produce characteristic Address for correspondence: Department of Ecology and Evolution, University of Chicago, 1101 E. 57th St., Chicago, IL 60637. changes in the shape of genealogies when they are com- E-mail: jdwall@midway.uchicago.edu pared with genealogies generated from a constant size Genetics 154: 1271–1279 (March 2000)
- 2. 1272 J. D. Wall practice, they must be inferred from observed sequence data. This inference is especially difficult when there is intragenic recombination. I deal with the problem of intragenic recombination by examining patterns that are directly observable in sequence data. The model assumes that there are data from many unlinked neutral loci. Unlinked loci essentially provide independent runs of the evolutionary process, because demographic his- tory is expected to equally affect the whole genome. Another advantage of considering multiple unlinked loci is that we can minimize the confounding effect of local selection. I introduce ad hoc test statistics based on measures of inferred linkage disequilibrium or inferred genealogical tree shape, and I examine their powers to reject the null model (of panmixia) when the actual demography is as in Figure 1. More effective measures likely exist. However, my goal was to construct reasonable upper bounds for how much information (i.e., how many loci) would be necessary to distinguish between various de- mographic hypotheses. Full-likelihood methods were not considered. Algorithms that include intragenic re- combination have only been implemented for panmic- tic models (e.g., Griffiths and Marjoram 1996), and even these are not computationally feasible for the re- combination rates considered here (results not shown). An outline of the remainder of the article is as follows. First, the model and test statistics are introduced. Then, the test statistics are compared with each other, and the best one is chosen for further simulations. These simulations are parameterized to model Neanderthal- Figure 1.—A model of population subdivision. The popula- modern human admixture in Europe 30,000–45,000 tion is panmictic from time 0 to time T0 (going backward in time). At time T0, lineages are separated into two isolated years ago (e.g., Mercier et al. 1991; Hublin et al. 1995, subpopulations, in proportions c and 1 c. Then, at T1 and 1996) and more speculative admixture between modern further back in time, the remaining lineages are randomly humans and H. erectus remnants in Southeast Asia (Rob- mating. Throughout, a coalescent model with recombination erts et al. 1994; Swisher et al. 1996). Finally, shortcom- is employed (cf. Hudson 1990). ings of the model are discussed, as are general issues regarding demographic inference from current se- quence data. panmictic model (e.g., Takahata 1988; Tajima 1989a; Slatkin and Hudson 1991; Marjoram and Donnelly 1994). For example, Nordborg (2000) proposes a MODEL AND TEST STATISTICS model that could characterize Neanderthal admixture. To model archaic admixture, I use an infinite-sites Consider two populations that diverged at time T1 in coalescent model with recombination (cf. Hudson the past and remain completely isolated until time T0, 1983, 1990). I assume there is no selection and a con- at which point they merge into a single panmictic popu- stant rate of recombination per base pair per genera- lation in proportions c and 1 c (see Figure 1). The tion. Consider a panmictic population with diploid ef- genealogy in Figure 1 differs from a panmictic one in fective population size N. Going backward in time, that the amount of time when there are two ancestors suppose that at time T0 the remaining ancestors are is much larger than its expectation under panmixia. placed randomly into one of two subpopulations with Nordborg (2000) shows that under some extreme ad- probabilities c and 1 c. From time T0 to time T1, these mixture scenarios, panmixia can be rejected because subpopulations are assumed to be completely isolated this time is too long. from each other and panmictic with diploid effective Nordborg notes that his results are not conservative population sizes of cN and N, respectively. [Replacing (i.e., the power to reject panmixia with actual data is cN by N or N by (1 c)N did not change any of the less than in his simulations). This is because he assumes results.] Then, at time T1, all remaining lineages are that the genealogy and branch lengths are known. In placed into a single panmictic population with diploid
- 3. Sequence Data and Human Origins 1273 effective population size N. All further coalescences oc- Neanderthal ancestry will also have on average higher cur in this panmictic population. The null model is c levels of polymorphism (due to longer genealogies) and 0, which yields constant-sized panmixia throughout time thus longer distances when measured by the number (i.e., no contribution of archaic populations to the mod- of intervening segregating sites. ern gene pool). T0 and T1 are scaled in units of 2N Nordborg (2000) uses the total time when there are generations. This model is similar to that proposed by exactly two ancestors as a test statistic. This is similar to Nordborg (2000), except that it includes intragenic using the longest branch length in the unrooted tree recombination. One possible problem with the model as a test statistic, because the longest branch is often is that the mixing event at time T0 is assumed to be the oldest one as well. (This correspondence is less instantaneous, whereas possible interbreeding between meaningful when recombination causes different sites modern and archaic human populations might have to have different genealogies.) As mentioned before, been spread over thousands of years. However, the in- tree topologies and branch lengths must be estimated stantaneous approximation is reasonable because few from the data. One measure with similar motivation is coalescent events are expected to occur during the time of contact and because only small values of c are consid- lb max {| A | A {1, 2, . . . S} ered. The data simulated using the above scheme are in and A is pairwise congruent}. the standard population genetic format of an ordered list of segregating sites. Call a pair of segregating sites congruent if the subset of the data consisting of the two lb is the maximum number of segregating sites that are sites contains only two different haplotypes. Congru- all congruent to each other. If there were no recombina- ence is a pairwise measure of linkage disequilibrium; it tion, lb would be an estimate of the number of mutations has been shown to be effective in detecting certain types on the longest branch. In practice, it is still useful even of population structure (Wall 1999). If T1 T0, then in the presence of intragenic recombination (see re- at time T0 there will be many sites that are fixed for sults). Another possible test statistic is the maximal alternative alleles in the two subpopulations. This will number of nucleotide differences between two sampled show up in data as a set of sites that is dispersed through- individuals, denoted by kmax. This statistic has been used out a locus and is pairwise congruent. (A set of sites is in estimating the time to the most recent common an- pairwise congruent if all possible pairs in the set are cestor (TMRCA) of a sample (e.g., Templeton 1993; Fu congruent.) Over time these associations will decay, but and Li 1997). The TMRCA is expected to be substantially they serve as the motivation for the following test statis- longer in scenarios such as depicted in Figure 1. tics. One final test statistic considered is Tajima’s (1989b) Label the segregating sites 1, 2, . . . , S in order, and D (denoted here by dt), a commonly used measure of suppose 1 i j S. Define the indicator variable the skew in the observed frequency spectrum. When c is small, mutations on the oldest branch will tend to 1 if i and j are congruent be at low frequency (assuming there is no outgroup), Ic (i, j) 0 otherwise. leading to a shift toward negative dt values. Because the multilocus likelihood calculations described below Consider the subset of the data consisting of the sites require discrete variables, each dt value was rounded i, i 1, . . . , j. If this subset has evidence of recombina- down to the nearest tenth. tion (by containing a pair of sites with | D | 1; cf. Suppose an alternative model Alt (c, T0, T1, , C) Hudson and Kaplan 1985), then set Ir(i, j) 1. Other- is specified. (Here 4N is the population mutation wise, define Ir(i, j) 0. Now, let parameter and C 4Nr is the population recombination S 1 S parameter.) It is compared with a null model Null g Ic (i, j) (c 0, T0, T1, , C). The ’s for the two models are i 1 j i 1 S 1 S chosen so that the average pairwise divergences ( ; cf. gr Ic (i, j) Ir (i, j) Tajima 1983) for the simulated data sets have roughly i 1 j i 1 equal expectation. Furthermore, we assume that gd max {| i j | Ic (i, j) 1}. C for each model. (This assumption is relaxed in the discussion.) Recent high-resolution linkage maps (e.g., g is the number of pairs of sites that are congruent, gr Bouffard et al. 1997; Nagaraja et al. 1997) and studies is the number of pairs of sites that are both congruent of human genetic variation (e.g., Harding et al. 1997; and have evidence of recombination between them, and Zietkiewicz et al. 1997; Nickerson et al. 1998; Harris gd is the maximal distance (measured in segregating and Hey 1999) suggest that this is a reasonable approxi- sites) between any two congruent sites. For gd, a distance mation. Note that the actual values of T0 and T1 are measure based on the number of intervening base pairs irrelevant for the null model. should be no more effective; those areas containing We can estimate the distribution of the seven test
- 4. 1274 J. D. Wall statistics by simulation. A statistic will be effective when its distribution under the alternative model of archaic admixture is noticeably different from its distribution under the null model of equilibrium panmixia. For any value of k, set PrNull (g k) as the probability that g k if the null model is simulated. (PrAlt is defined similarly.) This probability can be estimated from the proportion of simulated trials where g k. In general, 106 trials were considered sufficient for each combination of pa- rameter values. Now, suppose that data is available from x independent loci, each simulated according to either the null model or the alternative model. Define g(j) the value of g from the jth locus, and x PrNull (g g(j)) G . Figure 2.—Power vs. the number of loci for all six test J 1 PrAlt (g g(j)) statistics. Here C 10, n 50, c 0.1, T0 0.1, and T1 1.0. ( ) Gr, ( ) Lb, ( ) G, (X) Gd, (*) Kmax, G is akin to a likelihood ratio and is used as a one- ( ) Dt. tailed test statistic. An empirical distribution for G is determined from 105 simulations of the null model. Then, the power to reject the null model (at the 5% The most powerful test statistic (Gr) was chosen for level) is determined from 105 simulations under the more extensive simulations that sought to determine alternative model. G values that are too low are rejected. how much information (i.e., how many loci) would be Gr, Gq, etc., are all defined analogously. required to distinguish between plausible human demo- graphic scenarios. The results are described first for possible Neanderthal admixture in Europe and second RESULTS for possible H. erectus admixture in Southeast Asia. Preliminary simulations were run to estimate the opti- Recent archaeological evidence suggests that modern mal sample size, locus size, and test statistic. It was as- humans first entered Europe roughly 45,000 years ago, sumed that there is a constant per base pair cost for and that remnant Neanderthal populations remained sequencing; under the constraint of a fixed total cost, until 25,000–30,000 years ago (e.g., Mercier et al. it was determined what combination of n, , number of 1991; Hublin et al. 1995, 1996; Lahr 1996; Duarte et loci, and test statistic led to maximal power to reject al. 1999). Making the same approximations of N 104 the null model. These simulations were meant to be and a generation time of 20 years yields the estimate exploratory, not exhaustive. They suggest that the opti- T0 0.07–0.11. It is more difficult to make a reasonable mal configuration has a relatively small sample size (n guess for T1. This is due to both the multiple interpreta- 20) and a relatively large locus size ( 10), and that tions of the fossil record and the fact that genetic isola- power is maximized using Gr (results not shown). All tion might be only loosely correlated with morphologi- further simulations fixed 10 and n 50. This corre- cal divergence. Foley and Lahr (1997) suggest that sponds to roughly 8–10 kb of sequence. The larger than the divergence may be relatively recent (i.e., roughly optimal sample size was taken to conform more closely 250,000 years ago), while others have postulated that it to the large sample sizes considered in most recent is far older (e.g., Carbonell et al. 1995; Hublin 1998). studies of human genetic variation (e.g., Harding et al. I simulated T1 values from 0.6 to 2.0 (increment 0.2), 1997; Zietkiewicz et al. 1997; Nickerson et al. 1998). which cover the whole range of possibilities. Also, T0 As an illustration, Figure 2 shows the power (in percent- values from 0.06 to 0.2 (increment 0.02) were consid- age) vs. the number of loci for all six test statistics. The ered. Results are shown in Figures 3 and 4. Figure 3 has other parameters are c 0.1, T0 0.1, and T1 1.0. c 0.1 while Figure 4 has c 0.02. For both, the first If we make the standard assumptions of N 104 and a graph shows the power to reject the null model when generation time of 20 years, then T0 is 40,000 years ago there are 60 loci, and the second shows the power when and T1 is 400,000 years ago. Gr, Lb, and G are all reason- 250 loci are considered. Not surprisingly, more extreme ably powerful with 40 or more loci, while the others subdivision (i.e., smaller T0 values or larger T1 values) remain weak even when a large number of loci are leads to greater power. For the genealogy of a given site considered. Gr is slightly more powerful than G because to look like Figure 1, at least one lineage must be present it weights those congruent pairs that are “far” (as mea- in both subpopulations. For the parameters considered sured by evidence of recombination) over those that here (i.e., c 1 and many expected ancestors at time are “near.” The former are much more unusual under T0), representation in the nonarchaic subpopulation is the panmictic equilibrium null model. certain. So, a site’s genealogy will appear as in Figure
- 5. Sequence Data and Human Origins 1275 Figure 3.—Power as a function of T0 and T1. The other Figure 4.—Power as a function of T0 and T1. The other parameters are C 10, n 50, and c 0.1. (a) Power parameters are C 10, n 50, and c 0.02. (a) Power with 60 independent loci; (b) power with 250 loci. with 60 independent loci; (b) power with 250 loci. 1 if and only if it contains archaic ancestry. Higher values the null model might require on the order of hundreds of c lead to a greater proportion of sites having archaic of loci. ancestry and hence greater power. These same qualita- With the recent claim that H. erectus survived on Java tive results were noted by Nordborg (2000). The proba- until just 25,000 years ago (Swisher et al. 1996), there bility that a given site has archaic ancestry depends on has arisen the intriguing possibility that H. erectus and both c and the number of ancestors present at time T0. modern humans might have been contemporaneous in As T0 increases, there are fewer expected ancestors at Southeast Asia. Modern humans first colonized Austra- time T0 and thus a smaller probability of a particular lia 60,000 years ago (Roberts et al. 1994), and due site having archaic ancestry and less power to reject the to geographical constraints they must have at least tem- null model. Alternatively, as T1 increases, those sites with porarily occupied Southeast Asia. This time of possible archaic ancestry will have a longer oldest branch; this contact corresponds to T0 values of 0.06–0.15 or more. will lead to more segregating sites in strong linkage H. erectus first colonized East Asia almost 2 mya (e.g., disequilibrium with each other and greater power to Swisher et al. 1994; Huang et al. 1995), and the marked reject the null model. Figure 3a shows that 60 loci are morphological conservatism in the Southeast Asian H. sufficient to distinguish between high levels of Neander- erectus fossil record is suggestive of a high degree of thal admixture and panmixia in most situations, whereas genetic isolation. The 1.6–1.8 mya dates of Swisher et Figure 4a suggests that the power to detect lower (possi- al. (1994) suggest an upper bound for T1 of 4.0–4.5. bly more realistic) levels of admixture depends much Figure 5 shows the results of power simulations where more on specific parameter assumptions. In particular, T0 varies from 0.06 to 0.20 (increment 0.02) and T1 if Neanderthals were genetically isolated only recently varies from 1.0 to 5.0 (increment 0.5). To reflect the (cf. Foley and Lahr 1997), then high power to reject knowledge that any contribution of H. erectus to the
- 6. 1276 J. D. Wall as few as a dozen loci might be sufficient for extreme demographic scenarios, it seems that 60 or more loci would be necessary if parameter values are close to our best guesses for them. Furthermore, some demographic scenarios will be impossible to distinguish from equilib- rium panmixia even if the entire genome is sequenced in every living human. If the contact between archaic and modern populations happened too far in the past (i.e., if T0 is too large) and/or the archaic contribution was too small (i.e., if c is too small), then genetic drift in the intervening years could easily obscure whatever pattern there once was. One conclusion is that genetic sequence data can never exclusively support a single origin model with complete replacement, because very low levels of hybridization with the local archaic popula- tions (thus very few sites with archaic ancestry) can never be ruled out. Another is that there is not enough human sequence information available at the present for us to make any real demographic inferences. As of July 1999, there are only four published nuclear data sets of reason- able size (i.e., n 10 and 5) for which haplotype information is available (Lpl, Nickerson et al. 1998; Pdha1, Harris and Hey 1999; Xq13.3, Kaessmann et al. 1999; ACE, Rieder et al. 1999; I exclude MHC loci, which are known to be under strong diversifying selection). Sufficient data will probably be collected in the next 5–10 years, and until then it is probably most appro- priate to take an agnostic attitude toward the debate on whether archaic populations have contributed to the modern human gene pool. Even though very low values of c (e.g., c 0.001) Figure 5.—Power as a function of T0 and T1. The other might be impossible to distinguish from c 0 by the parameters are C 10, n 50, and c 0.005. (a) Power with 60 independent loci; (b) power with 250 loci. methods described here, they could still produce pat- terns in the data that would be highly suggestive of population structure. Lower c values imply a higher modern gene pool is likely to be minor, a low value of proportion of sites that conform to an equilibrium pan- c (c 0.005) was assumed. Figure 5a shows power with mictic model because they have no archaic ancestors. 60 loci, while Figure 5b shows power with 250 loci. However, conditional on a given site containing archaic If H. erectus were isolated for most of its existence in ancestry, the expected length of sequence sharing this Southeast Asia (e.g., T1 3 or more), then there would ancestry is quite large. For example, when T0 0.1 and be reasonable power with 60 loci and very high power n 50, the expected length is roughly the distance over with 250 loci even when T0 is large; those loci with which C 30 (i.e., 20–30 kb; results not shown). Also, archaic ancestry would appear extremely unusual, and the expected frequency of archaic variants (conditional this would more than counteract the low value of c. on their existence) is roughly one over the expected However, if there had been intermittent gene flow then number of ancestors at time T0 ( 7% when T0 0.1), lower values of T1 would be appropriate; if so, there so is not vanishingly small (results not shown). If T1 is would be reduced power, because the vast majority of large (e.g., T1 3 in the case of Southeast Asian H. sites with no archaic ancestry would swamp out the pat- erectus ancestry), then areas of the genome with archaic tern from other sites. ancestry would contain an unusually large number of reasonably rare segregating sites in high linkage disequi- librium with each other. These sites would not be tightly DISCUSSION bunched, but would be dispersed over several kilobases Figures 3–5 show that the number of loci needed to of sequence. have reasonable power to reject the null model is quite I have focused on the power to reject c 0 when the sensitive to assumptions about when and how long the actual situation is c 0. It would be just as easy to use archaic population was isolated and how much of a multilocus data to come up with a point estimate of c (i.e., contribution it made to the modern gene pool. So, while an estimate of what proportion of our genome came from
- 7. Sequence Data and Human Origins 1277 archaic human populations). Suppose M(c) (c, T0, T1, Panmixia: The human population is not panmictic. , C) is a class of models where all but the first parameter Genetic studies have consistently found differences be- are fixed, and gr(j) is the value of gr from the j th locus. tween regional populations (e.g., Vigilant et al. 1991; Then one could estimate c by taking the value of c that Cavalli-Sforza et al. 1994; Harding et al. 1997; Harris maximizes lj 1PrM(c) (gr gr (j)). This method of using and Hey 1999). In general, any form of geographic maximum likelihood on summary statistics has been subdivision tends to produce an excess of linkage dis- used in other situations (e.g., Fu and Li 1997; Weiss equilibrium between alleles and could lead to spurious and von Haeseler 1998). It will be informative to exam- rejection of the null model (i.e., the null assumption ine the likelihood curve for c when more real data are of panmixia in the modern human population is not available. conservative with respect to underlying population The model considered in this article is somewhat sim- structure). This problem might be avoided if a suitable plistic; it assumes that modern humans (and most of model of geographic subdivision could be used as the their direct ancestors) form a constant-sized panmictic null model. For example, an island model could be population, that the archaic population is formed and considered with migration rates determined from ob- dissolved instantaneously, and that the archaic popula- served Fst values between populations. Under an island tion is completely isolated for the duration of its exis- model, the archaic contribution to the modern gene tence. Some of these assumptions are known to be false. pool would likely be geographically localized. The actual Below I discuss some possible shortcomings of the population structure in humans is probably quite com- model assumptions and how more realistic models plex, and it remains to be shown whether simple models would change the general conclusions reached here. (e.g., island models) are appropriate substitutes. Complete isolation of the archaic population: It has Uncertainty in C: This uncertainty can take two forms. been suggested that multiple dispersal events might be a First, the ratio C/ may be greater than one. As this common pattern in human evolution (Lahr and Foley ratio increases, there will be less linkage disequilibrium 1994; Lahr 1996). Also, the multiregional model posits and less correlation in the genealogies of nearby segre- low levels of gene flow between all hominid populations gating sites and thus less useful information for making (e.g., Wolpoff et al. 1984). One way of incorporating demographic inferences. However, as long as C is known this into the model is to include a (presumably low) (so we can condition on how much linkage disequilib- migration rate between the two subpopulations. Be- rium is expected), there is no loss of power. For exam- cause migration has a homogenizing effect, increasing ple, if Figure 3a is rerun with C 20 (instead of C the migration rate leads to a less extreme subdivision 10) everywhere, the power to reject the null model is model and less power to reject the null model. Scenarios essentially unchanged (results not shown). that include a reasonable amount of migration are diffi- A more serious concern is that regional variation in cult to distinguish from the null model because they recombination rates might cause C to be different for are in actuality very similar to panmictic models. each locus. If so, the test statistics described here could Constant population size: The recent population ex- be used only if C could be measured accurately for each plosion highlights the fact that human population sizes locus. This would require linkage maps with 10-fold have changed over time. Some researchers have postu- finer resolution than Bouffard et al. (1997) and Naga- lated that human population sizes were small in the raja et al. (1997), because current methods of estimat- distant past and then started to grow rapidly during the ing C from extant sequence data (e.g., Hudson 1987; upper Paleolithic (e.g., Rogers 1995; Stiner et al. 1999). Griffiths and Marjoram 1996; Hey and Wakeley This has been modeled by constant size followed by 1997) are all biased and have large variances (results exponential growth (e.g., Marjoram and Donnelly not shown). One possible solution would be to choose 1994). One aspect of exponentially growing populations the most conservative recombination rate for each locus is that coalescent events tend to be bunched around [i.e., for locus j the one that maximizes PrNull (gr gr(j))/ the time of the onset of growth. If the onset of growth PrAlt (gr gr(j))]. Another option would be to construct precedes T0, then a sample will tend to have more ances- a test statistic whose definition does not depend on an tors present at time T0 than it would in the constant- assumed recombination rate. The loss in power by either sized case, which leads to a greater proportion of sites method is substantial. An example of the latter type of with archaic ancestry and greater power to reject the test statistic is null model. If, on the other hand, T0 is further back in fr(k) the number of loci for which gr k. time than the exponential growth phase, then power depends on the scaled value of T0, which in turn de- Here k is an arbitrary constant. Note, however, that pends on assumptions about N. The power in this situa- determining the rejection power of this statistic still tion is very close to the power for the comparable con- requires simulations over many possible values of C. If stant-sized population case. Thus, the assumption of a c 0.1, T0 0.1, T1 1.0, and k 7, then the power constant population size is conservative with respect to to reject the null model with fr(k) and 60 loci is 30%. recent population growth. In Figure 3a, the comparable power is 94.6%.
- 8. 1278 J. D. Wall Nature of recombination: The model used here in- ancestor of a sample of DNA sequences. Mol. Biol. Evol. 14: 195–199. cludes crossing over but not gene conversion. The incor- Griffiths, R. C., and P. Marjoram, 1996 Ancestral inference from poration of gene conversion might lead to higher values samples of DNA sequences with recombination. J. Comp. Biol. of gr; if a conversion tract is surrounded on both sides 3: 479–502. Harding, R. M., S. M. Fullerton, R. C. Griffiths, J. Bond, M. J. Cox by regions with the same genealogy, then it is more likely et al., 1997 Archaic African and Asian lineages in the genetic that one observes two congruent sites with evidence of ancestry of modern humans. Am. J. Hum. Genet. 60: 772–789. recombination between them. To avoid this problem, Harris, E. E., and J. Hey, 1999 X chromosome evidence for ancient human histories. Proc. Natl. Acad. Sci. USA 96: 3320–3324. either (1) the null model could be modified to include Hey, J., and J. Wakeley, 1997 A coalescent estimator of the popula- intragenic recombination or (2) test statistics of similar tion recombination rate. Genetics 145: 833–846. power (e.g., lb or g; see Figure 2) could be used that Howells, W. W., 1976 Explaining modern man: evolutionists versus migrationists. J. Hum. Evol. 5: 477–495. are likely to be less sensitive to assumptions regarding Huang, W., R. Ciochon, Y. Gu, R. Larick, Q. Fang et al., 1995 Early recombination. Homo and associated artefacts from Asia. Nature 378: 275–278. Even though there are not yet enough genetic se- Hublin, J. J., 1998 Climatic changes, paleogeography, and the evolu- tion of the neandertals, pp. 295–310 in Neandertals and Modern quence data to answer conclusively questions sur- Humans in Western Asia, edited by T. Akazawa, K. Aoki and O. rounding modern human origins, it is important to start Bar-Yosef. Plenum Press, New York. thinking about how multilocus data can be used to infer Hublin, J. J., C. Barroso Ruiz, P. Medina Lara, M. Fontugne and J. L. Reyss, 1995 The Mousterian site of Zafarraya (Andalucia, demographic history. Unlike selection, which tends to Spain): dating and implications on the palaeolithic peopling be localized, demography is expected to affect the whole processes of Western Europe. C. R. Acad. Sci. Paris 321: 931–937. Hublin, J. J., F. Spoor, M. Braun, F. Zonneveld and S. Condemi, genome. As methods become more sophisticated, we 1996 A late Neanderthal associated with upper Paleolithic arte- will have the power to consider more complicated (and facts. Nature 381: 224–226. hopefully more realistic) models of demographic his- Hudson, R. R., 1983 Properties of a neutral allele model with intra- genic recombination. Theor. Popul. Biol. 23: 183–201. tory. The model of ancient structure with recent mixing Hudson, R. R., 1987 Estimating the recombination parameter of a presented here might be a reasonable approximation finite population model without selection. Genet. Res. 50: 245– of human demographic history. If so, estimating c will 250. Hudson, R. R., 1990 Gene genealogies and the coalescent process, give us some idea of what proportion of our genome pp. 1–44 in Oxford Surveys in Evolutionary Biology, Vol. 7, edited came from Neanderthals or other archaic human popu- by P. H. Harvey and L. Partridge. Oxford University Press, lations. The results obtained here suggest that at least New York. Hudson, R. R., and N. L. Kaplan, 1985 Statistical properties of the in some cases, tens of thousands of years of random number of recombination events in the history of a sample of mating are not sufficient to obliterate the patterns of DNA sequences. Genetics 111: 147–164. population structure from the distant past. Kaessmann, H., F. Heißig, A. von Haeseler and S. Paabo, 1999 ¨¨ DNA sequence variation in a non-coding region of low recombi- I thank R. Hudson and M. Nordborg for helpful discussions and nation on the human X chromosome. Nat. Genet. 22: 78–81. R. Hudson, M. S. McPeek, M. Przeworski, and two anonymous review- Kahn, P., and A. Gibbons, 1997 DNA from an extinct human. Sci- ers for comments on an earlier version of this manuscript. This work ence 277: 176–178. was motivated by discussions at the North Atlantic Treaty Organization Krings, M., A. Stone, R. W. Schmitz, H. Krainitzki, M. Stoneking et Advanced Study Institute on Human Evolution at the Newton Institute al., 1997 Neanderthal DNA sequences and the origin of modern humans. Cell 90: 19–30. in Cambridge. Lahr, M. M., 1994 The multiregional model of modern human origins: a reassessment of its morphological basis. J. Hum. Evol. 26: 23–56. Lahr, M. M., 1996 The Evolution of Modern Human Diversity. Cam- LITERATURE CITED bridge University Press, Cambridge, United Kingdom. Lahr, M. M., and R. Foley, 1994 Multiple dispersals and modern Armour, J. A. L., T. Anttinen, C. A. May, E. E. Vega, A. Sajantila human origins. Evol. Anthropol. 3: 48–60. et al., 1996 Minisatellite diversity supports a recent African ori- Lindahl, T., 1997 Facts and artifacts of ancient DNA. Cell 90: 1–3. gin for modern humans. Nat. Genet. 13: 154–160. Marjoram, P., and P. Donnelly, 1994 Pairwise comparisons of Bouffard, G. G., J. R. Idol, V. V. Braden, L. M. Iyer, A. F. Cunning- mitochondrial DNA sequences in subdivided populations and ham et al., 1997 A physical map of human chromosome 7: an implications for early human evolution. Genetics 136: 673–683. integrated YAC contig map with average STS spacing of 79 kb. Mercier, N., H. Valladas, J. L. Joron, J. L. Reyss, F. Leveque et Genome Res. 7: 673–692. al., 1991 Thermoluminescence dating of the late Neanderthal Brauer, G., 1984 The ‘Afro-European sapiens hypothesis’ and homi- ¨ remains from Saint-Cesaire. Nature 351: 737–739. nid evolution in East Asia during the late Middle and Upper Nagaraja, R., S. MacMillan, J. Kere, C. Jones, S. Griffin et al., Pleistocene. Cour. Forschungsinst. Senckenb. 69: 145–165. 1997 X chromosome map at 75-kb STS resolution, revealing Carbonell, E., J. M. Bermudez De Castro, J. L. Arsuaga, J. C. Diez, extremes of recombination and GC content. Genome Res. 7: A. Rosas et al., 1995 Lower Pleistocene hominids and artifacts 210–222. from Atapuerca-TD6 (Spain). Science 269: 826–830. Nickerson, D. A., S. L. Taylor, K. M. Weiss, A. G. Clark, R. G. Cavalli-Sforza, L. L., P. Menozzi and A. Piazza, 1994 The History Hutchinson et al., 1998 DNA sequence diversity in a 9.7-kb and Geography of Human Genes. Princeton University Press, region of the human lipoprotein lipase gene. Nat. Genet. 19: Princeton, NJ. 233–240. Duarte, C., J. Mauricio, P. B. Pettitt, P. Souto, E. Trinkaus et Nordborg, M., 1998 On the probability of Neanderthal ancestry. al., 1999 The early Upper Paleolithic human skeleton from the Am. J. Hum. Genet. 63: 1237–1240. Abrigo do Lagar Velho (Portugal) and modern human emer- Nordborg, M., 2000 On detecting ancient admixture, in Proceedings gence in Iberia. Proc. Natl. Acad. Sci. USA 96: 7604–7609. of the NATO ASI Workshop, “Genes, Fossils, and Behaviour: An Inte- Foley, R., and M. M. Lahr, 1997 Mode 3 technologies and the grated Approach to Human Evolution” (NATO Science Series: Life evolution of modern humans. Camb. Arch. J. 7: 3–36. Sciences, Vol. 310). IOS Press, Amsterdam. Fu, Y.-X., and W.-H. Li, 1997 Estimating the age of the common Rieder, M. J., S. L. Taylor, A. G. Clark and D. A. Nickerson, 1999
- 9. Sequence Data and Human Origins 1279 Sequence variation in the human angiotensin converting enzyme. Takahata, N., 1988 The coalescent in two partially isolated diffu- Nat. Genet. 22: 59–62. sion populations. Genet. Res. 52: 213–222. Roberts, R. G., R. Jones, N. A. Spooner, M. J. Head, A. S. Murray, Templeton, A. R., 1993 The “Eve” hypothesis: a genetic critique et al., 1994 The human colonisation of Australia: optical dates and reanalysis. Am. Anthropol. 95: 51–72. of 53,000 and 60,000 years bracket human arrival at Deaf Adder Tishkoff, S. A., E. Dietzsch, W. Speed, A. J. Pakstis, J. R. Kidd et Gorge, Northern Territory. Q. Sci. Rev. 13: 575–583. al., 1996 Global patterns of linkage disequilibrium at the CD4 Rogers, A. R., 1995 Genetic evidence for a Pleistocene population locus and modern human origins. Science 271: 1380–1387. explosion. Evolution 49: 608–615. Vigilant, L., M. Stoneking, H. Harpending, K. Hawkes and A. C. Slatkin, M., and R. R. Hudson, 1991 Pairwise comparisons of mito- Wilson, 1991 African populations and the evolution of human chondrial DNA sequences in stable and exponentially growing mitochondrial DNA. Science 253: 1503–1507. populations. Genetics 129: 555–562. Wall, J., 1999 Recombination and the power of statistical tests of Smith, F. H., 1992 The role of continuity in modern human origins, neutrality. Genet. Res. 74: 65–79. pp. 145–156 in Continuity or Replacement? Controversies in Homo Ward, R., and C. Stringer, 1997 A molecular handle on the Nean- sapiens Evolution, edited by G. Brauer and F. H. Smith. A. A. ¨ derthals. Nature 388: 225–226. Balkema, Rotterdam, The Netherlands. Weidenreich, F., 1943 The skull of Sinanthropus pekinensis: a compar- Stiner, M. C., N. D. Munro, T. A. Surovell, E. Tchernov and O. ative study of a primitive hominid skull. Palaeontol. Sin. Ser. D Bar-Yosef, 1999 Paleolithic population growth pulses evi- 10: 1–485. denced by small animal exploitation. Science 283: 190–194. Stringer, C. B., and P. Andrews, 1988 Genetic and fossil evidence Weiss, G., and A. von Haeseler, 1998 Inference of population for the origin of modern humans. Science 239: 1263–1268. history using a likelihood approach. Genetics 149: 1539–1546. Swisher, C. C., G. H. Curtis, T. Jacob, A. G. Getty, A. Suprijo et Wolpoff, M. H., 1996 Interpretations of multiregional evolution. al., 1994 Age of the earliest known hominids in Java, Indonesia. Science 274: 704–706. Science 263: 1118–1121. Wolpoff, M. H., X. Wu and A. G. Thorne, 1984 Modern Homo Swisher, C. C., W. J. Rink, S. C. Anton, H. P. Schwarcz, G. H. sapiens origins; a general theory of hominid evolution involving Curtis et al., 1996 Latest Homo erectus of Java: potential con- the fossil evidence from East Asia, pp. 411–483 in The Origins of temporaneity with Homo sapiens in Southeast Asia. Science 274: Modern Humans: A World Survey of the Fossil Evidence, edited by F. 1870–1874. Smith and F. Spencer. Liss, New York. Tajima, F., 1983 Evolutionary relationships of DNA sequences in Zietkiewicz, E., V. Yotova, M. Jarnik, M. Korab-Laskowska, K. K. finite populations. Genetics 105: 437–460. Kidd et al., 1997 Nuclear DNA diversity in worldwide distributed Tajima, F., 1989a The effect of change in population size on DNA human populations. Gene 205: 161–171. polymorphism. Genetics 123: 597–601. Tajima, F., 1989b Statistical method for testing the neutral mutation Communicating editor: S. Tavare ´ hypothesis by DNA polymorphism. Genetics 123: 585–595.