Creating a Continuous Improvement Culture
•
46 likes•34,937 views

Recorded webinar: http://slidesha.re/M4Zyhu Subscribe: http://www.ksmartin.com/subscribe Karen’s Books: http://ksmartin.com/books Lean has been in popular use since the late 1990's in some circles and since the mid-2000's in others. Yet very few organizations have establishing true continuous improvement cultures. Why? In this webinar you will learn the essential elements for infusing C.I. into your organization's DNA--including the must-have leadership and management behaviors--and tips for selling these needs to your leadership team.

Recommended
Recommended
More Related Content
What's hot
What's hot (20)
Similar to Creating a Continuous Improvement Culture
Similar to Creating a Continuous Improvement Culture (20)
More from TKMG, Inc.
More from TKMG, Inc. (20)
Recently uploaded
Recently uploaded (20)
Creating a Continuous Improvement Culture
- 2. Welcome! • Argentina • Australia • Bermuda • Brazil • Canada • Finland • France • Great Britain (UK) • India • Latvia • Netherlands • New Zealand • Spain • United States • Uruguay www.ksmartin.com/subscribe
- 3. Coach / Facilitator / Consultant / Trainer: Lead Lean transformations & develop people across all industries. Teacher: University of California, San Diego Author & Speaker: Karen Martin, President The Karen Martin Group, Inc. www.ksmartin.com 3 October 2013 Shingo Prize winner!
- 4. © 2013 The Karen Martin Group, Inc. 4 Upcoming Webinars • How Outstanding is Your Organization?: An Assessment – Tuesday, September 17, 2013 – 11:00 am‐12:15 pm – https://www2.gotomeeting.com/register/923117162 • Value Stream Mapping: Visualizing Work Flow and Aligning People for Organizational Transformation – Tuesday, October 8, 2013 – 11:00 am‐12:15 pm PT – https://www2.gotomeeting.com/register/151856458 • Improvement Facilitation & Coaching: An Open Forum – Tuesday, October 29, 2013 – 11:00 am‐12:15 pm PT – https://www2.gotomeeting.com/register/999232762
- 5. © 2013 The Karen Martin Group, Inc. 5 After the webinar… • All recordings are available on: – www.vimeo.com/karenmartingroup – www.youtube.com/karenmartingroup – www.slideshare.net/karenmartingroup – www.ksmartin.com/webinars • The materials are available on – www.slideshare.net/karenmartingroup
- 6. © 2013 The Karen Martin Group, Inc. 6 Key Topics • The 4 conditions you need to create to build a continuous improvement culture. • What continuous improvement looks and feels like. • How to sell leadership on the management and leadership behaviors and skill development needs that lead to continuous improvement.
- 11. © 2013 The Karen Martin Group, Inc. 11 The Toyota Way 2001 • Respect for People – Respect – We respect others, make every effort to understand each other, take responsibility, and build mutual trust. – Teamwork – We stimulate professional growth, share the opportunities of development, and maximize individual and team performance. • Continuous Improvement – Challenge – We form a long‐term vision meeting challenges with courage and creativity to realize our dream. – Kaizen – We improve our business operations continuously, always driving for innovation and evolution. – Genchi Genbutsu – We believe in going to the source to find the facts to make correct decisions, build consensus, and achieve goals at our best speed.
- 12. © 2013 The Karen Martin Group, Inc. 12 Continuous Improvement: The Relentless Pursuit of Perfection
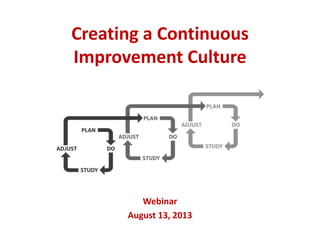
- 14. © 2013 The Karen Martin Group, Inc. 14 True Continuous Improvement CHECK CHECK CHECK ACT ACT ACT
- 19. © 2013 The Karen Martin Group, Inc. 19 Creating a C.I. Culture: Requirements • Will • Skill • Authority • Guidance
- 27. © 2013 The Karen Martin Group, Inc. 27 Requisite Knowledge & Skills • Value‐adding vs. non‐value‐adding • Three conditions to eliminate: – Mura ‐ unevenness – Muri ‐ overburden – Muda ‐ waste • Eight types of waste • PDSA/PDCA (Plan‐Do‐Study‐Adjust or Check‐Act) – Including root cause analysis • Process metrics – Process time – Lead time – % Complete & accurate • Process mapping & process documentation
- 29. © 2013 The Karen Martin Group, Inc. 29 Root Cause Analysis: 4 Key Tools CauseCause--andand--Effect DiagramEffect Diagram Machine Measurement Environment People Material / Info Method Budgets Submitted Late Lack of experience Time availability No sense of import No stnd spread sheet Email vs. FedEx No standard work Input rec’d late Forecast in other system Manual vs. PC System avail. No milestones $ vs. units Weather delays Dispersed sales force Changing schedule Machine Measurement Environment People Material / Info Method Budgets Submitted Late Lack of experience Time availability No sense of import No stnd spread sheet Email vs. FedEx No standard work Input rec’d late Forecast in other system Manual vs. PC System avail. No milestones $ vs. units Weather delays Dispersed sales force Changing schedule 5 Why’s Why? Why? Why? Why? Why? Paret o Chart Credit Applicat ion Delays 2 9 0 9 6 2 7 5 6 1 2 4 2 1 8 0 2 4 9 3 4 1 % 7 7 % 8 6 % 1 0 0 % 9 7 % 9 4 % 0 500 1000 1500 2000 2500 3000 3500 N o Si gna t ur e I ns uf f i c i e nt B a nk I nf o N o pr i or a ddr e s s C ur r e nt C us t ome r N o C r e di t H i s t or y O t he r Reason f or Delay 0% 10% 20% 30% 40% 50% 60% 70% 80% 90% 100% Check Sheets Quantify Occurrences |Equipment failure |||||||||||||Changing customer requirements w/ no adjustment to expected delivery ||||||||||Order entry error |||Staffing/absenteeism |||||Quality issue requiring rework |||||||Material shortage TallyReason |Equipment failure |||||||||||||Changing customer requirements w/ no adjustment to expected delivery ||||||||||Order entry error |||Staffing/absenteeism |||||Quality issue requiring rework |||||||Material shortage TallyReason
- 31. Work: Degrees of Granularity Value Stream Process Process Process Step StepStep 31 Micro Perspective • Identify the tactical “how” • Heavy frontline involvement • Metrics‐Based Process Mapping Macro Perspective • Define strategic direction (“what”) • Heavy leadership involvement • Value Stream Mapping
- 37. © 2013 The Karen Martin Group, Inc. 3737 How are you performing? Gray – Highest industry quality scores Purple – Median industry quality scores Blue – Our quality scores
- 39. © 2013 The Karen Martin Group, Inc. 39 1. Increase sales 5%. 3. Achieve 10% profit. Jan Feb Mar Apr May Jun Jul Aug Sep Oct Nov Dec IT Mktg Ops HR Bob Fin PE Pario COM Direct CDs / AMs PD Rec PD Mgmt BMD SWS 2 3,500 units sold by 12/31/2013 through all channels (approx. $700K) X X X X X X X X X X X X Bob Dana 2 3 3 3 2 3 3 1 1 3 3 1 3 11 Develop & deliver training to top 50 Dealers X X X X X X Bob Rex/Tim 3 3 3 21 Revised course materials by 6/30/2013 X X X Bob Josh R? 2 3 3 2 2 5 Education: 1 school district spec'd/underperforming COM distributor (25) by 12/31 valued at min $35K each X X X X X X X X X X X X Howard Michael S 1 3 2 3 3 8 10 new dealers on board (net) ($500K per dealer this year) X X X X X X X X X X X X Howard Mike B 2 3 9 5 new distributors bringing $200K annual rev (& 5 terminated) X X X X X X X X X X X X Howard Howard 1 1 1 2 3 17 10 projects spec'd by 12/31; $300K rev by 12/31 X X X X X X X X X X Howard Dana 1 3 3 3 29 20 by year‐end X X X X X X X X X X X X Howard Mark H 2 3 3 3 32 TBD X X X Howard Howard 33 TBD X X X X X X X X X Howard Howard 10 Useful reporting and metrics are established and in place X X Jim Randall 3 1 1 1 1 1 1 30 TBD X X X X X Jim Josh 3 31 TBD X X X X X X Jim Josh 1 1 1 3 1 1 1 1 1 1 1 1 1 1 25 TBD Jim Shannon 3 3 1 1 1 1 1 26 System 7.0's in place X X X Jim Randall 3 2 1 2 1 15 100% accurate payroll; 100% management satisfaction at April mgmt. meeting X X X Josh Phyllis 1 3 20 Internet task list is simplified and streamlined for PDs then plan is rolled out to PDs X X X X Michael M Michael M 2 3 2 3 22 Design Calculator is updated successfully and rolled out X X X Neall Matt D 3 1 1 3 2 2 3 24 Competitive Analysis complete and distributed for use X X X Neall Dana 2 3 3 3 3 3 3 1 Design changed to solve delam issue long‐term X X X X X Susan David R 3 2 3 12 30 parts sourced in U.S.; completed plan for managing China‐sourced parts X X X X X X Susan Shannon 3 3 2 2 13 Warehouse laid out; kanban revised; Syspro implemented X X X Susan Shannon 3 14 Lay out complete; equipment installed X X X Susan David R 3 3 X = Planned 2013 Priorities 2013 Goals & Objectives 4. Improve morale (metric TBD). 2. Achieve 50% gross margin. Created: 01‐14‐13 Revised: Level of Effort/Involvement Required Priority Goal or Measurable Objective Exec Owner Plan review dates: Tactical Owner ● = Actual < Company Name > Contentremoved for confidentiality Tie Improvement to Annual Strategy Deployment Plans
- 40. Tie Improvement to Future State Value Stream Maps Referring Physician % C&A = 85 % Send Reports (Imaging) Cycle Time = 3 mins. % C&A = 90 % 6 Hospital Schedule appt Pre-register Cycle Time = 11 mins. Lead Time = 45 mins. % C&A = 98 % 6 CT=Cycle Time LT=Lead Time %C&A=% Complete & Accurate 0.0833 hrs. 1 mins. 0.583 hrs. 10 mins. 0.333 hrs. 10 mins. 0.0833 hrs. 2 mins. 2 hrs. 15 mins. 7 hrs. 1 mins. 0.0333 hrs. 1 mins. 0.5 hrs. 3 mins. LT = 11.3 hrs. CT = 43 mins. CT/LT Ratio = 6.32% Lead Time = 45 mins.Lead Time = 15 days Prep Patient (Tech) Cycle Time = 10 mins. % C&A = 100 % 2 Check-in Patient (Imaging) Cycle Time = 1 mins. % C&A = 98 % 3 Complete Exam (Tech) Cycle Time = 10 mins. % C&A = 90 % 2 Transmit Images (Tech) Cycle Time = 2 mins. % C&A = 100 % 2 Read/Dictate Exam (Radiologist) Cycle Time = 15 mins. % C&A = 95 % 2 Review Draft/Sign (Radiologist) Cycle Time = 1 mins. % C&A = 95 % 2 Print Reports (Imaging) Cycle Time = 1 mins. % C&A = 99 % 2 20 mins. 5 mins. 120 mins. 420 mins. 2 mins. 30 mins.35 mins. E Pay ExcelSymposium Internet Waiting Room Management System Fax Order Solutions PACS 5 mins. Set-up Reduction Remove Check in and Reduce System Access Work BalancingStandard Work Pull System (Supplies Kanban) Visual Workplace Voice Recognition Batch Reductions 5S Co-locate Standard WorkWork Balance Continuous Flow Value Stream Alignment Auto Fax 80% Us Mail 15% MD Mailbox 5% Rolled First Pass yield = 40% Rework Loop via Fax 10% of the time Customer Demand: 15 patients perDay (Takt Time1920 seconds) 8 hours per day 1 2 3 4 5 6 7 8 9 10 11 Risk Reduction (Joint Commision) Meditech
- 42. © 2013 The Karen Martin Group, Inc. 42 Attaining Mastery From The Outstanding Organization, p. 115
- 44. © 2013 The Karen Martin Group, Inc. 44 What you can do immediately no matter where you sit… 1. Make sure you know and are highly skilled in improvement basics. 2. Begin asking “why,” “why not?” and what if?” in every encounter/meeting. 3. Establish an improvement‐safe zone in your sphere of influence; quantify the number of ideas implemented. 4. Coach, coach, coach…and then coach some more. 5. Quantify results when possible and broadcast, broadcast, broadcast.
- 45. © 2013 The Karen Martin Group, Inc. 45 Upcoming Webinars • How Outstanding is Your Organization?: An Assessment – Tuesday, September 17, 2013 – 11:00 am‐12:15 pm – https://www2.gotomeeting.com/register/923117162 • Value Stream Mapping: Visualizing Work Flow and Aligning People for Organizational Transformation – Tuesday, October 8, 2013 – 11:00 am‐12:15 pm PT – https://www2.gotomeeting.com/register/151856458 • Improvement Facilitation & Coaching: An Open Forum – Tuesday, October 29, 2013 – 11:00 am‐12:15 pm PT – https://www2.gotomeeting.com/register/229489922
- 47. © 2013 The Karen Martin Group, Inc. 47 Your Questions 1. Are there unique challenges that exist with establishing CI cultures in union workforces? 2. Companies I worked for push Return on Investment as the metric for gauging CI activities and culture effectiveness. Is this the best metric, and are there others that we should be looking at? 3. How long does it take to change a 125‐year old culture? 4. How do you recommend broadcasting successes and making them relevant? 5. Our division president wants to implement a long‐term vision, whereas corporate seeks quarterly results. How do I interact w/ president & direct reports to ensure buy‐in? 6. What are things that a middle manager can to do drive Lean culture?