SlideShare une entreprise Scribd logo
1  sur  47
Télécharger pour lire hors ligne
Metrics-Based Process Mapping:
        What, When & How
           Karen Martin


             Webinar
         November 29, 2012
Materials

www.ksmartin.com/files/webinarmaterials/11‐29‐2012_slides.pdf

www.ksmartin.com/files/webinarmaterials/11‐29‐2012_handout.pdf


                                                                 2
 Founder: Karen Martin & Associates, LLC (1993).
 Consultant / Coach: Lead Lean transformations & 
develop people in office, service and knowledge 
environments.
 Teacher: University of California, San Diego’s 
Lean Enterprise program.
 Author:
                                                     Karen Martin, Principal


                                                       www.ksmartin.com
The Work We Do:
                     Degrees of Granularity

Macro View
   (Strategic;
     heavy
                                     Value     Value Stream
                                                   Map
  leadership
 involvement)
                                     Stream


                           Process   Process    Process


Micro View                                     Metrics-Based
   (Tactical;     Step       Step      Step    Process Map
heavy frontline
 involvement)


                                                               4
Value Stream Maps Serve as Visual “Storyboards”


Makes the disconnects               Shows the linkage
and obstacles to flow               between material and
visible at a macro level            information flow

                                                     5
Repair & Maintenance
                                                                                                                    Value Stream Map
                                                                                                                      Current State                         Source Refrigeration & HVAC, Inc.
                                                                                                                                                             Current State Value Stream Map
                                                                                                                                                                    Serv ice Deliv ery
                                                                                                                                                               Created February 11, 2009
                                                                                                                                                                     CONFIDENTIAL


                                                                                                                   Customer


                                                                                                          Great
                                                                                                          Plains


                                                                                                                                                                                                                                                Verisae                                     Excel
                                                                                                                                                                                                                                              (Customer)                                 Spreadsheet
                                                                                        Special Order                                                                                                                                                                                    (Customer)
                                                                                            Part
                                                                                                                                                 Supplier
                                                                                             Tech


                                                                                                                                               Upload time                Close call in            Process Time
                                                                                         Pick up Part                                                                                                                          Process A/P
                                                                                                                                                  card                      Verisae                   Cards
                                                                                        at Parts Store
                                                                              ?%                                                                                           Account
                                                                                                                                                                                                                                A/P Admin
                                                                                                                                                  Tech                     Manager                 Payroll Admin
                                                                                             Tech
                                                                                                                                                                            (West)
                                                                                                                                                                                                                              PT = 15 mins.
                                                                                        PT = 75 mins.                                         PT = 0 mins.               PT = 1 mins.              PT = 10 mins.
                                                                                                                                                                                                                              %C&A = 85%
                                                                             40%        %C&A = 95%                                            %C&A = 70%                 %C&A = 90%                %C&A = 90%
                                                                                                                                                                                                                              Batch: 1x/day
                                                                                                                                              Batch: 1x/day              Batch: 1x/day             Batch: 1x/day

                                                                                                                                                                                                                                                              Review                    Enter Invoices
                                      Select &                Assess                                                Make Repair;                                            Review                                                                                                                                      Receive
           Receive                                                                       Get Part from                                        Complete Call                                         Review Open                 Review &                     Invoices;                  into Verisae &
                                   Dispatch Tech              Problem        ?%                                     Call to raise                                         Service Call                                                                                                                                 Cash; Post
         customer call                                                                      Truck                                                in GP                                              Ticket Report             Post Invoices                  Close in                     Excel; Mail
                                                                                                                     the NTE                                                 Data                                                                                                                                       Payment
                                   Dispatcher &                                                                                                                                                                                                            Verisae (Pac)                   Invoices
          Call Center                Service                   Tech                                                                            Dispatcher                   Service                 Billing Admin             Posting Admin
                                                                                             Tech                       Tech                                                                                                                                 Account                                                   Collections
                                    Manager                                                                                                                                 Manager                                                                                                     Billing Admin
5 m.                     120 m.                    90 m.                    75 m.                        120 m.                     240 m.                      640 m.                    6 days                     240 mins.                  640 m.       Manager         120 m.                          60 days
         PT = 2 mins.              PT = 5 mins.            PT = 90 mins.                PT = 0 mins.                                          PT = 5 mins.                                         PT = 25 mins.             PT = 3 mins.
                                                                                                                   PT = 120 mins.                                        PT = 10 mins.
         %C&A = 60%                %C&A = 60%              %C&A = 90%                                                                         %C&A = 80%                                           %C&A = 75%                %C&A = 98%                 PT = 10 mins.                  PT = 4 mins.
                                                                                                                   %C&A = 40%                                            %C&A = 50%
                                                                                                                                                                                                                             Batch: 1x/day              %C&A = 85%                     %C&A = 95%
                                                                                                                                                                         Batch: 2x/day
                                                                                                                                                                                                                                                        Batch: 3-5x per wk             Batch: 1x/week


0.0833                                              1.5                                                                                                         10.7                       48                                                   10.7                                                          480
 hours                   2 hours                   hours                   1.25 hours                    2 hours                    4 hours                     hours                     hours                     4 hours                     hours                        2 hours                         hours                          Lead Time = 572 hours
           2 minutes                 5 minutes               90 minutes                   75 minutes                 120 minutes                5 minutes                  10 minutes                25 minutes                 3 minutes                   10 minutes                    4 minutes                                         Process Time = 349 minutes


                                                                                                                                                                                                                                                                                               Acronym Key
                                                                                                                                                                                                                                                                                  %C&A %Complete and Accurate                        Lead Time to invoice = 86.2 hrs
                                                                                                                                                                                                                                                                                  AR        Activity Ratio                              Process Time =5.9 hrs.
                                                                                                                                                                                                                                                                                  FTE       Full Time Equivalent                        NOTE: Business hours
                                                                                                                                                                                                                                                                                  LT        Lead Time                                    Activity Ratio = 6.8%
                                                                                                                                                                                                                                                                                                                                             RFPY = 1.1%
                                                                                                                                                                                                                                                                                  PT        Process Time
                                                                                                                                                                                                                                                                                                                                       Lead time to cash = ? days
                                                                                                                                                                                                                                                                                  RFPY Rolled First Pass Yield
Current State Value Stream Map
                                                                                          Outpatient Imaging Services
                                                                                                                                                                                                                                                Customer Demand:
                                                                                                                                                                                                                                                 15 patients per Day
                                                                                                                                                                                                                                              (Takt Time 1920 seconds)
                                                                         Pre-register                                                                  Schedule                                                                                    8 hours per day
                                                                           Patient                                                                    Appointment
                                                                                                                                                                                                                 Referring
            Hospital
                                                                                                                                                                                                                 Physician
                   4                                                                                                                                                                                                        1
                                    Lead Time = 24 days                      5           3                 Lead Time = 990 mins.                       6         2             Lead Time = 12 mins.
                                                                    Cycle Time = 30 mins.                                                        Cycle Time = 11 mins.                                                      % C&A = 65 %
                                                                    Lead Time = 990 mins.                                                        Lead Time = 12 mins.
                                                                    % C&A = 100 %                                                                % C&A = 98 %


                                                                                                                                                                                                                                                                           CT=Cycle Time
                                                                                                                                                                                                                                                                           LT=Lead Time
                                                                                                                                                                                                                                                                           %C&A=% Complete & Accurate


                       Symposium                    E Pay                        Excel                   ADS                 Meditech                      Internet                                         Fax Order                 PACS
                                                                                                                                                                                Waiting Room                                                                                      Auto Fax 50%
                                                                                                                                                                                                            Solutions
                                                                                                                                                                                Management                                                                                        Us Mail 25%
                                                                                                                                                                                  System
                                                                                                                                                                                                                                                                                  MD Mailbox 25%


                                                                                                                                                                                                                                                                                                 Rework Loop
                                                                                                                                                                                                                                                                                                 via Fax 25% of
                                                                                                                                                                                                                                                                                                 the time


                                                                                      Prep                       Complete                         Transmit                     Read/Dictate                    Transcribe                       Review                           Print                     Send
               Check-in                         Check-in
                                                                                     Patient                       Exam                           Images                          Exam                          Report                         Draft/Sign                      Reports                    Reports
                Patient                           Patient
                                                                                     (Tech)                       (Tech)                           (Tech)                      (Radiologist)                     (MDI)                        (Radiologist)                   (Imaging)                  (Imaging)
              (Admitting)                       (Imaging)
5 mins.

               5
                         5       5 mins.
                                                3
                                                            6     45 mins.          2          7    30 mins.
                                                                                                                 2       8         5 mins.
                                                                                                                                                  2          9    248 mins.
                                                                                                                                                                                  2     10      365 mins.
                                                                                                                                                                                                                6       11       960 mins.
                                                                                                                                                                                                                                                2       12     110 mins.
                                                                                                                                                                                                                                                                              2       13    120 mins.
                                                                                                                                                                                                                                                                                                         6        14
          Cycle Time = 2 mins.             Cycle Time = 1 mins.          Cycle Time = 10 mins.             Cycle Time = 15 mins.             Cycle Time = 3 mins.         Cycle Time = 15 mins.         Cycle Time = 5 mins.             Cycle Time = 1 mins.          Cycle Time = 1 mins.         Cycle Time = 3 mins.
          % C&A = 90 %                     % C&A = 98 %                  % C&A = 100 %                     % C&A = 90 %                      % C&A = 100 %                % C&A = 95 %                  % C&A = 75 %                     % C&A = 95 %                  % C&A = 99 %                 % C&A = 90 %


5 minutes                                                       45 minutes                         30 minutes                 5 minutes                          248 minutes                   365 minutes                      960 minutes                   110 minutes                  120 minutes                     L/T = 13464 minutes
               2 minutes         11520          1 minutes                          10 minutes                   15 minutes                        3 minutes                     15 minutes                      5 minutes                      1 minutes                      1 minutes                  3 minutes         VA/T = 11576 minutes
                                 minutes

                                                                                                                                                                                                                                                                                                                            Rolled First Pass
                                                                                                                                                                                                                                                                                                                              yield = 29%
Traditional Mapping Method:
     Process Flow Chart


How is this process performing?

                                  8
Traditional Swim Lane Process Maps


 How do we know what to improve?
                                     9
Are your processes
       even documented?


                          10
2004:
The Birth of Metrics‐Based Process Mapping


                                             11
Just Released!


                 12
What is a Metrics-Based Process Map?

A visual process analysis tool, which integrates:
     Functional orientation of traditional swim lane
      process maps
     Key Lean time and quality metrics
Highlights the disconnects / wastes / delays in a
 process.
     Keeps the improvement focus properly directed
Serves as standard work for workforce training
 and process monitoring.


                                                        13
Metrics-Based Process Mapping
           (MBPM)
15
Mapping Preparation
 Select a skilled, objective facilitator.
 Scope the process being mapped
       Opt for narrow current state focus so you can explore deeply and minimize variation.
       No decision trees in MBPM (interferes w/ timeline); loopbacks are “linearized.”
 Select a cross-functional team of no more than 10.
       Process workers (30-50% of the team)
       Upstream suppliers
       Downstream customers
       Subject matter experts (e.g. I.T., legal, etc.)
       Outside eyes
 Draw 6” wide swim lanes on the 36” paper.
       Pre-drawn lines – template available:
        http://www.scribd.com/doc/114904601/Metrics-Based-Process-
        Mapping
       Chalk line
       Manually draw

                                                                                               16
Metrics-Based Process Mapping:
               Four Stages

Document the current state (the P in PDSA)
Analyze the current state
Design, test, refine and implement the future
 state
Document the improved process
Continuously monitor and improve the
 process


                                                 17
Creating the Current State Metrics-
            Based Process Map:
                  10 Steps
1.  Label the map.
2.  List functions.
3.  Document all activities/steps.
4.  Number the activities.
5.  Add step-specific metrics & other relevant info.
6.  Define timeline critical path.
7.  Create the timeline.
8.  Calculate summary metrics.
9.  Identify value-adding and necessary non-value-adding
    steps.
10. Circle high priority improvement needs.
                                                           18
Step 1: Label the map

                        Process Name
               Included/Excluded Conditions
                    Current State MBPM
                             Date
               Facilitator and/or Team Names
Step 2: List functions involved in process.

                                                               Process Name
Function A
                                                      Included/Excluded Conditions
                                                           Current State MBPM
                                                                    Date
Function B
                                                      Facilitator and/or Team Names

Function C


Function D


Function E


Function F


Include external functions, if appropriate (e.g. customers, suppliers/contractors, etc.)
Step 3: Document all activities (steps) on
   3 x 6” post-its; place sequentially.
         Step Step              Parallel Steps
           1   2                 (concurrent
                                  activities)


                Ticking clock
Step 3: Document all
     activities/steps on 3 x 6” Post-its
Use verb/noun format; clear and concise.
Include function.
Separate tasks that have different quality outputs
 or timeframes; combine tasks otherwise.
Place post-its in appropriate swim lane,
 sequentially (according to the ticking clock).
Be “the thing.”


                                                      22
Step 3: Document task & function

   Activity
(Verb / Noun)
                                    Function that
                                    performs the
                                        task
Step 4: Number the Activities
                              Step #


                         Note: For parallel
                         activities, use
                         alpha modifiers --
                         e.g. 8A, 8B, etc.
Step 5: Add step-specific information


                                 Barriers to Flow
                                   (if relevant)
      # Staff                       • Batching
  (if relevant)
                                    • Shared
                                    resources
                                    • System
                                    downtime
                                    • Etc.


                                  PT (Process Time)
% Complete &
  Accurate                        LT (Lead Time)
Key Lean Metrics: Time

Process time (PT)
     The time it takes to actually perform the work, if one is
      able to work on it uninterrupted
     Includes task-specific doing, talking, and thinking
     aka “touch time,” work time, cycle time
Lead time (LT)
     The elapsed time from the time work is made available
      until it’s completed and passed on to the next person or
      department in the chain
     aka throughput time, turnaround time, elapsed time
     Includes Process Time


                                                                  26
Step-Specific Lead Time vs. Process Time


                    Lead Time


                    Process Time
 Work                               Work passed
Received                            to next step


           LT = PT + Waiting / Delays

                                              27
Key Lean Metrics: Quality

%Complete and Accurate (%C&A)
     % time downstream customer can perform task without
      having to “CAC” the incoming work:
        Correct information or material that was supplied
        Add information that should have been supplied
        Clarify information that should or could have been clear
     This output metric is measured by the immediate
      downstream customer and all subsequent downstream
      customers.
     If workers further downstream deem the output from a
      particular step to be less than 100%, multiply their
      assessment of quality with the previous assessments.

                                                                    28
Dealing with high variation metrics

Map the rule (80%), not the exceptions
 (20%).
     For metrics with ranges, use the median.
Continue to add conditions to your scope if
 you need to.
     To minimize “it depends” answers.


                                                 29
Step 6: Define the “Timeline Critical Path”


 For parallel activities: Chose the longest LT unless a
 “dead-end” activity
Complex Process with Many Concurrent
      Activities (Parallel Steps)


                                       31
Step 7: Create the Timeline
Step 8 – Calculate Summary Metrics

Timeline PT Sum
Timeline LT Sum
% Activity
     (PT Sum/Total LT Sum) x 100
Rolled %C&A
     %C&A x %C&A x %C&A…
     Include ALL post-its, not just critical path
Labor requirements (next slide)

                                                     33
Summary Metrics: Labor Effort

   Total PT
          Sum of all activities, not just timeline
   Labor Requirements
                              Total PT (in hrs) X # occurrences/year
         # FTEs*        =
                               Available work hrs/year/employee**


* FTE = Full-Time Equivalent (2 half-time employees = 1 FTE)

**Available work hrs/yr/employee = # full-time hrs – paid holidays, vacation & sick time.
Full time is typically 2,080 hrs per year.

                                                                                       34
Metrics-Based Process Mapping
             Current State Summary Metrics
                                   Projected      Projected %
    Metric        Current State
                                  Future State   Improvement

Timeline PT         110 mins

Timeline LT          7 days

% Activity            3.3%

Rolled %C&A           9.2%
Total Process
                    170 mins
Time

Labor Effort        1/7 FTEs
Step 9: Label the value-adding (VA) and
necessary non-value adding (N) activities


                                            36
Customer-Defined Value

Value-Adding (VA) - any operation or activity
 your external customers value and are (or
 would be) willing to pay for.
Non-Value-Adding (NVA) - any operation or
 activity that consumes time and/or resources but
 does not add value to the product (good or
 service) the customer receives.
     Necessary – support processes, regulatory
      requirements, etc.
     Unnecessary – everything else - WASTE


                                                    37
Step 10: Circle the data that indicates
 the greatest need for improvement
Typical Current State Findings
             Islands of value-adding activities
                 All other time is “waste.”

                                         Rework


First Step                                          Last Step
                          Adding Value


    Future State Design: How can we progress from one
    “VA” or “N” step to the next and eliminate all waste?

                                                            39
Future State Design Options
Shorten timeline; reduce labor effort
     Eliminate unnecessary steps/handoffs
     Combine work; move work in parallel
     Create continuous (one-piece) flow; use pull
      systems when needed
     Level demand
     Balance work
Improve quality & predictability
     Standardize work
     Error-proof work
     Make problems visual so they can be fixed
      immediately

                                                     40
Future State Projected Summary Metrics:
            Labor Requirements

Total PT
     Sum of all activities, not just timeline
Labor Requirements

                     Total PT (in hrs) X # occurrences/year
      # FTEs     =
                        Available work hrs/year/employee
      Freed
               = Current State FTEs – Future State FTEs
      Capacity


                                                              41
Metrics-Based Process Mapping
     Projected Future State Summary Metrics
                                       Projected      Projected %
      Metric          Current State
                                      Future State   Improvement

CP PT                      110 mins     85 mins          23%

CP LT                       7 days      4 days           43%

Activity Ratio              3.3%         4.4%            33%

Rolled %C&A                 9.2%         50.4%          448%

Total PT                   170 mins    140 mins

Labor effort*              1.7 FTEs    1.4 FTEs          18%

                                       600 hrs =
Freed capacity
                                       0.3 FTEs
*Demand = 1,200 per year
                                                                    42
Create an Action Plan: Who, What, When, Where, and How?
                                                             Future State Implementation Plan
                                            Value Stream Outpatient Imaging                                                                 Implementation Plan Review Dates
                                   Executive Sponsor Allen Ward                                                                           11/1/2007
                            Value Stream Champion Sally McKinsey                                                                          11/21/2007
                 Value Stream Mapping Facilitator Dave Parks                                                                              12/13/2007
                                            Date Created 10/18/2007                                                                       1/10/2008
   Block                                                                                                                              Implementation Schedule (weeks)             Date
                          Goal / Objective                         Improvement Activity                Type     Owner
     #                                                                                                                        1      2 3 4 5 6 7 8 9 10 11 12                   Complete
                                                          Implement standard work for referral
     2        Improve quality of referral                                                               KE    Sean O'Ryan
                                                          process

              Reduce lead time beween schedulingand                                                             Dianne
    3, 4                                            Cross-train and colocate work teams                PROJ
              preregistration steps                                                                             Prichard

              Eliminate the need for two patient check-                                                         Michael
    5, 6                                                  Collect copays in Imaging                     KE
              ins                                                                                               O'Shea

                                                                                                                Dianne
     6        Eliminate bottleneck in waiting area        Balance work / level demand                   KE
                                                                                                                Prichard

              Eliminate lead time associated with
     9                                                    Implement voice recognition technology       PROJ   Sam Parks
              transcription step


     10       Eliminate batched reading                   Reduce setup required                         KE    Sam Parks


              Reduce inventory costs, regulatory risk                                                           Michael
      7                                                   5S CT supplies area; implement kanban         KE
              and storage needs                                                                                 O'Shea


     12       Reduce delay in report delivery             Implement additional fax ports               PROJ   Martha Allen

                                                          Increase percentage of physicians
     12       Reduce delay in report delivery             receiving electronic delivery (rather than    KE    Martha Allen
                                                          hard copy)


                                                                                                 Approvals
                      Executive Sponsor                                            Value Stream Champion                                     Value Stream Mapping Facilitator
 Signature:                                                      Signature:                                                  Signature:

 Date:                                                           Date:                                                       Date:
When Should You Document Electronically?

Archive the team’s work
Distribute the maps to remote locations
Document the new standard work for the process
     Training/retraining staff
     Monitoring process performance
Communicate the impact of Kaizen Events and
 other improvement activities
Excel product demo: www.vimeo.com/27016122
     Fast forward to 8:00 to begin tool demo.


                                                  44
The Improved State Becomes Standard Work
0                                                                             Current State Metrics-Based Process Map
          PT Units                                          Process Details                                                                             Mapping Team
1       Seconds     Hours             Process Name Order Fulfillment                                        Diane O'Shea                        Ryan Austin
0       Minutes     Days         Specific Conditions Domestic orders through sales force                    Sean Michaels                       Mary Townsend
          LT Units             Occurrences per Year 37,500                                                  Sam Parks
15      Seconds     Hours     Hours Worked per Day 8                                                        Sally Dampier                                                                           Facilitator
 6      Minutes     Days                Date Mapped 25-Jun-08                                               Michael Prichard                                                          Dave Morgan
-1                Step # ►                      1                                      2                                       3                                  4                                     5

0          Function /
          Department             Activity       PT      LT    %C&A       Activity          PT   LT   %C&A       Activity       PT   LT   %C&A      Activity       PT      LT   %C&A      Activity        PT       LT     %C&A


                              Fax PO to Sales
1 Customer                                          0   0      45%
                                   Rep


                                                                       Review PO;
                                                                        clarify with                           Fax PO to
2 Sales Rep                                                                                20   2    90%                       10   4    90%
                                                                       customer as                             warehouse
                                                                          needed


5 Finance


                                                                                                                                                Check inventory
     Warehouse /                                                                                                                                 levels; notify                       Fax PO to Sales
6                                                                                                                                                                     5   4    95%                          5     0.33   90%
     Shipping                                                                                                                                    Sales Rep re:                             Rep
                                                                                                                                                    status


           Critical Path PT                         0                                      20                                  10                                     5                                     5
           Critical Path LT                             0                                       2                                   4                                     4                                       0.33
             Rolled %C&A                                       45%                                   90%                                 90%                                   95%                                       90%
                   Total PT                         0                                      20                                  10                                     5                                     5
Color-Coded Summary Metrics Sheet


   The Excel mapping tool auto-calculates:
     Summary time and quality metrics for before and after maps
     Projected % improvement (color-coded for visual ease)
     Staffing requirements
     User-defined metrics
For Further Questions


        Karen Martin, Principal
       7770 Regents Road #635
         San Diego, CA 92122
            858.677.6799

        ksm@ksmartin.com
     Twitter: @karenmartinopex
Blog & newsletter: www.ksmartin.com/subscribe
     Book info: www.ksmartin.com/MBPM


                                                47

Contenu connexe

Tendances

UCSD Class: A3 Management and Root Cause Analysis
UCSD Class: A3 Management and Root Cause AnalysisUCSD Class: A3 Management and Root Cause Analysis
UCSD Class: A3 Management and Root Cause AnalysisTKMG, Inc.
 
Value Stream Transformation: 10 Keys to Success
Value Stream Transformation: 10 Keys to SuccessValue Stream Transformation: 10 Keys to Success
Value Stream Transformation: 10 Keys to SuccessTKMG, Inc.
 
Value Stream Mapping
Value Stream MappingValue Stream Mapping
Value Stream MappingTKMG, Inc.
 
value stream mapping and metrics based process mapping
value stream mapping and metrics based process mappingvalue stream mapping and metrics based process mapping
value stream mapping and metrics based process mappingTKMG, Inc.
 
KEY PERFORMANCE INDICATOR
KEY PERFORMANCE INDICATORKEY PERFORMANCE INDICATOR
KEY PERFORMANCE INDICATORspeedcars
 
Value Stream Mapping Overview Update
Value Stream Mapping Overview UpdateValue Stream Mapping Overview Update
Value Stream Mapping Overview Updatejheaton418
 
We've Had it All Wrong: Manage Processes, Not people
We've Had it All Wrong: Manage Processes, Not peopleWe've Had it All Wrong: Manage Processes, Not people
We've Had it All Wrong: Manage Processes, Not peopleTKMG, Inc.
 
Value Stream Analysis: Beyond the Mechanics - Part 1 (Planning)
Value Stream Analysis: Beyond the Mechanics - Part 1 (Planning)Value Stream Analysis: Beyond the Mechanics - Part 1 (Planning)
Value Stream Analysis: Beyond the Mechanics - Part 1 (Planning)TKMG, Inc.
 
Metrics-Based Process Mapping
Metrics-Based Process MappingMetrics-Based Process Mapping
Metrics-Based Process MappingTKMG, Inc.
 
Value Stream Mapping -The Concept
Value Stream Mapping -The ConceptValue Stream Mapping -The Concept
Value Stream Mapping -The ConceptSubhrajyoti Parida
 
8 WASTES IN LEAN MANUFACUTING & OVERVIEW OF VSM
8 WASTES IN LEAN MANUFACUTING & OVERVIEW OF VSM8 WASTES IN LEAN MANUFACUTING & OVERVIEW OF VSM
8 WASTES IN LEAN MANUFACUTING & OVERVIEW OF VSMSedhuSiddarth
 
How A Single Black Belt Project Jump Starts a Successful Lean Six Sigma Effort
How A Single Black Belt Project Jump Starts a Successful Lean Six Sigma EffortHow A Single Black Belt Project Jump Starts a Successful Lean Six Sigma Effort
How A Single Black Belt Project Jump Starts a Successful Lean Six Sigma EffortGoLeanSixSigma.com
 
Operational excellence through lean & six sigma
Operational excellence through lean & six sigmaOperational excellence through lean & six sigma
Operational excellence through lean & six sigmaHarsh Upadhyay
 
Value Stream Mapping: How to Visualize Work & Align Leadership for Organizati...
Value Stream Mapping: How to Visualize Work & Align Leadership for Organizati...Value Stream Mapping: How to Visualize Work & Align Leadership for Organizati...
Value Stream Mapping: How to Visualize Work & Align Leadership for Organizati...TKMG, Inc.
 
Six Sigma Black Belt Project
Six Sigma Black Belt ProjectSix Sigma Black Belt Project
Six Sigma Black Belt ProjectAndrey Lygin
 
Pull Production & Kanban Implementation Throughout the Supply
Pull Production & Kanban Implementation Throughout the SupplyPull Production & Kanban Implementation Throughout the Supply
Pull Production & Kanban Implementation Throughout the Supplyarsin1975
 

Tendances (20)

Lean Management
Lean ManagementLean Management
Lean Management
 
UCSD Class: A3 Management and Root Cause Analysis
UCSD Class: A3 Management and Root Cause AnalysisUCSD Class: A3 Management and Root Cause Analysis
UCSD Class: A3 Management and Root Cause Analysis
 
Value Stream Transformation: 10 Keys to Success
Value Stream Transformation: 10 Keys to SuccessValue Stream Transformation: 10 Keys to Success
Value Stream Transformation: 10 Keys to Success
 
Value Stream Mapping
Value Stream MappingValue Stream Mapping
Value Stream Mapping
 
Identifying Lean Waste
Identifying Lean WasteIdentifying Lean Waste
Identifying Lean Waste
 
value stream mapping and metrics based process mapping
value stream mapping and metrics based process mappingvalue stream mapping and metrics based process mapping
value stream mapping and metrics based process mapping
 
KEY PERFORMANCE INDICATOR
KEY PERFORMANCE INDICATORKEY PERFORMANCE INDICATOR
KEY PERFORMANCE INDICATOR
 
Value Stream Mapping Overview Update
Value Stream Mapping Overview UpdateValue Stream Mapping Overview Update
Value Stream Mapping Overview Update
 
We've Had it All Wrong: Manage Processes, Not people
We've Had it All Wrong: Manage Processes, Not peopleWe've Had it All Wrong: Manage Processes, Not people
We've Had it All Wrong: Manage Processes, Not people
 
Value Stream Analysis: Beyond the Mechanics - Part 1 (Planning)
Value Stream Analysis: Beyond the Mechanics - Part 1 (Planning)Value Stream Analysis: Beyond the Mechanics - Part 1 (Planning)
Value Stream Analysis: Beyond the Mechanics - Part 1 (Planning)
 
Metrics-Based Process Mapping
Metrics-Based Process MappingMetrics-Based Process Mapping
Metrics-Based Process Mapping
 
Value Stream Mapping -The Concept
Value Stream Mapping -The ConceptValue Stream Mapping -The Concept
Value Stream Mapping -The Concept
 
Value Stream Mapping
Value Stream MappingValue Stream Mapping
Value Stream Mapping
 
8 WASTES IN LEAN MANUFACUTING & OVERVIEW OF VSM
8 WASTES IN LEAN MANUFACUTING & OVERVIEW OF VSM8 WASTES IN LEAN MANUFACUTING & OVERVIEW OF VSM
8 WASTES IN LEAN MANUFACUTING & OVERVIEW OF VSM
 
How A Single Black Belt Project Jump Starts a Successful Lean Six Sigma Effort
How A Single Black Belt Project Jump Starts a Successful Lean Six Sigma EffortHow A Single Black Belt Project Jump Starts a Successful Lean Six Sigma Effort
How A Single Black Belt Project Jump Starts a Successful Lean Six Sigma Effort
 
Operational excellence through lean & six sigma
Operational excellence through lean & six sigmaOperational excellence through lean & six sigma
Operational excellence through lean & six sigma
 
Value Stream Mapping: How to Visualize Work & Align Leadership for Organizati...
Value Stream Mapping: How to Visualize Work & Align Leadership for Organizati...Value Stream Mapping: How to Visualize Work & Align Leadership for Organizati...
Value Stream Mapping: How to Visualize Work & Align Leadership for Organizati...
 
Six Sigma Black Belt Project
Six Sigma Black Belt ProjectSix Sigma Black Belt Project
Six Sigma Black Belt Project
 
Top 25 lean tools
Top 25 lean toolsTop 25 lean tools
Top 25 lean tools
 
Pull Production & Kanban Implementation Throughout the Supply
Pull Production & Kanban Implementation Throughout the SupplyPull Production & Kanban Implementation Throughout the Supply
Pull Production & Kanban Implementation Throughout the Supply
 

En vedette

Metrics-Based Process Mapping: Part 1 of 3
Metrics-Based Process Mapping: Part 1 of 3Metrics-Based Process Mapping: Part 1 of 3
Metrics-Based Process Mapping: Part 1 of 3TKMG, Inc.
 
Work Standardization & Metrics-Based Process Mapping
Work Standardization & Metrics-Based Process MappingWork Standardization & Metrics-Based Process Mapping
Work Standardization & Metrics-Based Process MappingTKMG, Inc.
 
Metrics-Based Process Mapping: Part 2 of 3
Metrics-Based Process Mapping: Part 2 of 3Metrics-Based Process Mapping: Part 2 of 3
Metrics-Based Process Mapping: Part 2 of 3TKMG, Inc.
 
Metrics-Based Process Mapping - Part 3 of 3 (Product Demo)
Metrics-Based Process Mapping - Part 3 of 3 (Product Demo)Metrics-Based Process Mapping - Part 3 of 3 (Product Demo)
Metrics-Based Process Mapping - Part 3 of 3 (Product Demo)TKMG, Inc.
 
Value Stream Mapping: From Tool to Management Practice
Value Stream Mapping: From Tool to Management PracticeValue Stream Mapping: From Tool to Management Practice
Value Stream Mapping: From Tool to Management PracticeTKMG, Inc.
 
Metrics-Based Process Mapping
Metrics-Based Process Mapping Metrics-Based Process Mapping
Metrics-Based Process Mapping TKMG, Inc.
 
Rapid Improvement: How to Change Behaviors & Get Stuff Done FAST
Rapid Improvement: How to Change Behaviors & Get Stuff Done FASTRapid Improvement: How to Change Behaviors & Get Stuff Done FAST
Rapid Improvement: How to Change Behaviors & Get Stuff Done FASTTKMG, Inc.
 
Process Change: Communication & Training Tips
Process Change:  Communication & Training TipsProcess Change:  Communication & Training Tips
Process Change: Communication & Training TipsTKMG, Inc.
 
Putting an End to "Organizational ADD"
Putting an End to "Organizational ADD"Putting an End to "Organizational ADD"
Putting an End to "Organizational ADD"TKMG, Inc.
 
The Outstanding Organization: The Power of Discipline
The Outstanding Organization: The Power of DisciplineThe Outstanding Organization: The Power of Discipline
The Outstanding Organization: The Power of DisciplineTKMG, Inc.
 
The Outstanding Organization: The Power of Engagement
The Outstanding Organization: The Power of EngagementThe Outstanding Organization: The Power of Engagement
The Outstanding Organization: The Power of EngagementTKMG, Inc.
 
Process Management: Why So Few Companies Get It Right
Process Management: Why So Few Companies Get It RightProcess Management: Why So Few Companies Get It Right
Process Management: Why So Few Companies Get It RightTKMG, Inc.
 
Value Stream Mapping: What to Do Before You Dive In
Value Stream Mapping: What to Do Before You Dive InValue Stream Mapping: What to Do Before You Dive In
Value Stream Mapping: What to Do Before You Dive InTKMG, Inc.
 
Value Stream Mapping in Office and Service
Value Stream Mapping in Office and ServiceValue Stream Mapping in Office and Service
Value Stream Mapping in Office and ServiceTKMG, Inc.
 
Value Stream Map - Mapa do Fluxo de Valor
Value Stream Map - Mapa do Fluxo de ValorValue Stream Map - Mapa do Fluxo de Valor
Value Stream Map - Mapa do Fluxo de ValorPaul John Vicente
 
Transforming An Organisations IT Service Management
Transforming An Organisations IT Service ManagementTransforming An Organisations IT Service Management
Transforming An Organisations IT Service ManagementMichael Moyal
 
Taller práctico para investigadores y emprendedores sobre uso de patentes c...
Taller práctico para investigadores y emprendedores  sobre uso de patentes  c...Taller práctico para investigadores y emprendedores  sobre uso de patentes  c...
Taller práctico para investigadores y emprendedores sobre uso de patentes c...Pablo Paz
 

En vedette (18)

Metrics-Based Process Mapping: Part 1 of 3
Metrics-Based Process Mapping: Part 1 of 3Metrics-Based Process Mapping: Part 1 of 3
Metrics-Based Process Mapping: Part 1 of 3
 
Work Standardization & Metrics-Based Process Mapping
Work Standardization & Metrics-Based Process MappingWork Standardization & Metrics-Based Process Mapping
Work Standardization & Metrics-Based Process Mapping
 
Metrics-Based Process Mapping: Part 2 of 3
Metrics-Based Process Mapping: Part 2 of 3Metrics-Based Process Mapping: Part 2 of 3
Metrics-Based Process Mapping: Part 2 of 3
 
Metrics-Based Process Mapping - Part 3 of 3 (Product Demo)
Metrics-Based Process Mapping - Part 3 of 3 (Product Demo)Metrics-Based Process Mapping - Part 3 of 3 (Product Demo)
Metrics-Based Process Mapping - Part 3 of 3 (Product Demo)
 
Lean 101
Lean 101Lean 101
Lean 101
 
Value Stream Mapping: From Tool to Management Practice
Value Stream Mapping: From Tool to Management PracticeValue Stream Mapping: From Tool to Management Practice
Value Stream Mapping: From Tool to Management Practice
 
Metrics-Based Process Mapping
Metrics-Based Process Mapping Metrics-Based Process Mapping
Metrics-Based Process Mapping
 
Rapid Improvement: How to Change Behaviors & Get Stuff Done FAST
Rapid Improvement: How to Change Behaviors & Get Stuff Done FASTRapid Improvement: How to Change Behaviors & Get Stuff Done FAST
Rapid Improvement: How to Change Behaviors & Get Stuff Done FAST
 
Process Change: Communication & Training Tips
Process Change:  Communication & Training TipsProcess Change:  Communication & Training Tips
Process Change: Communication & Training Tips
 
Putting an End to "Organizational ADD"
Putting an End to "Organizational ADD"Putting an End to "Organizational ADD"
Putting an End to "Organizational ADD"
 
The Outstanding Organization: The Power of Discipline
The Outstanding Organization: The Power of DisciplineThe Outstanding Organization: The Power of Discipline
The Outstanding Organization: The Power of Discipline
 
The Outstanding Organization: The Power of Engagement
The Outstanding Organization: The Power of EngagementThe Outstanding Organization: The Power of Engagement
The Outstanding Organization: The Power of Engagement
 
Process Management: Why So Few Companies Get It Right
Process Management: Why So Few Companies Get It RightProcess Management: Why So Few Companies Get It Right
Process Management: Why So Few Companies Get It Right
 
Value Stream Mapping: What to Do Before You Dive In
Value Stream Mapping: What to Do Before You Dive InValue Stream Mapping: What to Do Before You Dive In
Value Stream Mapping: What to Do Before You Dive In
 
Value Stream Mapping in Office and Service
Value Stream Mapping in Office and ServiceValue Stream Mapping in Office and Service
Value Stream Mapping in Office and Service
 
Value Stream Map - Mapa do Fluxo de Valor
Value Stream Map - Mapa do Fluxo de ValorValue Stream Map - Mapa do Fluxo de Valor
Value Stream Map - Mapa do Fluxo de Valor
 
Transforming An Organisations IT Service Management
Transforming An Organisations IT Service ManagementTransforming An Organisations IT Service Management
Transforming An Organisations IT Service Management
 
Taller práctico para investigadores y emprendedores sobre uso de patentes c...
Taller práctico para investigadores y emprendedores  sobre uso de patentes  c...Taller práctico para investigadores y emprendedores  sobre uso de patentes  c...
Taller práctico para investigadores y emprendedores sobre uso de patentes c...
 

Similaire à Metrics-Based Process Mapping: What, When & How

Data map - classified according to sensitive, personal, confidential and uncl...
Data map - classified according to sensitive, personal, confidential and uncl...Data map - classified according to sensitive, personal, confidential and uncl...
Data map - classified according to sensitive, personal, confidential and uncl...Ian Clive Oultram
 
Chiere mainframe integration
Chiere mainframe integrationChiere mainframe integration
Chiere mainframe integrationPaolo Chieregatti
 
IT-as-a-Service: Cloud Computing and the Evolving Role of Enterprise IT
IT-as-a-Service: Cloud Computing and the Evolving Role of Enterprise ITIT-as-a-Service: Cloud Computing and the Evolving Role of Enterprise IT
IT-as-a-Service: Cloud Computing and the Evolving Role of Enterprise ITBob Rhubart
 
Aras How To Think About Aras Integrations
Aras How To Think About Aras IntegrationsAras How To Think About Aras Integrations
Aras How To Think About Aras IntegrationsProdeos
 
Aras how-to-think-about-aras-integrations
Aras how-to-think-about-aras-integrationsAras how-to-think-about-aras-integrations
Aras how-to-think-about-aras-integrationshisatsugum
 
Aras PLM Software Integration Basics
Aras PLM Software Integration BasicsAras PLM Software Integration Basics
Aras PLM Software Integration BasicsAras
 
Business Service Semantics: Ontological Representation & Governance of Busine...
Business Service Semantics: Ontological Representation & Governance of Busine...Business Service Semantics: Ontological Representation & Governance of Busine...
Business Service Semantics: Ontological Representation & Governance of Busine...Pieter De Leenheer
 
DATE 2005 - OpenAccess Migration within Philips Semiconductor
DATE 2005 - OpenAccess Migration within Philips SemiconductorDATE 2005 - OpenAccess Migration within Philips Semiconductor
DATE 2005 - OpenAccess Migration within Philips SemiconductorTim55Ehrler
 
Test Data Management for healthcare
Test Data Management for healthcareTest Data Management for healthcare
Test Data Management for healthcareKaren Hsu
 
ATC Global 2012 - SESAR Forum - Keynote speech Patrick Ky
ATC Global 2012 - SESAR Forum - Keynote speech Patrick KyATC Global 2012 - SESAR Forum - Keynote speech Patrick Ky
ATC Global 2012 - SESAR Forum - Keynote speech Patrick KySESAR Joint Undertaking
 
Reference architecture for community clouds
Reference architecture for community cloudsReference architecture for community clouds
Reference architecture for community cloudsJonathan Spindel
 
Integrating Beyond the eCommerce Engine Preparing for the New Face of eBusiness
Integrating Beyond the eCommerce Engine Preparing for the New Face of eBusinessIntegrating Beyond the eCommerce Engine Preparing for the New Face of eBusiness
Integrating Beyond the eCommerce Engine Preparing for the New Face of eBusinessPerficient, Inc.
 
Dassian GOVCON Overview
Dassian GOVCON OverviewDassian GOVCON Overview
Dassian GOVCON OverviewDassian Inc.
 
Customer Lifecycle Oversight Model
Customer Lifecycle Oversight ModelCustomer Lifecycle Oversight Model
Customer Lifecycle Oversight ModelSourcing Sage
 
I Know Iso Systems Diagram 2008.Vsd
I Know Iso Systems Diagram 2008.VsdI Know Iso Systems Diagram 2008.Vsd
I Know Iso Systems Diagram 2008.VsdRaymond Koh
 
Seatwave Web Peformance Optimisation Case Study
Seatwave Web Peformance Optimisation Case StudySeatwave Web Peformance Optimisation Case Study
Seatwave Web Peformance Optimisation Case StudyStephen Thair
 
Integrated Campus Management System on Axpert™
Integrated Campus Management System on Axpert™ Integrated Campus Management System on Axpert™
Integrated Campus Management System on Axpert™ AGILE LABS,INDIA
 
Introduction to ACOORA
Introduction to ACOORAIntroduction to ACOORA
Introduction to ACOORAACOORA
 

Similaire à Metrics-Based Process Mapping: What, When & How (20)

Data map - classified according to sensitive, personal, confidential and uncl...
Data map - classified according to sensitive, personal, confidential and uncl...Data map - classified according to sensitive, personal, confidential and uncl...
Data map - classified according to sensitive, personal, confidential and uncl...
 
Chiere mainframe integration
Chiere mainframe integrationChiere mainframe integration
Chiere mainframe integration
 
IT-as-a-Service: Cloud Computing and the Evolving Role of Enterprise IT
IT-as-a-Service: Cloud Computing and the Evolving Role of Enterprise ITIT-as-a-Service: Cloud Computing and the Evolving Role of Enterprise IT
IT-as-a-Service: Cloud Computing and the Evolving Role of Enterprise IT
 
Aras How To Think About Aras Integrations
Aras How To Think About Aras IntegrationsAras How To Think About Aras Integrations
Aras How To Think About Aras Integrations
 
Aras how-to-think-about-aras-integrations
Aras how-to-think-about-aras-integrationsAras how-to-think-about-aras-integrations
Aras how-to-think-about-aras-integrations
 
Aras PLM Software Integration Basics
Aras PLM Software Integration BasicsAras PLM Software Integration Basics
Aras PLM Software Integration Basics
 
Business Service Semantics: Ontological Representation & Governance of Busine...
Business Service Semantics: Ontological Representation & Governance of Busine...Business Service Semantics: Ontological Representation & Governance of Busine...
Business Service Semantics: Ontological Representation & Governance of Busine...
 
DATE 2005 - OpenAccess Migration within Philips Semiconductor
DATE 2005 - OpenAccess Migration within Philips SemiconductorDATE 2005 - OpenAccess Migration within Philips Semiconductor
DATE 2005 - OpenAccess Migration within Philips Semiconductor
 
Test Data Management for healthcare
Test Data Management for healthcareTest Data Management for healthcare
Test Data Management for healthcare
 
ATC Global 2012 - SESAR Forum - Keynote speech Patrick Ky
ATC Global 2012 - SESAR Forum - Keynote speech Patrick KyATC Global 2012 - SESAR Forum - Keynote speech Patrick Ky
ATC Global 2012 - SESAR Forum - Keynote speech Patrick Ky
 
Reference architecture for community clouds
Reference architecture for community cloudsReference architecture for community clouds
Reference architecture for community clouds
 
Evento sap
Evento sapEvento sap
Evento sap
 
Integrating Beyond the eCommerce Engine Preparing for the New Face of eBusiness
Integrating Beyond the eCommerce Engine Preparing for the New Face of eBusinessIntegrating Beyond the eCommerce Engine Preparing for the New Face of eBusiness
Integrating Beyond the eCommerce Engine Preparing for the New Face of eBusiness
 
July 7 Demo Deck
July 7 Demo DeckJuly 7 Demo Deck
July 7 Demo Deck
 
Dassian GOVCON Overview
Dassian GOVCON OverviewDassian GOVCON Overview
Dassian GOVCON Overview
 
Customer Lifecycle Oversight Model
Customer Lifecycle Oversight ModelCustomer Lifecycle Oversight Model
Customer Lifecycle Oversight Model
 
I Know Iso Systems Diagram 2008.Vsd
I Know Iso Systems Diagram 2008.VsdI Know Iso Systems Diagram 2008.Vsd
I Know Iso Systems Diagram 2008.Vsd
 
Seatwave Web Peformance Optimisation Case Study
Seatwave Web Peformance Optimisation Case StudySeatwave Web Peformance Optimisation Case Study
Seatwave Web Peformance Optimisation Case Study
 
Integrated Campus Management System on Axpert™
Integrated Campus Management System on Axpert™ Integrated Campus Management System on Axpert™
Integrated Campus Management System on Axpert™
 
Introduction to ACOORA
Introduction to ACOORAIntroduction to ACOORA
Introduction to ACOORA
 

Plus de TKMG, Inc.

Metrics-Based Process Mapping
Metrics-Based Process MappingMetrics-Based Process Mapping
Metrics-Based Process MappingTKMG, Inc.
 
Clarity the Essence of Lean Management
Clarity the Essence of Lean ManagementClarity the Essence of Lean Management
Clarity the Essence of Lean ManagementTKMG, Inc.
 
Clarity the Essence of Lean Management
Clarity the Essence of Lean ManagementClarity the Essence of Lean Management
Clarity the Essence of Lean ManagementTKMG, Inc.
 
CLEAR Problem-Solving Questions
CLEAR Problem-Solving QuestionsCLEAR Problem-Solving Questions
CLEAR Problem-Solving QuestionsTKMG, Inc.
 
Clarity First: What it is. Why you need it. How to get it.
Clarity First: What it is. Why you need it. How to get it.Clarity First: What it is. Why you need it. How to get it.
Clarity First: What it is. Why you need it. How to get it.TKMG, Inc.
 
Clarity First - You
Clarity First - YouClarity First - You
Clarity First - YouTKMG, Inc.
 
Clarity First - Problem Solving
Clarity First - Problem Solving Clarity First - Problem Solving
Clarity First - Problem Solving TKMG, Inc.
 
Clarity First: Process & Performance
Clarity First: Process & PerformanceClarity First: Process & Performance
Clarity First: Process & PerformanceTKMG, Inc.
 
Clarity First: Purpose and Priorities
Clarity First: Purpose and PrioritiesClarity First: Purpose and Priorities
Clarity First: Purpose and PrioritiesTKMG, Inc.
 
Clarity First: Overview (1 of 5 webinars)
Clarity First: Overview (1 of 5 webinars)Clarity First: Overview (1 of 5 webinars)
Clarity First: Overview (1 of 5 webinars)TKMG, Inc.
 
Know How Data is Calculated - OEE example
Know How Data is Calculated - OEE exampleKnow How Data is Calculated - OEE example
Know How Data is Calculated - OEE exampleTKMG, Inc.
 
Daily Management Systems
Daily Management SystemsDaily Management Systems
Daily Management SystemsTKMG, Inc.
 
The Trust Factor: Eliminating Waste with a Reliable System
The Trust Factor: Eliminating Waste with a Reliable SystemThe Trust Factor: Eliminating Waste with a Reliable System
The Trust Factor: Eliminating Waste with a Reliable SystemTKMG, Inc.
 
Metrics Based Process Mapping Discount Code
Metrics Based Process Mapping Discount CodeMetrics Based Process Mapping Discount Code
Metrics Based Process Mapping Discount CodeTKMG, Inc.
 
Lean Leadership - Part 3 of 3
Lean Leadership - Part 3 of 3Lean Leadership - Part 3 of 3
Lean Leadership - Part 3 of 3TKMG, Inc.
 
Lean Leadership: Part 2 of 3
Lean Leadership: Part 2 of 3Lean Leadership: Part 2 of 3
Lean Leadership: Part 2 of 3TKMG, Inc.
 
Lean Leadership: Part 1 of 3
Lean Leadership: Part 1 of 3Lean Leadership: Part 1 of 3
Lean Leadership: Part 1 of 3TKMG, Inc.
 
Building the Fit Organization (with guest presenter Dan Markovitz)
Building the Fit Organization (with guest presenter Dan Markovitz)Building the Fit Organization (with guest presenter Dan Markovitz)
Building the Fit Organization (with guest presenter Dan Markovitz)TKMG, Inc.
 
Lean and the Corporate Agenda with Guest Jacob Stoller
Lean and the Corporate Agenda with Guest Jacob StollerLean and the Corporate Agenda with Guest Jacob Stoller
Lean and the Corporate Agenda with Guest Jacob StollerTKMG, Inc.
 
How to Truly Establish a CI Culture
How to Truly Establish a CI CultureHow to Truly Establish a CI Culture
How to Truly Establish a CI CultureTKMG, Inc.
 

Plus de TKMG, Inc. (20)

Metrics-Based Process Mapping
Metrics-Based Process MappingMetrics-Based Process Mapping
Metrics-Based Process Mapping
 
Clarity the Essence of Lean Management
Clarity the Essence of Lean ManagementClarity the Essence of Lean Management
Clarity the Essence of Lean Management
 
Clarity the Essence of Lean Management
Clarity the Essence of Lean ManagementClarity the Essence of Lean Management
Clarity the Essence of Lean Management
 
CLEAR Problem-Solving Questions
CLEAR Problem-Solving QuestionsCLEAR Problem-Solving Questions
CLEAR Problem-Solving Questions
 
Clarity First: What it is. Why you need it. How to get it.
Clarity First: What it is. Why you need it. How to get it.Clarity First: What it is. Why you need it. How to get it.
Clarity First: What it is. Why you need it. How to get it.
 
Clarity First - You
Clarity First - YouClarity First - You
Clarity First - You
 
Clarity First - Problem Solving
Clarity First - Problem Solving Clarity First - Problem Solving
Clarity First - Problem Solving
 
Clarity First: Process & Performance
Clarity First: Process & PerformanceClarity First: Process & Performance
Clarity First: Process & Performance
 
Clarity First: Purpose and Priorities
Clarity First: Purpose and PrioritiesClarity First: Purpose and Priorities
Clarity First: Purpose and Priorities
 
Clarity First: Overview (1 of 5 webinars)
Clarity First: Overview (1 of 5 webinars)Clarity First: Overview (1 of 5 webinars)
Clarity First: Overview (1 of 5 webinars)
 
Know How Data is Calculated - OEE example
Know How Data is Calculated - OEE exampleKnow How Data is Calculated - OEE example
Know How Data is Calculated - OEE example
 
Daily Management Systems
Daily Management SystemsDaily Management Systems
Daily Management Systems
 
The Trust Factor: Eliminating Waste with a Reliable System
The Trust Factor: Eliminating Waste with a Reliable SystemThe Trust Factor: Eliminating Waste with a Reliable System
The Trust Factor: Eliminating Waste with a Reliable System
 
Metrics Based Process Mapping Discount Code
Metrics Based Process Mapping Discount CodeMetrics Based Process Mapping Discount Code
Metrics Based Process Mapping Discount Code
 
Lean Leadership - Part 3 of 3
Lean Leadership - Part 3 of 3Lean Leadership - Part 3 of 3
Lean Leadership - Part 3 of 3
 
Lean Leadership: Part 2 of 3
Lean Leadership: Part 2 of 3Lean Leadership: Part 2 of 3
Lean Leadership: Part 2 of 3
 
Lean Leadership: Part 1 of 3
Lean Leadership: Part 1 of 3Lean Leadership: Part 1 of 3
Lean Leadership: Part 1 of 3
 
Building the Fit Organization (with guest presenter Dan Markovitz)
Building the Fit Organization (with guest presenter Dan Markovitz)Building the Fit Organization (with guest presenter Dan Markovitz)
Building the Fit Organization (with guest presenter Dan Markovitz)
 
Lean and the Corporate Agenda with Guest Jacob Stoller
Lean and the Corporate Agenda with Guest Jacob StollerLean and the Corporate Agenda with Guest Jacob Stoller
Lean and the Corporate Agenda with Guest Jacob Stoller
 
How to Truly Establish a CI Culture
How to Truly Establish a CI CultureHow to Truly Establish a CI Culture
How to Truly Establish a CI Culture
 

Dernier

NAB Show Exhibitor List 2024 - Exhibitors Data
NAB Show Exhibitor List 2024 - Exhibitors DataNAB Show Exhibitor List 2024 - Exhibitors Data
NAB Show Exhibitor List 2024 - Exhibitors DataExhibitors Data
 
Interoperability and ecosystems: Assembling the industrial metaverse
Interoperability and ecosystems:  Assembling the industrial metaverseInteroperability and ecosystems:  Assembling the industrial metaverse
Interoperability and ecosystems: Assembling the industrial metaverseSiemens
 
Guide Complete Set of Residential Architectural Drawings PDF
Guide Complete Set of Residential Architectural Drawings PDFGuide Complete Set of Residential Architectural Drawings PDF
Guide Complete Set of Residential Architectural Drawings PDFChandresh Chudasama
 
WSMM Media and Entertainment Feb_March_Final.pdf
WSMM Media and Entertainment Feb_March_Final.pdfWSMM Media and Entertainment Feb_March_Final.pdf
WSMM Media and Entertainment Feb_March_Final.pdfJamesConcepcion7
 
How to Conduct a Service Gap Analysis for Your Business
How to Conduct a Service Gap Analysis for Your BusinessHow to Conduct a Service Gap Analysis for Your Business
How to Conduct a Service Gap Analysis for Your BusinessHelp Desk Migration
 
Welding Electrode Making Machine By Deccan Dynamics
Welding Electrode Making Machine By Deccan DynamicsWelding Electrode Making Machine By Deccan Dynamics
Welding Electrode Making Machine By Deccan DynamicsIndiaMART InterMESH Limited
 
Strategic Project Finance Essentials: A Project Manager’s Guide to Financial ...
Strategic Project Finance Essentials: A Project Manager’s Guide to Financial ...Strategic Project Finance Essentials: A Project Manager’s Guide to Financial ...
Strategic Project Finance Essentials: A Project Manager’s Guide to Financial ...Aggregage
 
How To Simplify Your Scheduling with AI Calendarfly The Hassle-Free Online Bo...
How To Simplify Your Scheduling with AI Calendarfly The Hassle-Free Online Bo...How To Simplify Your Scheduling with AI Calendarfly The Hassle-Free Online Bo...
How To Simplify Your Scheduling with AI Calendarfly The Hassle-Free Online Bo...SOFTTECHHUB
 
1911 Gold Corporate Presentation Apr 2024.pdf
1911 Gold Corporate Presentation Apr 2024.pdf1911 Gold Corporate Presentation Apr 2024.pdf
1911 Gold Corporate Presentation Apr 2024.pdfShaun Heinrichs
 
Go for Rakhi Bazaar and Pick the Latest Bhaiya Bhabhi Rakhi.pptx
Go for Rakhi Bazaar and Pick the Latest Bhaiya Bhabhi Rakhi.pptxGo for Rakhi Bazaar and Pick the Latest Bhaiya Bhabhi Rakhi.pptx
Go for Rakhi Bazaar and Pick the Latest Bhaiya Bhabhi Rakhi.pptxRakhi Bazaar
 
WSMM Technology February.March Newsletter_vF.pdf
WSMM Technology February.March Newsletter_vF.pdfWSMM Technology February.March Newsletter_vF.pdf
WSMM Technology February.March Newsletter_vF.pdfJamesConcepcion7
 
20200128 Ethical by Design - Whitepaper.pdf
20200128 Ethical by Design - Whitepaper.pdf20200128 Ethical by Design - Whitepaper.pdf
20200128 Ethical by Design - Whitepaper.pdfChris Skinner
 
GUIDELINES ON USEFUL FORMS IN FREIGHT FORWARDING (F) Danny Diep Toh MBA.pdf
GUIDELINES ON USEFUL FORMS IN FREIGHT FORWARDING (F) Danny Diep Toh MBA.pdfGUIDELINES ON USEFUL FORMS IN FREIGHT FORWARDING (F) Danny Diep Toh MBA.pdf
GUIDELINES ON USEFUL FORMS IN FREIGHT FORWARDING (F) Danny Diep Toh MBA.pdfDanny Diep To
 
Data Analytics Strategy Toolkit and Templates
Data Analytics Strategy Toolkit and TemplatesData Analytics Strategy Toolkit and Templates
Data Analytics Strategy Toolkit and TemplatesAurelien Domont, MBA
 
MEP Plans in Construction of Building and Industrial Projects 2024
MEP Plans in Construction of Building and Industrial Projects 2024MEP Plans in Construction of Building and Industrial Projects 2024
MEP Plans in Construction of Building and Industrial Projects 2024Chandresh Chudasama
 
Planetary and Vedic Yagyas Bring Positive Impacts in Life
Planetary and Vedic Yagyas Bring Positive Impacts in LifePlanetary and Vedic Yagyas Bring Positive Impacts in Life
Planetary and Vedic Yagyas Bring Positive Impacts in LifeBhavana Pujan Kendra
 
Fordham -How effective decision-making is within the IT department - Analysis...
Fordham -How effective decision-making is within the IT department - Analysis...Fordham -How effective decision-making is within the IT department - Analysis...
Fordham -How effective decision-making is within the IT department - Analysis...Peter Ward
 
1911 Gold Corporate Presentation Apr 2024.pdf
1911 Gold Corporate Presentation Apr 2024.pdf1911 Gold Corporate Presentation Apr 2024.pdf
1911 Gold Corporate Presentation Apr 2024.pdfShaun Heinrichs
 
Jewish Resources in the Family Resource Centre
Jewish Resources in the Family Resource CentreJewish Resources in the Family Resource Centre
Jewish Resources in the Family Resource CentreNZSG
 

Dernier (20)

NAB Show Exhibitor List 2024 - Exhibitors Data
NAB Show Exhibitor List 2024 - Exhibitors DataNAB Show Exhibitor List 2024 - Exhibitors Data
NAB Show Exhibitor List 2024 - Exhibitors Data
 
Interoperability and ecosystems: Assembling the industrial metaverse
Interoperability and ecosystems:  Assembling the industrial metaverseInteroperability and ecosystems:  Assembling the industrial metaverse
Interoperability and ecosystems: Assembling the industrial metaverse
 
Guide Complete Set of Residential Architectural Drawings PDF
Guide Complete Set of Residential Architectural Drawings PDFGuide Complete Set of Residential Architectural Drawings PDF
Guide Complete Set of Residential Architectural Drawings PDF
 
WSMM Media and Entertainment Feb_March_Final.pdf
WSMM Media and Entertainment Feb_March_Final.pdfWSMM Media and Entertainment Feb_March_Final.pdf
WSMM Media and Entertainment Feb_March_Final.pdf
 
How to Conduct a Service Gap Analysis for Your Business
How to Conduct a Service Gap Analysis for Your BusinessHow to Conduct a Service Gap Analysis for Your Business
How to Conduct a Service Gap Analysis for Your Business
 
Welding Electrode Making Machine By Deccan Dynamics
Welding Electrode Making Machine By Deccan DynamicsWelding Electrode Making Machine By Deccan Dynamics
Welding Electrode Making Machine By Deccan Dynamics
 
Strategic Project Finance Essentials: A Project Manager’s Guide to Financial ...
Strategic Project Finance Essentials: A Project Manager’s Guide to Financial ...Strategic Project Finance Essentials: A Project Manager’s Guide to Financial ...
Strategic Project Finance Essentials: A Project Manager’s Guide to Financial ...
 
How To Simplify Your Scheduling with AI Calendarfly The Hassle-Free Online Bo...
How To Simplify Your Scheduling with AI Calendarfly The Hassle-Free Online Bo...How To Simplify Your Scheduling with AI Calendarfly The Hassle-Free Online Bo...
How To Simplify Your Scheduling with AI Calendarfly The Hassle-Free Online Bo...
 
1911 Gold Corporate Presentation Apr 2024.pdf
1911 Gold Corporate Presentation Apr 2024.pdf1911 Gold Corporate Presentation Apr 2024.pdf
1911 Gold Corporate Presentation Apr 2024.pdf
 
Go for Rakhi Bazaar and Pick the Latest Bhaiya Bhabhi Rakhi.pptx
Go for Rakhi Bazaar and Pick the Latest Bhaiya Bhabhi Rakhi.pptxGo for Rakhi Bazaar and Pick the Latest Bhaiya Bhabhi Rakhi.pptx
Go for Rakhi Bazaar and Pick the Latest Bhaiya Bhabhi Rakhi.pptx
 
WSMM Technology February.March Newsletter_vF.pdf
WSMM Technology February.March Newsletter_vF.pdfWSMM Technology February.March Newsletter_vF.pdf
WSMM Technology February.March Newsletter_vF.pdf
 
20200128 Ethical by Design - Whitepaper.pdf
20200128 Ethical by Design - Whitepaper.pdf20200128 Ethical by Design - Whitepaper.pdf
20200128 Ethical by Design - Whitepaper.pdf
 
GUIDELINES ON USEFUL FORMS IN FREIGHT FORWARDING (F) Danny Diep Toh MBA.pdf
GUIDELINES ON USEFUL FORMS IN FREIGHT FORWARDING (F) Danny Diep Toh MBA.pdfGUIDELINES ON USEFUL FORMS IN FREIGHT FORWARDING (F) Danny Diep Toh MBA.pdf
GUIDELINES ON USEFUL FORMS IN FREIGHT FORWARDING (F) Danny Diep Toh MBA.pdf
 
Data Analytics Strategy Toolkit and Templates
Data Analytics Strategy Toolkit and TemplatesData Analytics Strategy Toolkit and Templates
Data Analytics Strategy Toolkit and Templates
 
MEP Plans in Construction of Building and Industrial Projects 2024
MEP Plans in Construction of Building and Industrial Projects 2024MEP Plans in Construction of Building and Industrial Projects 2024
MEP Plans in Construction of Building and Industrial Projects 2024
 
Planetary and Vedic Yagyas Bring Positive Impacts in Life
Planetary and Vedic Yagyas Bring Positive Impacts in LifePlanetary and Vedic Yagyas Bring Positive Impacts in Life
Planetary and Vedic Yagyas Bring Positive Impacts in Life
 
WAM Corporate Presentation April 12 2024.pdf
WAM Corporate Presentation April 12 2024.pdfWAM Corporate Presentation April 12 2024.pdf
WAM Corporate Presentation April 12 2024.pdf
 
Fordham -How effective decision-making is within the IT department - Analysis...
Fordham -How effective decision-making is within the IT department - Analysis...Fordham -How effective decision-making is within the IT department - Analysis...
Fordham -How effective decision-making is within the IT department - Analysis...
 
1911 Gold Corporate Presentation Apr 2024.pdf
1911 Gold Corporate Presentation Apr 2024.pdf1911 Gold Corporate Presentation Apr 2024.pdf
1911 Gold Corporate Presentation Apr 2024.pdf
 
Jewish Resources in the Family Resource Centre
Jewish Resources in the Family Resource CentreJewish Resources in the Family Resource Centre
Jewish Resources in the Family Resource Centre
 

Metrics-Based Process Mapping: What, When & How

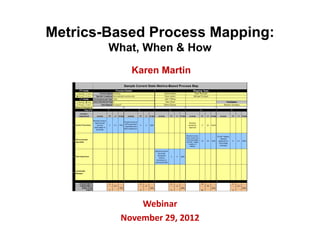
  • 1. Metrics-Based Process Mapping: What, When & How Karen Martin Webinar November 29, 2012
  • 3.  Founder: Karen Martin & Associates, LLC (1993).  Consultant / Coach: Lead Lean transformations &  develop people in office, service and knowledge  environments.  Teacher: University of California, San Diego’s  Lean Enterprise program.  Author: Karen Martin, Principal www.ksmartin.com
  • 4. The Work We Do: Degrees of Granularity Macro View (Strategic; heavy Value Value Stream Map leadership involvement) Stream Process Process Process Micro View Metrics-Based (Tactical; Step Step Step Process Map heavy frontline involvement) 4
  • 5. Value Stream Maps Serve as Visual “Storyboards” Makes the disconnects Shows the linkage and obstacles to flow between material and visible at a macro level information flow 5
  • 6. Repair & Maintenance Value Stream Map Current State Source Refrigeration & HVAC, Inc. Current State Value Stream Map Serv ice Deliv ery Created February 11, 2009 CONFIDENTIAL Customer Great Plains Verisae Excel (Customer) Spreadsheet Special Order (Customer) Part Supplier Tech Upload time Close call in Process Time Pick up Part Process A/P card Verisae Cards at Parts Store ?% Account A/P Admin Tech Manager Payroll Admin Tech (West) PT = 15 mins. PT = 75 mins. PT = 0 mins. PT = 1 mins. PT = 10 mins. %C&A = 85% 40% %C&A = 95% %C&A = 70% %C&A = 90% %C&A = 90% Batch: 1x/day Batch: 1x/day Batch: 1x/day Batch: 1x/day Review Enter Invoices Select & Assess Make Repair; Review Receive Receive Get Part from Complete Call Review Open Review & Invoices; into Verisae & Dispatch Tech Problem ?% Call to raise Service Call Cash; Post customer call Truck in GP Ticket Report Post Invoices Close in Excel; Mail the NTE Data Payment Dispatcher & Verisae (Pac) Invoices Call Center Service Tech Dispatcher Service Billing Admin Posting Admin Tech Tech Account Collections Manager Manager Billing Admin 5 m. 120 m. 90 m. 75 m. 120 m. 240 m. 640 m. 6 days 240 mins. 640 m. Manager 120 m. 60 days PT = 2 mins. PT = 5 mins. PT = 90 mins. PT = 0 mins. PT = 5 mins. PT = 25 mins. PT = 3 mins. PT = 120 mins. PT = 10 mins. %C&A = 60% %C&A = 60% %C&A = 90% %C&A = 80% %C&A = 75% %C&A = 98% PT = 10 mins. PT = 4 mins. %C&A = 40% %C&A = 50% Batch: 1x/day %C&A = 85% %C&A = 95% Batch: 2x/day Batch: 3-5x per wk Batch: 1x/week 0.0833 1.5 10.7 48 10.7 480 hours 2 hours hours 1.25 hours 2 hours 4 hours hours hours 4 hours hours 2 hours hours Lead Time = 572 hours 2 minutes 5 minutes 90 minutes 75 minutes 120 minutes 5 minutes 10 minutes 25 minutes 3 minutes 10 minutes 4 minutes Process Time = 349 minutes Acronym Key %C&A %Complete and Accurate Lead Time to invoice = 86.2 hrs AR Activity Ratio Process Time =5.9 hrs. FTE Full Time Equivalent NOTE: Business hours LT Lead Time Activity Ratio = 6.8% RFPY = 1.1% PT Process Time Lead time to cash = ? days RFPY Rolled First Pass Yield
  • 7. Current State Value Stream Map Outpatient Imaging Services Customer Demand: 15 patients per Day (Takt Time 1920 seconds) Pre-register Schedule 8 hours per day Patient Appointment Referring Hospital Physician 4 1 Lead Time = 24 days 5 3 Lead Time = 990 mins. 6 2 Lead Time = 12 mins. Cycle Time = 30 mins. Cycle Time = 11 mins. % C&A = 65 % Lead Time = 990 mins. Lead Time = 12 mins. % C&A = 100 % % C&A = 98 % CT=Cycle Time LT=Lead Time %C&A=% Complete & Accurate Symposium E Pay Excel ADS Meditech Internet Fax Order PACS Waiting Room Auto Fax 50% Solutions Management Us Mail 25% System MD Mailbox 25% Rework Loop via Fax 25% of the time Prep Complete Transmit Read/Dictate Transcribe Review Print Send Check-in Check-in Patient Exam Images Exam Report Draft/Sign Reports Reports Patient Patient (Tech) (Tech) (Tech) (Radiologist) (MDI) (Radiologist) (Imaging) (Imaging) (Admitting) (Imaging) 5 mins. 5 5 5 mins. 3 6 45 mins. 2 7 30 mins. 2 8 5 mins. 2 9 248 mins. 2 10 365 mins. 6 11 960 mins. 2 12 110 mins. 2 13 120 mins. 6 14 Cycle Time = 2 mins. Cycle Time = 1 mins. Cycle Time = 10 mins. Cycle Time = 15 mins. Cycle Time = 3 mins. Cycle Time = 15 mins. Cycle Time = 5 mins. Cycle Time = 1 mins. Cycle Time = 1 mins. Cycle Time = 3 mins. % C&A = 90 % % C&A = 98 % % C&A = 100 % % C&A = 90 % % C&A = 100 % % C&A = 95 % % C&A = 75 % % C&A = 95 % % C&A = 99 % % C&A = 90 % 5 minutes 45 minutes 30 minutes 5 minutes 248 minutes 365 minutes 960 minutes 110 minutes 120 minutes L/T = 13464 minutes 2 minutes 11520 1 minutes 10 minutes 15 minutes 3 minutes 15 minutes 5 minutes 1 minutes 1 minutes 3 minutes VA/T = 11576 minutes minutes Rolled First Pass yield = 29%
  • 8. Traditional Mapping Method: Process Flow Chart How is this process performing? 8
  • 9. Traditional Swim Lane Process Maps How do we know what to improve? 9
  • 10. Are your processes even documented? 10
  • 13. What is a Metrics-Based Process Map? A visual process analysis tool, which integrates:  Functional orientation of traditional swim lane process maps  Key Lean time and quality metrics Highlights the disconnects / wastes / delays in a process.  Keeps the improvement focus properly directed Serves as standard work for workforce training and process monitoring. 13
  • 15. 15
  • 16. Mapping Preparation  Select a skilled, objective facilitator.  Scope the process being mapped  Opt for narrow current state focus so you can explore deeply and minimize variation.  No decision trees in MBPM (interferes w/ timeline); loopbacks are “linearized.”  Select a cross-functional team of no more than 10.  Process workers (30-50% of the team)  Upstream suppliers  Downstream customers  Subject matter experts (e.g. I.T., legal, etc.)  Outside eyes  Draw 6” wide swim lanes on the 36” paper.  Pre-drawn lines – template available: http://www.scribd.com/doc/114904601/Metrics-Based-Process- Mapping  Chalk line  Manually draw 16
  • 17. Metrics-Based Process Mapping: Four Stages Document the current state (the P in PDSA) Analyze the current state Design, test, refine and implement the future state Document the improved process Continuously monitor and improve the process 17
  • 18. Creating the Current State Metrics- Based Process Map: 10 Steps 1. Label the map. 2. List functions. 3. Document all activities/steps. 4. Number the activities. 5. Add step-specific metrics & other relevant info. 6. Define timeline critical path. 7. Create the timeline. 8. Calculate summary metrics. 9. Identify value-adding and necessary non-value-adding steps. 10. Circle high priority improvement needs. 18
  • 19. Step 1: Label the map Process Name Included/Excluded Conditions Current State MBPM Date Facilitator and/or Team Names
  • 20. Step 2: List functions involved in process. Process Name Function A Included/Excluded Conditions Current State MBPM Date Function B Facilitator and/or Team Names Function C Function D Function E Function F Include external functions, if appropriate (e.g. customers, suppliers/contractors, etc.)
  • 21. Step 3: Document all activities (steps) on 3 x 6” post-its; place sequentially. Step Step Parallel Steps 1 2 (concurrent activities) Ticking clock
  • 22. Step 3: Document all activities/steps on 3 x 6” Post-its Use verb/noun format; clear and concise. Include function. Separate tasks that have different quality outputs or timeframes; combine tasks otherwise. Place post-its in appropriate swim lane, sequentially (according to the ticking clock). Be “the thing.” 22
  • 23. Step 3: Document task & function Activity (Verb / Noun) Function that performs the task
  • 24. Step 4: Number the Activities Step # Note: For parallel activities, use alpha modifiers -- e.g. 8A, 8B, etc.
  • 25. Step 5: Add step-specific information Barriers to Flow (if relevant) # Staff • Batching (if relevant) • Shared resources • System downtime • Etc. PT (Process Time) % Complete & Accurate LT (Lead Time)
  • 26. Key Lean Metrics: Time Process time (PT)  The time it takes to actually perform the work, if one is able to work on it uninterrupted  Includes task-specific doing, talking, and thinking  aka “touch time,” work time, cycle time Lead time (LT)  The elapsed time from the time work is made available until it’s completed and passed on to the next person or department in the chain  aka throughput time, turnaround time, elapsed time  Includes Process Time 26
  • 27. Step-Specific Lead Time vs. Process Time Lead Time Process Time Work Work passed Received to next step LT = PT + Waiting / Delays 27
  • 28. Key Lean Metrics: Quality %Complete and Accurate (%C&A)  % time downstream customer can perform task without having to “CAC” the incoming work:  Correct information or material that was supplied  Add information that should have been supplied  Clarify information that should or could have been clear  This output metric is measured by the immediate downstream customer and all subsequent downstream customers.  If workers further downstream deem the output from a particular step to be less than 100%, multiply their assessment of quality with the previous assessments. 28
  • 29. Dealing with high variation metrics Map the rule (80%), not the exceptions (20%).  For metrics with ranges, use the median. Continue to add conditions to your scope if you need to.  To minimize “it depends” answers. 29
  • 30. Step 6: Define the “Timeline Critical Path” For parallel activities: Chose the longest LT unless a “dead-end” activity
  • 31. Complex Process with Many Concurrent Activities (Parallel Steps) 31
  • 32. Step 7: Create the Timeline
  • 33. Step 8 – Calculate Summary Metrics Timeline PT Sum Timeline LT Sum % Activity  (PT Sum/Total LT Sum) x 100 Rolled %C&A  %C&A x %C&A x %C&A…  Include ALL post-its, not just critical path Labor requirements (next slide) 33
  • 34. Summary Metrics: Labor Effort Total PT  Sum of all activities, not just timeline Labor Requirements Total PT (in hrs) X # occurrences/year # FTEs* = Available work hrs/year/employee** * FTE = Full-Time Equivalent (2 half-time employees = 1 FTE) **Available work hrs/yr/employee = # full-time hrs – paid holidays, vacation & sick time. Full time is typically 2,080 hrs per year. 34
  • 35. Metrics-Based Process Mapping Current State Summary Metrics Projected Projected % Metric Current State Future State Improvement Timeline PT 110 mins Timeline LT 7 days % Activity 3.3% Rolled %C&A 9.2% Total Process 170 mins Time Labor Effort 1/7 FTEs
  • 36. Step 9: Label the value-adding (VA) and necessary non-value adding (N) activities 36
  • 37. Customer-Defined Value Value-Adding (VA) - any operation or activity your external customers value and are (or would be) willing to pay for. Non-Value-Adding (NVA) - any operation or activity that consumes time and/or resources but does not add value to the product (good or service) the customer receives.  Necessary – support processes, regulatory requirements, etc.  Unnecessary – everything else - WASTE 37
  • 38. Step 10: Circle the data that indicates the greatest need for improvement
  • 39. Typical Current State Findings Islands of value-adding activities All other time is “waste.” Rework First Step Last Step Adding Value Future State Design: How can we progress from one “VA” or “N” step to the next and eliminate all waste? 39
  • 40. Future State Design Options Shorten timeline; reduce labor effort  Eliminate unnecessary steps/handoffs  Combine work; move work in parallel  Create continuous (one-piece) flow; use pull systems when needed  Level demand  Balance work Improve quality & predictability  Standardize work  Error-proof work  Make problems visual so they can be fixed immediately 40
  • 41. Future State Projected Summary Metrics: Labor Requirements Total PT  Sum of all activities, not just timeline Labor Requirements Total PT (in hrs) X # occurrences/year # FTEs = Available work hrs/year/employee Freed = Current State FTEs – Future State FTEs Capacity 41
  • 42. Metrics-Based Process Mapping Projected Future State Summary Metrics Projected Projected % Metric Current State Future State Improvement CP PT 110 mins 85 mins 23% CP LT 7 days 4 days 43% Activity Ratio 3.3% 4.4% 33% Rolled %C&A 9.2% 50.4% 448% Total PT 170 mins 140 mins Labor effort* 1.7 FTEs 1.4 FTEs 18% 600 hrs = Freed capacity 0.3 FTEs *Demand = 1,200 per year 42
  • 43. Create an Action Plan: Who, What, When, Where, and How? Future State Implementation Plan Value Stream Outpatient Imaging Implementation Plan Review Dates Executive Sponsor Allen Ward 11/1/2007 Value Stream Champion Sally McKinsey 11/21/2007 Value Stream Mapping Facilitator Dave Parks 12/13/2007 Date Created 10/18/2007 1/10/2008 Block Implementation Schedule (weeks) Date Goal / Objective Improvement Activity Type Owner # 1 2 3 4 5 6 7 8 9 10 11 12 Complete Implement standard work for referral 2 Improve quality of referral KE Sean O'Ryan process Reduce lead time beween schedulingand Dianne 3, 4 Cross-train and colocate work teams PROJ preregistration steps Prichard Eliminate the need for two patient check- Michael 5, 6 Collect copays in Imaging KE ins O'Shea Dianne 6 Eliminate bottleneck in waiting area Balance work / level demand KE Prichard Eliminate lead time associated with 9 Implement voice recognition technology PROJ Sam Parks transcription step 10 Eliminate batched reading Reduce setup required KE Sam Parks Reduce inventory costs, regulatory risk Michael 7 5S CT supplies area; implement kanban KE and storage needs O'Shea 12 Reduce delay in report delivery Implement additional fax ports PROJ Martha Allen Increase percentage of physicians 12 Reduce delay in report delivery receiving electronic delivery (rather than KE Martha Allen hard copy) Approvals Executive Sponsor Value Stream Champion Value Stream Mapping Facilitator Signature: Signature: Signature: Date: Date: Date:
  • 44. When Should You Document Electronically? Archive the team’s work Distribute the maps to remote locations Document the new standard work for the process  Training/retraining staff  Monitoring process performance Communicate the impact of Kaizen Events and other improvement activities Excel product demo: www.vimeo.com/27016122  Fast forward to 8:00 to begin tool demo. 44
  • 45. The Improved State Becomes Standard Work 0 Current State Metrics-Based Process Map PT Units Process Details Mapping Team 1 Seconds Hours Process Name Order Fulfillment Diane O'Shea Ryan Austin 0 Minutes Days Specific Conditions Domestic orders through sales force Sean Michaels Mary Townsend LT Units Occurrences per Year 37,500 Sam Parks 15 Seconds Hours Hours Worked per Day 8 Sally Dampier Facilitator 6 Minutes Days Date Mapped 25-Jun-08 Michael Prichard Dave Morgan -1 Step # ► 1 2 3 4 5 0 Function / Department Activity PT LT %C&A Activity PT LT %C&A Activity PT LT %C&A Activity PT LT %C&A Activity PT LT %C&A Fax PO to Sales 1 Customer 0 0 45% Rep Review PO; clarify with Fax PO to 2 Sales Rep 20 2 90% 10 4 90% customer as warehouse needed 5 Finance Check inventory Warehouse / levels; notify Fax PO to Sales 6 5 4 95% 5 0.33 90% Shipping Sales Rep re: Rep status Critical Path PT 0 20 10 5 5 Critical Path LT 0 2 4 4 0.33 Rolled %C&A 45% 90% 90% 95% 90% Total PT 0 20 10 5 5
  • 46. Color-Coded Summary Metrics Sheet  The Excel mapping tool auto-calculates:  Summary time and quality metrics for before and after maps  Projected % improvement (color-coded for visual ease)  Staffing requirements  User-defined metrics
  • 47. For Further Questions Karen Martin, Principal 7770 Regents Road #635 San Diego, CA 92122 858.677.6799 ksm@ksmartin.com Twitter: @karenmartinopex Blog & newsletter: www.ksmartin.com/subscribe Book info: www.ksmartin.com/MBPM 47